

SUMMARY
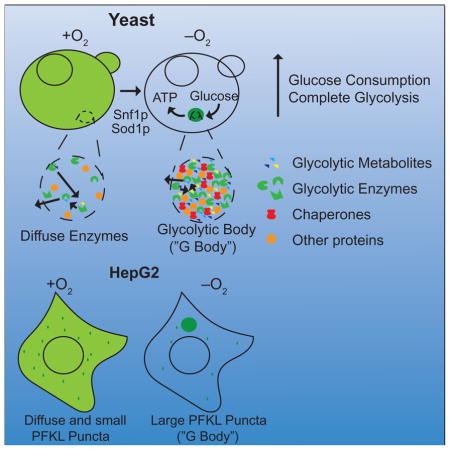
Glycolysis is upregulated under conditions such as hypoxia and high energy demand to promote cell proliferation, although the mechanism remains poorly understood. We find that hypoxia in Saccharomyces cerevisiae induces concentration of glycolytic enzymes, including the Pfk2p subunit of the rate-limiting phosphofructokinase, into a single, non-membrane-bound granule termed the “glycolytic body” or “G body”. A yeast kinome screen identifies the yeast ortholog of AMP-activated protein kinase, Snf1p, as necessary for G body formation. Many G body components identified by proteomics are required for G body integrity. Cells incapable of forming G bodies in hypoxia display abnormal cell division and produce inviable daughter cells. Conversely, cells with G bodies show increased glucose consumption and decreased levels of glycolytic intermediates. Importantly, G bodies form in human hepatocarcinoma cells in hypoxia. Together, our results suggest that G body formation is a conserved, adaptive response to increase glycolytic output during hypoxia or tumorigenesis.
eTOC Blurb
Jin et al. find that hypoxia leads to concentration of glycolytic enzymes into foci referred to as ‘G bodies’ in S. cerevisiae and human hepatocarcinoma cells. G body formation is a conserved, facultative response that may help cells survive and proliferate under low oxygen conditions.
INTRODUCTION
Recent studies have revealed an emerging theme whereby metabolic enzymes organize into intracellular, non-membrane bound structures (O’Connell et al., 2012). For example, multiple enzymes catalyzing de novo purine biosynthesis colocalize to intracellular foci known as purinosomes in human cells cultured under purine-limited conditions (An et al., 2008). A microscopy screen in S. cerevisiae using GFP-tagged proteins revealed more than 100 metabolic enzymes that are soluble in exponential growth conditions but reversibly form cytosolic foci upon nutrient deprivation (Narayanaswamy et al., 2009). These studies highlight the widespread reorganization of metabolic enzymes into facultative assemblies depending on cellular, metabolic demands.
Several roles for stress-induced enzymatic bodies have been speculated, but not resolved (O’Connell et al., 2012). They may enhance catalytic efficiency of a pathway by compartmentalizing enzymes and their respective substrates. Alternatively, enzymatic bodies may be transient storage sites for dormant enzymes or aggregates of damaged enzymes for disposal. Distinguishing among these and other possibilities for enzymatic bodies will help clarify their functions. Further, the mechanism of assembly of intracellular, enzymatic bodies remains incompletely understood. Post-translational modifications may regulate the reversible formation of multi-enzymatic bodies (Bah et al., 2016). Understanding the function and formation of enzymatic bodies may reveal fundamental properties of metabolism.
Glycolysis is a conserved, metabolic pathway that breaks down glucose into pyruvate, releasing free energy as ATP. In addition to surviving the hypoxic environment within a tumor, cancer cells predominantly use glycolysis both in aerobic and hypoxic environments (Vander Heiden et al., 2009, Tran et al., 2016). Altered isoforms and abnormal expression of glycolytic enzymes have been proposed as ways to achieve higher rates of glycolysis observed in cancer cells (Atsumi et al., 2002; Bustamante et al., 1981; Cairns et al., 2011; Christofk et al., 2008). Altered protein localization and substrate channeling have also been proposed to regulate enzymatic and glycolytic activity (Kurganov et al., 1985, Menard et al., 2014). Recent work showing coalescence of certain glycolytic enzymes in yeast and C. elegans neurons under hypoxic stress suggests that changes in localization may be a stress response (Miura et al., 2013; Jang et al., 2016).
In this study, we characterize hypoxia-induced, non-membrane bound granules comprised of glycolytic enzymes that we refer to as glycolytic bodies,” or “G bodies,” in the budding yeast S. cerevisiae and in human hepatocarcinoma cells, confirming and expanding previous studies (Miura et al., 2013, Jang et al., 2016). Cells unable to form G bodies exhibit growth defects, specifically in hypoxia. We further characterized the G body proteome, identifying factors required for G body formation and structure, including HSP70-family chaperones and the yeast ortholog of AMP-activated protein kinase, Snf1p. Our results suggest that G body formation by phase transition of key glycolytic enzymes is a conserved process that is essential for adaptation to hypoxia.
RESULTS
Hypoxia triggers glycolytic body formation in yeast
To determine if hypoxia affects subcellular localization of glycolytic enzymes, we compared the localization of functional, GFP-tagged glycolytic enzymes in normoxia and hypoxia in a BY4741 genetic background (Figure S1A–B). Strikingly, 5 of the 13 fusions – Pfk1p, Pfk2p, Fba1p, Eno2p, and Cdc19p – had uniform, cytosolic distributions under standard culture conditions, but coalesced into cytosolic puncta in hypoxia (Figure 1A, S1B). One to two puncta were observed in most cells after 8 to 16 h of hypoxia, whereas a single focus with increased fluorescence was observed in most cells after 24 h of hypoxia (Figure S1C). Four of the eight remaining GFP-enzyme fusion proteins (Pgi1p, Tdh3p, Gpm1p, Eno1p) also formed solitary puncta in hypoxia, but with greater residual cytoplasmic distribution (Figure S1B). Interestingly, puncta formation in hypoxia required glucose, suggesting that these puncta may function to regulate glycolysis in hypoxia (Figure S1D). The parent strain of BY4741, S288C, contains a hap1 null allele (Gaisne et al. 1999). Hap1p regulates gene expression in hypoxia (Hickman et al. 2007). To eliminate the possibility that puncta formation arises from loss of Hap1p function, we integrated PFK2::GFP into a separate W303 strain wild-type for HAP1 and observed no difference in puncta formation (Figure S2A).
Figure 1. Glycolytic enzymes form G bodies in response to hypoxia.

(A) Glycolytic enzymes form granules upon hypoxia treatment. Yeast cells with the indicated GFP-tagged proteins were cultured with oxygen (+) or in a hypoxic chamber (−) for 24 h. (B) Pfk2p does not form granules in glucose (-Glu) or nitrogen (-N) starved yeast or in yeast grown on a non-fermentable carbon source (EtOH+Gly). (C) Pfk2p colocalizes with Pfk1p, Fba1p, and Cdc19p in yeast grown in hypoxia for 24 h. GFP, green; Azurite, magenta. (D) Pfk2p-GFP forms non-membrane-bound structures after 24 h hypoxic treatment as measured by immunogold (anti-GFP) staining and TEM. (E) Yeast strains co-expressing GFP-tagged Pab1p or Edc3p with Pfk2p-Azurite were subjected to glucose or oxygen deprivation, respectively. Cells were cultured in SMD (5%) to the mid-log phase, and shifted to SM medium for 30 min to induce stress granule formation, or cultured in the hypoxic chamber for 24 h to induce Pfk2 granule formation. Images are representative fluorescence images taken with FITC (GFP) and DAPI (Azurite) channels. (F) Pfk2p granule formation adjacent to a P-body (Edc3p-GFP) was observed occasionally in -O2 treated cells in (E). Scale bar 5 μm (A–E). [See also Figures S1–S2.]
To investigate if puncta formation of glycolytic enzymes is linked to oxygen deprivation and not a general cellular stress response, we evaluated the localization of one of the most robust puncta-forming proteins, the phosphofructokinase subunit, Pfk2p, under various stress conditions. GFP-tagged Pfk2p remained diffuse throughout the cytoplasm of cells when starved of glucose, deprived of nitrogen, or grown on a non-fermentable carbon source (Figure 1B). These results suggest that puncta formation is unique to hypoxia.
To determine if puncta-forming enzymes colocalize, we co-expressed pairs of enzymes tagged with GFP or Azurite. The phosphofructokinase subunits, Pfk1p-GFP and Pfk2p-Azurite, colocalized to the same puncta in cells grown in hypoxia (Figure 1C, S4A). Fba1p-GFP and Cdc19p-GFP also colocalized with Pfk2p-Azurite in cells deprived of oxygen (Figure 1C), indicating that these puncta are single, subcellular foci of concentrated glycolytic enzymes. To further characterize Pfk2p-containing puncta, we detected Pfk2p-GFP in hypoxic cells by immuno-gold labeling and transmission electron microscopy. A non-membrane-bound, electron-dense structure approximately 200–500 nm in diameter contained the vast majority of anti-GFP-conjugated gold particles (Figures 1D, S2C). Moreover, microscopy and fractionation of oxygen- or glucose-deprived cells readily distinguished granules of Pfk2p from the stress granule component Pab1p (Buchan et al., 2008), and the P-body component Edc3p (Kshirsagar and Parker, 2004) (Figure 1E, S2D). Enrichment of Pfk2p in the pellet upon low speed centrifugation indicates that the majority of Pfk2p localizes to G bodies (Fig S2D, S3A). In some cells, Pfk2p was localized adjacent to, but not overlapping with, Edc3p in hypoxia (Figure 1F). Singular puncta formation in hypoxia was not a common feature of cytoplasmic and/or GFP-tagged proteins, as a random sampling of other fusion proteins did not exhibit similar puncta formation in hypoxia (Figure S2B). Taken together, our findings indicate that hypoxia induces the concentration of key glycolytic enzymes into single, non-membrane-bound structures distinct from stress granules and P-bodies. Hereafter, we refer to these granules as “glycolytic bodies” or “G bodies”.
Proteomic Identification of G body Components
To characterize protein components of G bodies, we developed a purification strategy and performed mass spectrometry on purified G bodies. We isolated G bodies by fractionating hypoxic cell lysates, conducting two differential centrifugation steps, and immunoprecipitating Pfk2p-GFP from the pelleted fraction enriched for G bodies (Figure 2A, Figure S3). Purified G bodies were visible as bright foci coating Dynabeads conjugated with an anti-GFP antibody (Figure 2B). Recovery of full-length Pfk2p-GFP was confirmed by Western blot (Figure S4A). We identified 156 candidate G body components (Table S2, Figure S3E). Our analysis eliminated proteins that interacted with Pfk2p in both normoxia and hypoxia, which may explain why we observed only a modest (<2 fold) enrichment of many of the previously validated G body components, such as Eno2p and Cdc19p (Table S2). The mass spectrometry analysis was highly reproducible (Pearson Correlation Coefficient = 0.99, Figure S3B) and well-correlated in enrichment compared to normoxic or no-GFP tag controls (Figure S3C). Similar strategies, but omitting the enrichment steps by differential centrifugation, have been employed to purify glycolytic aggregates using tagged Eno2p as bait (Miura et al., 2013).
Figure 2. Identification of the G body proteome.

(A) Schematic of partial purification of G bodies. Cells were lysed, then G body fractions were concentrated and immunopurified using a monoclonal mouse anti-GFP antibody on Dynabeads. The eluted fraction was then subjected to proteomic mass spectrometry. (B) Cartoon and image of Pfk2p-GFP labeled G bodies bound to Dynabeads. (C) Cellular localization of candidate G body-interacting proteins. Left: Representative confocal maximum intensity projections of Pfk2p-Azurite colocalization in hypoxia with the indicated GFP-tagged protein candidate. Right: Quantitation of the percent of cells with either overlapping or adjacent foci in hypoxia. Top 14 proteins showing colocalizing are shown with Pfk1p-GFP control. (D) Mutant analysis to determine if mass spectrometry candidates are required for Pfk2p-GFP foci/G body formation. Left: Representative maximum intensity projections of Pfk2p-GFP localization in hypoxia in deletions of proteome candidates. Right: Quantitation of Pfk2-GFP G body formation. All scale bars 10 μm. [See also Figures S3–S5]
To determine if candidate G body components formed puncta in hypoxia, we evaluated 130 candidates with GFP tags and identified 33 candidates that formed puncta in hypoxic cells in addition to the previously validated Pfk1p (Table S2). To validate these 33 candidates further as G body components, we examined their colocalization with Pfk2p-Azurite (Figure 1C, 2C). To facilitate high-throughput screening of puncta formation in hypoxia, cells were grown on solid media and fixed in formaldehyde (Figure S4). Of the 33 candidate strains, 11 formed foci overlapping with Pfk2-Azurite and 8 candidates localized adjacent to or only partially overlapping with G bodies. Only two candidates had no detectable colocalization hypoxic cells, and 12 showed a low degree of colocalization (<10% of cells) (Figure 2C, S4C–D). Taken together, we confirmed G body localization of 31 out of 33 candidates identified by mass spectrometry, 29 of which were new G body components. Two factors (Fas1p and Fas2p) that we identified were also validated by colocalization by Miura et al., who also identified 8 unique factors by colocalization studies of their mass spectrometry candidates (Miura et al., 2013, S3D).
G-body resident proteins included the HSP70 chaperones, Ssa1p and Ssa2p, which colocalized with Pfk2p-Azurite in 80–100% of cells. Other heat shock proteins, including Sse2p, Hsp26p and Hsp42p, also colocalized with G bodies at high frequencies (Figure 2C). Additional metabolic proteins also associated with G bodies: Tps1p, a major component of the trehalose-6-phosphate synthase complex, colocalized with G bodies in 60% of cells (Figure 2C, S4C–D); Fas2p, the alpha subunit of the fatty acid synthetase colocalized to G bodies in 31% of cells; and its beta subunit, Fas1p, localized to foci adjacent to G bodies in 12% of cells; and Acc1p, the acetyl-CoA carboxylase necessary for synthesis of fatty acid long chains, in 27% of cells (Figure 2C). Finally, we identified several proteasomal subunits, including Pre3p, Pre8p, and Rpn2p, which localized adjacent to G bodies in 42%, 30% and 16% of cells, respectively. Thus, not only do G bodies consist of glycolytic enzymes, but they also associate with proteins involved in a variety of metabolic and energy-demanding processes, such as proteolysis and fatty acid synthesis (Figure 2C).
To determine if the proteins that colocalized with G bodies are required for their formation, we integrated Pfk2-GFP into the available deletion strains and visualized Pfk2p-GFP foci in hypoxic cells. Most of the deletions showed only modest defects in Pfk2p-GFP foci relative to the wild-type strain. However, loss of SOD1, IRA2, and ARD1 dramatically decreased the formation of Pfk2p-GFP foci, with less than 50% of cells forming a solitary G body, and most cells forming no G bodies or fragmented foci (Figure 2D, S5). Interestingly, the genes required for G body formation were not those that most strongly colocalized with G bodies (Figure 2C–D). Furthermore, loss of the factors that colocalized with G bodies in ≥50% cells had modest effects on G body formation (Figure 2C–D). One explanation for this observation is that strongly colocalizing components, like chaperones, may be functionally redundant, and a single deletion is not sufficient to disrupt G body formation. Together, these data suggest that factors that interact with G bodies can be classified as either constitutively-associated core components or transiently-associated factors, much like the proposed organization of stress granules in a recent study (Jain et al., 2016).
Snf1/AMPK regulates G body formation
Recent studies have highlighted the role of intrinsically disordered regions (IDR) of proteins in driving formation of non-membrane bound, cellular compartments (Elbaum-Garfinkle et al., 2015, Kato et al., 2012, Feric et al., 2016, Murakami et al., 2015, Nielsen et al., 2016). Thus, we examined the sequences of coalescing glycolytic enzymes using IUPred, an algorithm used to predict intrinsically unstructured regions of proteins (Dosztanyi et al., 2005). We identified an IDR near the N-terminus of Pfk2p (Figure 3A). To test if this IDR is required for Pfk2p association with G bodies, we generated a GFP-tagged Pfk2p variant with a deletion of the most disordered residues (Pfk2Δ140-165-GFP). Compared to full-length Pfk2p-GFP, Pfk2Δ140-165p-GFP displayed reduced G body formation, decreased G body fluorescence intensity, and an increase in the proportion of cells with more than one smaller G body, referred to hereafter as fragmented G bodies (Figure 3B). These data suggest that the Pfk2p IDR is required for Pfk2p localization to G bodies.
Figure 3. G Body formation is Snf1-dependent.

(A) Pfk2p intrinsically disordered domain (IDR) as predicted by IUPred in wild-type and 140–165Δ Pfk2p. (B) Cells expressing GFP-tagged 140–165Δ Pfk2p and subjected to 16 h hypoxic treatment contain multiple fragmented granules (indicated by arrows) (p<0.05 versus wild-type by student’s t-test). Average intensity of granules measured by ImageJ (p<0.01 versus wild-type). Error bars represent SEM for at least three independent experiments. (C) A majority of snf1Δ cells display no or fragmented Pfk2p-GFP granules after 16 h hypoxia. Error bars represent SEM for more than three independent experiments. At 8 h, t-test comparing snf1Δ to wild-type, p<0.05 for cells without granules and cells with more than one granule and p<10−4 for cells with one granule. At 16 h, p<0.05 for cells without granules, p<0.01 for cells with more than one granule and cells with one granule. (D–F) Phosphorylation of Pfk2p-GFP is compromised in snf1Δ cells and Pfk2p is phosphorylated at its IDR. Cells expressing GFP-tagged glycolytic enzymes or Pfk2pΔ140–165 were collected after specified durations of anaerobic treatment. Protein extracts were separated by Mn2+-Phos-tag SDS-PAGE and subjected to immunoblotting using a GFP antibody. The images in D and F are from the same blot with the same wild-type control. All scale bars 5 μm. [See also figure S6]
Pfk2p is phosphorylated at several sites within its IDR (Braun et al., 2014, Figure S6B). To identify kinases that might phosphorylate Pfk2p in hypoxia, we examined the distribution of Pfk2p-GFP in a library of strains harboring chromosomal deletions in each of the 177 annotated kinases in the yeast genome. Inactivation of the yeast ortholog of the conserved AMP-activated protein kinase, Snf1p, significantly reduced the sequestration of Pfk2p-GFP in G bodies under hypoxic conditions (Figure 3C). Snf1p dependence is in agreement with previous studies of aggregates of glycolytic enzymes (Miura et al., 2013). After 8 h of hypoxia, 42% of snf1Δ cells lacked any detectable G bodies, compared with only 8% of wild-type cells (Figure 3C). Furthermore, G bodies that form in hypoxic snf1Δ mutants were generally fragmented, unlike the single G body that is characteristic of hypoxic wild-type cells (Figure 3B). Other GFP-tagged glycolytic enzymes, including Pfk1p, Cdc19p and Fba1p, also showed defective G bodies in hypoxic snf1Δ mutants (Figure S6A). Thus, Snf1p is required for robust G body formation in hypoxia. Interestingly, human AMPK, the mammalian ortholog of Snf1, has been shown to act as an energy-state sensor and is active in hypoxia (Hardie et al., 1998; Hardie et al., 2012), which may indicate a conserved function in hypoxic stress response.
To test if direct Snf1p-dependent phosphorylation of Pfk2p could promote G body formation, we performed an in silico analysis for Snf1p phosphorylation sites within the Pfk2p IDR. We identified seven putative sites consistent with Snf1p-dependent sites previously identified and sites that are likely exposed due to their presence in the IDR of Pfk2 (Figure S6B, Braun et al., 2014). Of these, S171 contains a strong putative Snf1p consensus sequence (Figure S6B). Using Phos-tag SDS-PAGE, we detected a substantial Snf1p-dependent decrease in the mobility of Pfk2p in cells deprived of oxygen for 24 h (Figure 3D). We did not detect evidence of phosphorylation of Pfk1p, Fba1p, Eno2p, or Cdc19p, nor did we detect significant phosphorylation of Pfk2p when we deleted its IDR (Figure 3E–F). To validate identified phosphorylation sites in Pfk2p, we generated serine-to-alanine point substitutions at all seven sites (Pfk2-7A-GFP). These substitutions abrogated Snf1p-dependent phosphorylation of Pfk2p in hypoxia (Figure S6C), but did not affect G body formation or sensitivity to loss of Snf1p (Figure S6D-E). S-to-A substitutions within individual putative Snf1p phosphorylation sites in Pfk2p also failed to alter G body formation (Figure S6F). Ultimately, these data suggest that the Snf1p-dependent phosphorylation of the Pfk2p IDR observed in hypoxia is dispensable for G body formation and recruitment of Pfk2p to G bodies.
G body formation alters glycolytic output
Our finding that glycolytic enzymes coalesce into a unique, subcellular compartment during hypoxia in a glucose-dependent manner suggested that G bodies may contribute to the metabolic state/capacity of eukaryotic cells in low oxygen environments. To test this hypothesis, we used mass spectrometry to compare the abundance of intermediate glycolytic metabolites in wild-type and snf1Δ mutants, which have impaired G body formation. Both strains were cultured in hypoxia for 0 h or 16 h and collected in triplicates for metabolic profiling. We applied supervised classification using a partial least squares discriminant analysis, or PLS-DA, to identify metabolites with different concentrations between the two strains. Previous studies have shown altered protein and mRNA levels when SNF1 is deleted (Usaite et al. 2009). Furthermore, metabolite levels were found to be more divergent in snf1Δ cells under stress conditions (Humston et al., 2008). In aerobic conditions, the metabolic profiles of snf1Δ and wild-type cells were virtually indistinguishable (Figure 4A). However, in hypoxic conditions, the metabolic profiles of snf1Δ and wild-type cells diverged. This difference can be attributed to increased levels of glucose-6-phosphate, fructose-6-phosphate (F6P) and fructose-1,6-bisphosphate (FBP), and decreased levels of 6-phosphogluconate, ribose/xylulose 5-phosphate, and acetyl-CoA (aCoA) in snf1Δ cells compared to wild-type cells (Figure 4B). Notably, Pfk2 catalyzes the conversion of F6P to FBP (Figure 4B). Although FBP levels were increased in snf1Δ cells, the substantial decrease in aCoA of snf1Δ cells compared to wild-type in hypoxia suggests that FBP is further processed to aCoA in the presence of fully formed G bodies. The increase in upstream metabolites and decrease in downstream metabolites in snf1Δ cells suggest that fully formed G bodies promote cycling through the entire glycolytic pathway.
Figure 4. Snf1 regulates glycolytic activity under hypoxic conditions.

(A) Hypoxia and snf1 deletion result in remodeling of metabolic pathways. Cross-validated partial least squares discriminant analysis (PLS-DA) score plot (R2Y=0.936; Q2=0.454) shows separation of wild-type and snf1Δ samples at time 0 and after 16 h hypoxic treatment. Shaded ovals represent 95% confidence intervals. Solid circles represent individual replicates. (B) Four key metabolites in the glycolysis pathway contribute to the metabolic differences observed in (A). Boxplot colors represent samples as in (A). (C–E) Phloxine B staining indicates high bud cell death in pfk2Δ cells after 24 h hypoxia. Dead cells were defined as those with fluorescence signal in the FITC channel. Quantification in (D, E) is based on N>300 cells per strain. Cartoon is of mother cell and daughters in the dotted box, green indicates Phloxine B. (F) Pfk1p-GFP and Cdc19p-GFP form granules in pfk2Δ cells. C, F scale bar 5 μm. Cartoon is of mother cell and daughters in the dotted box, green indicates GFP-tagged protein. (G) Cells with G bodies have significantly less glucose than cells lacking G bodies by t-test at t = 3 h (p=0.0035) and t = 4.5 h (p=0.035). Error bars represent SEM for three biological replicates in each condition. [See also Figure S7]
To provide further evidence that G body formation facilitates glucose metabolism in hypoxia, we tested glucose consumption by wild-type cells with or without G bodies in hypoxic conditions (Figure S7A). Cells were preconditioned in hypoxic or normoxic conditions for 20 h such that they had either formed G bodies or not. Cells were then transferred in new media to a hypoxic environment where glucose levels were monitored over time using a fluorometric assay. After 3 h and 4.5 h of hypoxia, glucose levels were significantly lower in media collected from cells with G bodies compared to media from cells without G bodies (p = 0.0035 and 0.035 respectively) (Figure 4G). These data suggest that cells with G bodies consume glucose at a faster rate. Cells from both conditions grew at similar rates in hypoxia, suggesting that the difference in glucose consumption was not due to cell number (Figure S7B). Furthermore, cells with G bodies maintained their G bodies, while cells without G bodies had not formed them to any detectable levels after 4.5 h in hypoxia, indicating G body status was retained during the period of analysis (Figure S7C). In concert with the metabolomics analysis, our data support the hypothesis that G bodies promote glycolysis during hypoxic stress.
Pfk2p promotes daughter cell G body formation and viability in hypoxia
Unlike the deletion mutants of other glycolytic enzymes, such as fba1Δ and cdc19Δ, which are inviable under standard normoxic culture conditions (Breslow et al., 2008; Giaever et al., 2002), deletion of PFK2 does not affect cell viability or proliferation under standard normoxic culture conditions, as demonstrated by a lack of dead cells by staining with the vital dye Phloxine B (Figure 4C). However, pfk2Δ cells shifted to hypoxic conditions for 24 h showed a striking budding defect: unlike wild type cells, most pfk2Δ mother cells remained attached to multiple dead daughter cells (Figure 4C–E). Furthermore, G bodies marked with Pfk1p-GFP or Cdc19p-GFP were detected in fewer than 5% of dead daughters, while nearly all pfk2Δ mother cells possessed G bodies, as detected by Pfk1p-GFP or Cdc19p-GFP (Figure 4F). Our data indicate that cell viability in hypoxic environments is significantly correlated with the presence of G bodies: in the genetically sensitized pfk2Δ background, mother cells retained the ability to form G bodies and remained viable, while her daughters were incapable of forming detectable G bodies and died under hypoxic stress. Thus, G bodies are likely biologically relevant structures that form in response to hypoxic stress.
G bodies are present in human hepatocarcinoma cells under hypoxic stress
Next, we investigated whether the hypoxia-induced concentration of glycolytic enzymes into G bodies that we observed in yeast also occurs in mammalian cells. We compared the distribution of a human phosphofructokinase isoform, PFKL, in HepG2 human hepatocarcinoma cells under hypoxic (1% oxygen) and normoxic conditions by immunohistochemistry (Figure 5A). PFKL positive granules were detected after 1 h of hypoxic growth and increased in both size and number when cells remained in hypoxic environments (Figure 5B). Redox or osmotic stress did not trigger sequestration of PFKL in granules but did elicit the formation of stress granules (Figure S8). Although PFKL foci are not stress granules, we still hypothesized that RNA was important for G body formation because RNA has been shown to tune the assembly dynamics of many phase-separated bodies and regulate their biophysical properties (Guo et al., 2015). To test this hypothesis, we treated cells with RNase and found that G-body formation in mammalian cell culture was inhibited by RNase treatment (Figure 5C), suggesting that RNA is required for the formation and/or stabilization of mammalian G-bodies. Together, these data suggest that G body formation under hypoxic stress is a conserved feature of eukaryotic cells.
Figure 5. G bodies containing PFKL form in hypoxic mammalian cells.

(A) Pfk2p homolog, PFKL, forms granules in HepG2 cells maintained in 1% oxygen for 24 h. (B) Time course of PFKL granule formation under hypoxic conditions. HepG2 cells were kept in 1% oxygen for indicated times (1, 3, 8, and 24 h). As a control, cells were cultured under normoxic conditions. (C) Formation of PFKL bodies is dependent on RNA. RNaseA treatment of cells maintained in 1% oxygen for 24 h decreases PFKL bodies compared to vehicle. (A–C) All cells were fixed and stained with anti-PFKL antibody to examine granule formation. All scale bars 10 μm. [See also Figure S8]
DISCUSSION
In this study, we characterized a facultative, non-membrane bound compartment in eukaryotic cells, which we term G bodies. G bodies assemble in hypoxia and are comprised of multiple glycolytic enzymes. Concentration of glycolytic enzymes, including Pfk1p, Pfk2p and Cdc19p, which catalyze the rate-limiting steps in glycolysis, functions to increase the glycolytic rate in hypoxia. This is biologically relevant, as cells lacking the G body component Pfk2, or Snf1, a kinase required for their formation, have decreased cellular viability and altered metabolism under hypoxic stress. Using both genetic and proteomic approaches, we identified and validated additional proteins that interact with and/or regulate G bodies, including stress response proteins, protein chaperones, and other metabolic enzymes. Further, we found that human cancer cells cultured under hypoxic conditions form G bodies. These findings suggest that G bodies are important, conserved, facultative structures that cells employ to adapt to hypoxia.
Regulation of G bodies
We identified several factors required for G body formation, including Sod1p, Ira2p and Ddr48p. Each of these proteins is involved in different aspects of stress response. Sod1p converts superoxide radicals to hydrogen peroxide; Ira2p lowers cAMP levels in low nutrient conditions through interactions with Ras; and, Ddr48p recognizes DNA replication stress. Although single deletions of chaperone proteins that localize to G bodies did not greatly affect G body formation, it is possible that they function redundantly for critical G body regulation.
The formation of G bodies also relies on the Snf1p, which is dispensable for survival under normoxic conditions but essential for G body formation and cell proliferation in hypoxic conditions. Although our data suggest that Pfk2p is modified in a Snf1p-dependent manner in hypoxia, loss of all candidate Snf1p-dependent phosphorylation sites in the Pfk2p N-terminal IDR, which is required for G body formation, does not inhibit G body formation. This suggests that Snf1p-dependent phosphorylation of Pfk2p’s IDR alone is insufficient to drive its localization to G bodies, but may function upstream to affect G body coalescence.
Further studies may reveal how these regulatory components interact and how phosphorylation by Snf1p serves as switch to drive G-body formation. Snf1p may target G body components or trigger intermediate signaling events that ultimately lead to aggregation of glycolytic enzymes. In this model, Snf1p could phosphorylate many G body components or function upstream on a factor that promotes G body formation and recruitment of Pfk2 and other glycolytic enzymes, regardless of specific phosphorylation events. This hypothesis is consistent with our observation that while other glycolytic enzymes, including Pfk1p, Cdc19p and Fba1p also localize to G bodies in a Snf1p-dependent manner (Figure S6A), they are nevertheless predicted to be poor Snf1p substrates based on in silico analysis for the Snf1p (R-X-X-[S/T]) motif.
G body Dynamics
Our data show that G bodies have a number of features common to known phase-separated bodies. Our electron microscopy imaging indicates that G bodies, like P granules, stress bodies, and P bodies, are not membrane bound (Protter et al., 2016). Further, some G body components, including Pfk2p, contain IDRs, a feature of proteins that undergo phase transitions. G bodies also contain structural elements characteristic of ribonucleoproteins. Although G bodies lack the core component of stress granules, Pab1, they contain many chaperones, which are emerging as important components of phase-separated granules (Wallace et al., 2015; Jain et al. 2016). Finally, inhibition of G body formation in mammalian cells by RNase treatment suggests G bodies are RNA dependent. This RNA dependence may reflect a structural role in G bodies.
Physiological Relevance of the G body
Our data suggest that Snf1p also influences cellular metabolism in hypoxic conditions. We speculate that concentrating glycolytic enzymes within G bodies may rapidly increase and sustain the metabolic efficiency of cells in hypoxic microenvironments, including in solid tumors. Knockout of PFK2 caused an increase in bud mortality in hypoxic conditions. It is possible that the decrease in mother cell glycolysis precludes the daughter cell from properly forming G bodies, resulting in a fitness defect. Further support for this hypothesis comes from the association of multiple subunits of energy-dependent protein complexes with G bodies. We have shown that multiple protein components of the 26S proteasome, the fatty acid synthetase complex, and the trehalose-6-phosphate synthase complex are either recruited to G bodies or localize adjacent to G bodies. If G bodies indeed increase the rate of glycolysis, they could increase local ATP concentrations to provide energy for these essential processes. These interactions between foci and within G bodies suggest that these structures are dynamic and that different complexes may be recruited to G bodies to meet the metabolic needs of the cell at a given time. Further, the use of G bodies as glycolytic factories might explain the survival of cancer cells in the hypoxic environment of solid tumors and possibly be related to the Warburg effect (Vander Heiden et al., 2009). Investigation of the significance of G bodies across multiple cancer types may open new avenues for therapeutic targeting.
Many questions remain unanswered. Foremost, what drives the phase transition of glycolytic enzymes into G bodies? Recent studies suggest that multivalent, weak interactions can drive coalescence of proteins into a condensed phase (Guo et al., 2015). Therefore, it is possible that the transient, enzyme-enzyme interactions during catalysis are repurposed to drive the formation of G bodies. If so, the formation of these multi-enzyme assemblies may be a common feature of metabolic enzymes. Second, how is hypoxia sensed by G body regulators, and how do these regulators convey this signal to G body components? Finally, the physiological role that G-bodies play in multicellular organisms remains to be fully explored, as the hypoxic conditions associated with metabolically demanding processes may promote G-body formation. Therefore, G bodies may add to the expanding repertoire of phase transition-mediated regulatory mechanisms employed by organisms during development as well as in response to environmental stress (Molliex et al., 2015, Protter et al., 2016).
EXPERIMENTAL PROCEDURES
Yeast strains, media, and culture
Yeast strains used are listed in Supplemental Table S1. Gene deletions and C-terminal tags were generated using standard methods (Gueldener et al., 2002; Longtine et al., 1998). The Azurite C-terminal tagging plasmid was generated by swapping the GFP encoding region of pFA6a-GFP(S65T)-kanMX6 (Longtine et al., 1998) with the Azurite-encoding region from the plasmid pB18cmBFPAzurite (Addgene, plasmid #14034). Unless otherwise indicated, yeast strains were cultured to mid-log phase in YPD (1% (w/v) yeast extract, 2% (w/v) peptone) supplemented with 5% glucose. Hypoxic culturing conditions were achieved using the AnaeroPack System (Mitsubishi Gas Chemical).
Yeast fluorescence microscopy imaging
Yeast samples were cultured in standard SMD medium with 5% glucose (exceptions indicated). Unless noted, images of live cells were collected on a Deltavision Elite deconvolution microscope (GE Healthcare/Applied Precision) on a 100x objective (CoolSnap HQ, Photometrics). 16-image z stacks with 0.25-μm spacing were taken to cover the entire cell. For the experiments to test colocalization, the images of a best-focused single stack were presented. For other purposes, all stacks of images were projected, and analyzed in ImageJ.
Light microscopy images for Supplementary Figures S1C, S2, S5, S6, and 2D were captured on a Zeiss AxioImager M2 with an ORCA-Flash 4.0 LT camera and processed with Zeiss Zen2 software. Representative images of a best-focused single stack are presented. Images for S7 and 4D were captured and processed using a Zeiss Apotome 2.0. For strains in Supplementary Figure S2B with weak GFP signal, a center snap at a longer exposure is used for the representative image. Images for Figure S4 and 2C were imaged on a Zeiss LSM 510 META confocal in z stacks and analyzed using Zeiss Zen 2.0 software.
Immuno-transmission electron microscopy
To observe yeast Pfk2p-GFP, cells were grown in an anaerobic chamber for 24 h and processed as described previously (Yen et al., 2010) with minor modifications: sections were stained overnight with a custom rabbit polyclonal anti-GFP peptide antibody in Can Get Signal Immunostain Solution B (TOYOBO CO., LTD, Japan) at 20°C, and labeled with 10 nm colloidal gold conjugated goat anti-mouse IgG for 1 h at 20°C. The sections were examined using an HT7700 electron microscope (Hitachi High-Technologies, Japan) at 100kV.
Metabolomics assay
Sample preparation
A mixture of methanol, chloroform, and water (8:1:1) with isotope labeled internal standards was used to extract metabolites from yeast pellets. Cells were resuspended in 0.4 ml extraction solvent, transferred to 1.5 ml tubes, washed with 0.4 ml extraction solvent, combined, homogenized using a probe sonicator, kept on ice for 5 min, vortexed, and then centrifuged at 13000 rpm for 5 min. The supernatant containing metabolites were transferred to autosampler vials for LC-MS analysis. A series of calibration standards were prepared along with samples to quantify metabolites.
LC-MS analysis
An Agilent 1260 chromatography with Agilent 6520 Quadrupole-Time-Of-Flight mass spectrometer (Agilent Technologies) and 150×1mm Luna NH2 hydrophilic interaction chromatography column (Phenomenex) was used for chromatographic separation (Lorenz et al., 2011). The mass spectrometer was operated in negative ESI mode, and parameters were set as listed: Gas temp: 350°C, drying gas: 10 l/min, nebulizer: 20 psi; Mobile phase A: 5 mM ammonium acetate in H2O with pH adjusted to 9.9 with ammonia; Mobile phase B: 100% acetonitrile; Flow rate: 0.075 ml/min; Solvent gradient: 0 min, 80% B, 15 min, 0% B, hold 5 min. Data were processed by MassHunter workstation software, version B.06.
Data analysis
Metabolomic data analysis was performed using the MetaboAnalyst 2.0 web server (Xia et al., 2012). Metabolite concentrations were normalized to input dry weights, log transformed, and auto-scaled. Partial least squares discriminant analysis (PLS-DA), a supervised multivariate regression method, was used to discover the principal components contributing to the variance in the metabolite concentration data. One-way Analysis of Variance (ANOVA) analyses were performed to determine significantly different metabolites, followed by Fisher’s least significant difference method to determine the direction of change.
Yeast protein western blotting
Protein extracts were prepared from yeast cells equal to one OD600 units. 10% of the total protein extracts were separated by SDS-PAGE and subjected to immunoblotting analysis. Phos-tag SDS-PAGE (Wako) was used to separate phosphorylated proteins (Supplementary Figure S6C). Antiserum to probe Pgk1 was a generous gift from Dr. Jeremy Thorner, University of California, Berkeley. GFP fusion proteins were detected using a custom rabbit polyclonal peptide antibody.
Immunoprecipitation of G Bodies
Covalent Crosslinking of Dynabeads
Protein G Dynabeads (ThermoFisher Scientific, 10003D) were coupled to monoclonal mouse anti-GFP antibody 3E6 (ThermoFisher Scientific, A-11120). Antibody (10ug/sample) and Dynabeads (50uL/sample) were incubated in 250 uL PBST on a nutator for 1 h at RT, and washed 3X in 500 μL PBST. Dynabeads were then washed 3X in 500 μL 0.2 M sodium borate, pH 9.0 and resuspended in 450 μL of the same buffer. To crosslink, 50 μL of 220 mM dimethylpimelimidate (Sigma D 8388) was added, and tubes were rotated 30 min at RT. Dynabeads were then washed 2X in 1 mL 0.2 M ethanolamine, 0.2 M NaCl pH 8.5, resuspended in 1 mL of the same buffer, and rotated 1 h at 25°C. Beads were then resuspended in 250 μL of the same buffer and stored at 4°C until use.
Immunoprecipitation
Cultures were inoculated from overnight starter cultures to an OD600 of 0.03 and grown for 17 h in hypoxia to an OD600 between 0.9 and 1.1 in YPD. Normoxic cultures were grown to an OD600 of 1. A total of 150ml of culture was spun down at 3,000Xg for 10 min and resuspended in 1.5 ml lysis buffer (1XPBS pH 7.4, 0.5% Tween-20, 1 mM PMSF, 1 mM MgCl2 complete EDTA free protease inhibitor cocktail) and bead beat for 10 min. After a 500Xg 5 min spin, the crude supernatant was pelleted at 5,000Xg for 5 min. The resulting G-body-containing pellet (P5) was resuspended in 200 μL lysis buffer and incubated with Dynabeads for 2 h at 4°C. The supernatant (S5) was saved as the flow-through fraction (FT). Beads were washed 3X in 200 μL of 0.2 M phosphate citrate pH 5.6, resuspended in 50 μL 0.1 M Tris-HCl pH 7.5, 2% SDS, 100 mM DTT, and heated at 95°C to elute the protein. The eluate was stored at −80°C.
Western Blotting of IP Samples
At each step in the purification, 10% each of the crude lysate, S5, P5, FT was stored 1:1 in 2X Tris-Glycine sample buffer at −80°C. The samples were subjected to standard immunoblotting procedures. Primary antibodies used: a custom rabbit polyclonal anti-GFP; mouse anti-PMA-1 (Molecular Probes, 40B7); rabbit polyclonal anti-Pep12 (Molecular Probes, 710037). Secondary antibodies: horseradish peroxidase-coupled goat anti-rabbit or sheep anti-mouse antibodies. The blots were developed with ECL substrates and imaged in a BioRad ChemiDoc Touch system.
Pfk2p-GFP Mass Spectrometry
Proteins were precipitated with 23% TCA and washed with acetone. Protein pellets were solubilized in 8 M urea 100 mM Tris pH 8.5, reduced with 5 mM Tris(2-carboxyethyl)phosphine hydrochloride (Sigma-Aldrich, product C4706), and alkylated with 55 mM 2-chloroacetamide (Fluka Analytical, product 22790). Proteins were digested for 18 hr at 37 °C in 2 M urea 100 mM Tris pH 8.5, 1 mM Ca Cl2 with 2 ug trypsin (Promega, product V5111). Twelve–step MudPIT analysis was performed using an Agilent 1200 G1311 quaternary pump and a Thermo LTQ Orbitrap Velos Pro using an in-house built electrospray stage (Wolters et al., 2001).
Protein and peptide identification as well as protein quantitation were done with Integrated Proteomics Pipeline - IP2 (Integrated Proteomics Applications, Inc.). Tandem mass spectra were extracted from raw files using RawConverter (He et al., 2015) with monoisotopic peak option and searched against a SGD protein database (http://downloads.yeastgenome.org/sequence/S288C_reference/orf_protein/orf_trans), released 1/13/2015 with reversed sequences and recombinant proteins added using ProLuCID (Peng et al., 2003, Xu et al., 2015). The search space included all fully-tryptic and half-tryptic peptide candidates with a fixed modification of 57.02146 on C. Peptide candidates were filtered using DTASelect (Tabb et al., 2002).
Analysis of Mass Spectrometry Data
For each protein, averages of peptide counts for two biological replicates were taken. The proportion of total spectral counts was calculated, and both the ratio of this proportion to the wild-type control, as well as the ratio to the normoxic Pfk2p-GFP samples, were calculated. A cutoff of two-fold enrichment over each control condition was applied for further screening. Peptides present in only one hypoxic Pfk2p-GFP sample and peptides with fewer than 10 spectral counts were censored.
Screening and Validation of Mass Spectrometry Hits
GFP Library Screening
For proteins that satisfied our criteria to be Pfk2p-interacting candidates, the corresponding GFP tagged strain, if available, was picked from the yeast GFP tagged library (Huh et al., 2003). These strains were then imaged in normoxia and hypoxia. Any strain with punctate localization in hypoxia was selected for further analysis.
KO Library Screening
For each strain with punctate localization, the corresponding strain in the yeast knockout library was picked, if available. These were integrated with Pfk2p-GFP::HIS3 amplified from THY62 (Table S1). Cells were grown for 18 h in hypoxia, pelleted at 500Xg for 5 min, and fixed for 20 min at 25°C in 50 μL PBS with 5 μL 37% formaldehyde. Cells were washed and resuspended in PBS for microscopy analysis. Biological triplicates were scored, and the weighted averages and standard deviations are reported.
Colocalization
GFP tagged strains had Pfk2-Azurite::Kan integrated in place of endogenous Pfk2. These strains were grown on solid YPD with 5% glucose and 200 μg/L G418 (Sigma G8168) for two days and then shifted to hypoxia for one day. Single colonies were fixed in 4% formaldehyde/PBS for 20 min at RT. Cells were then washed in PBS and resuspended in PBS for microscopy analysis.
Glucose Flux Measurements
Cells were inocculated into 3 mL SMD with 5% glucose from overnight starter cultures grown in YPD and grown for 20 h in normoxic or hypoxic conditions. The resultant cultures were then used to reinoculate three 700 μL cultures in SMD with 0.5% glucose. Each sample was placed in a separate hypoxic box and grown, shaking, until sampling at 0, 1.5, 3 and 4.5 h post reinocculation. OD600 was measured and a 100 μL sample was stored at −80°C until use. Glucose levels were measured using a colorimetric assay from BioVision (K606) and read at 570 nm on a Tecan Infinite M200.
Mammalian cell lines, materials, and culture
The HepG2 cell line was from ATCC (HB-8065). Other reagents: DMEM (Life Technologies, 11995); fetal bovine serum (Hyclone, SH30071.03); PFKL antibody (ATLAS, HPA030047); G3BP antibody (BD Transduction Laboratories, 611126); Alexa Fluor 488 goat anti-rabbit IgG (A-11008) and 594 goat anti-mouse IgG (A-11005) (Life Technologies); sorbitol (ThermoFisher, 50-213-665); and paraformadelhyde (Sigma, P6148).
For hypoxia treatment, cells were maintained in the Modular Incubator Chamber (Billups-Rothenberg Inc.), which was balanced with 1% oxygen air (1% O2, 5% CO2 and 94% N2) for the times indicated. For the arsenite and sorbitol treatments, final concentrations of arsentine (500 μM) or sorbitol (500 mM) were added to the cell culture medium for 30 min. Cells were then fixed for staining. For RNase treatment, cells were kept in 1% O2 for 24 h. RNase A was then added to the culture medium at the working concentration of 80 μg/ml. Cells were rebalanced to 1% O2 and maintained for another 3 h before fixing and staining.
Mammalian cell immunofluorescence imaging
Cells were fixed in 4% paraformadelhyde in PBS for 15 min at RT. After rinsing 2X with PBS, cells were permeabilized with 0.2% Triton X-100 in PBS for 10 min and blocked with 2% BSA in PBS for 1 h. Cells on coverglass were incubated with primary antibody diluted in PBS with 2% BSA at 4°C overnight. Antibodies were used at the following dilutions: PFKL (1:500), G3BP (1:500). Cells were rinsed 3X with PBS containing 0.02% Tween-20 (PBS-T). Secondary antibodies were diluted in PBS with 2% BSA, and cells were incubated at RT for 1 h. The secondary antibodies used were Alexa Fluor 488 goat anti-rabbit IgG and 594 goat anti-mouse IgG (1:500, Invitrogen). After rinsing 3X with PBS-T, cells on the coverglass were mounted on microscope slides with Prolong Gold anti-fade reagent (Invitrogen). Images were taken using a Leica TCS SP5 confocal microscope with a 63x oil immersion objective and processed using Photoshop software (Adobe).
Supplementary Material
Supplemental Table 2. Mass Spectrometry of G Bodies. Related to Figure 2. Proteins with spectral counts and coverage recovered from mass spectrometry. Tab 1 shows proteins screened for colocalization with Pfk2-azurite. Tab 2 shows full dataset with proteins selected for further screening highlighted.
Highlights.
Hypoxia drives glycolysis enzymes into cytosolic foci termed Glycolytic (G) bodies.
Purified G bodies contain over 30 proteins and formation requires AMP kinase, Snf1p.
G body presence correlates with increased glucose consumption and cell survival.
G bodies are conserved in human cells and require RNA for formation.
Acknowledgments
We thank Nicita Mehta, Allison Billi, Natasha Weiser, Ali Frand, Helen Pickersgill, Angela Andersen, and Gary Ruvkun for critical comments on the manuscript. This work utilized Metabolomics Core Services supported by grant U24 DK097153 of NIH Common Funds Project to the University of Michigan. This work was also supported by grants from the American Cancer Society (RSG RMC-125264) and NIH (GM088565-05 and GM11875-01) to JKK, NIH (GM053396) to DJK, National Center for Research Resources (5P41RR011823) and NIH (8 P41 GM103533) to JRY, and a Grant-in-Aid for Scientific Research (2450076) to MB. The authors declare no conflicts of interest.
Footnotes
Author contributions. MJ, TH, GF and JKK designed the experiments; DJK and JKK supervised the project; MJ, TH, GF, AFA and ADG: yeast experiments; MAF: computational analyses; JJM and JRY: mass spectrometry analysis; MAF and AK: analysis of metabolomics data; YY and KI: mammalian cell culture experiments; MB: electron microscopy; NR: pilot studies for glucose flux measurements; MJ, TH, GF, AFA, MAF, and JKK wrote the manuscript.
Accession Numbers. The mass spectrometry proteomics data have been deposited to the ProteomeXchange Consortium via the PRIDE (Vizcaíno et al., 2016) partner repository with the dataset identifier PXD006686 and 10.6019/PXD006686.
Publisher's Disclaimer: This is a PDF file of an unedited manuscript that has been accepted for publication. As a service to our customers we are providing this early version of the manuscript. The manuscript will undergo copyediting, typesetting, and review of the resulting proof before it is published in its final citable form. Please note that during the production process errors may be discovered which could affect the content, and all legal disclaimers that apply to the journal pertain.
References
- An S, Kumar R, Sheets ED, Benkovic SJ. Reversible compartmentalization of de novo purine biosynthetic complexes in living cells. Science. 2008;320:103–106. doi: 10.1126/science.1152241. [DOI] [PubMed] [Google Scholar]
- Anderson P, Kedersha N. RNA granules: post-transcriptional and epigenetic modulators of gene expression. Nature Reviews Molecular Cell Biology. 2009;10:430–436. doi: 10.1038/nrm2694. [DOI] [PubMed] [Google Scholar]
- Atsumi T, Chesney J, Metz C, Leng L, Donnelly S, Makita Z, Mitchell R, Bucala R. High expression of inducible 6-phosphofructo-2-kinase/fructose-2,6-bisphosphatase (iPFK-2; PFKFB3) in human cancers. Cancer Research. 2002;62:5881–5887. [PubMed] [Google Scholar]
- Bah A, Forman-Kay JD. Modulation of Intrinsically Disordered Protein Function by Post-translational Modifications. Journal of Biological Chemistry. 2016;291(13):6696–6705. doi: 10.1074/jbc.R115.695056. [DOI] [PMC free article] [PubMed] [Google Scholar]
- Breslow DK, Cameron DM, Collins SR, Schuldiner M, Stewart-Ornstein J, Newman HW, Braun S, Madhani HD, Krogan NJ, Weissman JS. A comprehensive strategy enabling high-resolution functional analysis of the yeast genome. Nat Methods. 2008;5:711–718. doi: 10.1038/nmeth.1234. [DOI] [PMC free article] [PubMed] [Google Scholar]
- Braun KA, Vaga S, Dombek KM, Fang F, Palmisano S, Aebersold R, Young ET. Phosphoproteomic analysis identifies proteins involved in transcription-coupled mRNA decay as targets of Snf1 signaling. Science Signaling. 2014;7(333):ra64–ra64. doi: 10.1126/scisignal.2005000. [DOI] [PubMed] [Google Scholar]
- Buchan JR, Muhlrad D, Parker R. P bodies promote stress granule assembly in Saccharomyces cerevisiae. The Journal of Cell Biology. 2008;183:441–455. doi: 10.1083/jcb.200807043. [DOI] [PMC free article] [PubMed] [Google Scholar]
- Bustamante E, Morris HP, Pedersen PL. Energy metabolism of tumor cells. Requirement for a form of hexokinase with a propensity for mitochondrial binding. The Journal of Biological Chemistry. 1981;256:8699–8704. [PubMed] [Google Scholar]
- Cairns RA, Harris IS, Mak TW. Regulation of cancer cell metabolism. Nature Reviews Cancer. 2011;11:85–95. doi: 10.1038/nrc2981. [DOI] [PubMed] [Google Scholar]
- Christofk HR, Vander Heiden MG, Harris MH, Ramanathan A, Gerszten RE, Wei R, Fleming MD, Schreiber SL, Cantley LC. The M2 splice isoform of pyruvate kinase is important for cancer metabolism and tumour growth. Nature. 2008;452:230–233. doi: 10.1038/nature06734. [DOI] [PubMed] [Google Scholar]
- Dosztányi Z, Csizmók V, Tompa PT, Simon IN. The Pairwise Energy Content Estimated from Amino Acid Composition Discriminates between Folded and Intrinsically Unstructured Proteins. Journal of Molecular Biology. 2005;347(4):827–839. doi: 10.1016/j.jmb.2005.01.071. [DOI] [PubMed] [Google Scholar]
- Elbaum-Garfinkle S, Kim Y, Szczepaniak K, Chen CCH, Eckmann CR, Myong S, Brangwynne CP. The disordered P granule protein LAF-1 drives phase separation into droplets with tunable viscosity and dynamics. Proceedings of the National Academy of Sciences. 2015;112(23):7189–7194. doi: 10.1073/pnas.1504822112. [DOI] [PMC free article] [PubMed] [Google Scholar]
- Gaisne M, Bécam AM, Verdière J, Herbert CJ. A “natural” mutation in Saccharomyces cerevisiae strains derived from S288c affects the complex regulatory gene HAP1 (CYP1) Current Genetics. 1999;36(4):195–200. doi: 10.1007/s002940050490. [DOI] [PubMed] [Google Scholar]
- Giaever G, Chu AM, Ni L, Connelly C, Riles L, Veronneau S, Dow S, Lucau-Danila A, Anderson K, Andre B, et al. Functional profiling of the Saccharomyces cerevisiae genome. Nature. 2002;418:387–391. doi: 10.1038/nature00935. [DOI] [PubMed] [Google Scholar]
- Feric M, Vaidya N, Harmon TS, Mitrea DM, Zhu L, Richardson TM, et al. Coexisting Liquid Phases Underlie Nucleolar Subcompartments. Cell. 2016;165(7):1686–1697. doi: 10.1016/j.cell.2016.04.047. [DOI] [PMC free article] [PubMed] [Google Scholar]
- Gueldener U, Heinisch J, Koehler GJ, Voss D, Hegemann JH. A second set of loxP marker cassettes for Cre-mediated multiple gene knockouts in budding yeast. Nucleic Acids Research. 2002;30:e23. doi: 10.1093/nar/30.6.e23. [DOI] [PMC free article] [PubMed] [Google Scholar]
- Guo L, Shorter J. It’s Raining Liquids: RNA Tunes Viscoelasticity and Dynamics of Membraneless Organelles. Molecular Cell. 2015;60(2):189–192. doi: 10.1016/j.molcel.2015.10.006. [DOI] [PMC free article] [PubMed] [Google Scholar]
- Hardie DG, Carling D, Carlson M. The AMP-activated/SNF1 protein kinase subfamily: metabolic sensors of the eukaryotic cell? Annu Rev Biochem. 1998;67:821–855. doi: 10.1146/annurev.biochem.67.1.821. [DOI] [PubMed] [Google Scholar]
- Hardie DG, Ross FA, Hawley SA. AMP-activated protein kinase: a target for drugs both ancient and modern. Chem Biol. 2012;19:1222–1236. doi: 10.1016/j.chembiol.2012.08.019. [DOI] [PMC free article] [PubMed] [Google Scholar]
- He L, Diedrich J, Chu YY, Yates JR., III Extracting Accurate Precursor Information for Tandem Mass Spectra by RawConverter. Analytical Chemistry. 2015;87(22):11361–11367. doi: 10.1021/acs.analchem.5b02721. [DOI] [PMC free article] [PubMed] [Google Scholar]
- Hickman MJ, Winston F. Heme Levels Switch the Function of Hap1 of Saccharomyces cerevisiae between Transcriptional Activator and Transcriptional Repressor. Molecular and Cellular Biology. 2007;27(21):7414–7424. doi: 10.1128/MCB.00887-07. [DOI] [PMC free article] [PubMed] [Google Scholar]
- Huh WK, Falvo JV, Gerke LC, Carroll AS, Howson RW, Weissman JS, O’Shea EK. Global analysis of protein localization in budding yeast. Nature. 2003;425(6959):686–691. doi: 10.1038/nature02026. [DOI] [PubMed] [Google Scholar]
- Humston EM, Dombek KM, Hoggard JC, Young ET, Synovec RE. Time-Dependent Profiling of Metabolites from Snf1 Mutant and Wild Type Yeast Cells. Analytical Chemistry. 2008;80(21):8002–8011. doi: 10.1021/ac800998j. [DOI] [PMC free article] [PubMed] [Google Scholar]
- Jain S, Wheeler JR, Walters RW, Agrawal A, Barsic A, Parker R. ATPase-Modulated Stress Granules Contain a Diverse Proteome and Substructure. Cell. 2016;164(3):487–498. doi: 10.1016/j.cell.2015.12.038. [DOI] [PMC free article] [PubMed] [Google Scholar]
- Jang S, Nelson JC, Bend EG, Rodríguez-Laureano L, Tueros FG, Cartagenova L, et al. Glycolytic enzymes localize to synapses under energy stress to support synaptic function. Neuron. 2016;90(2):278–291. doi: 10.1016/j.neuron.2016.03.011. [DOI] [PMC free article] [PubMed] [Google Scholar]
- Kato M, Han TW, Xie S, Shi K, Du X, Wu LC, Mirzaei H, Goldsmith EJ, Longgood J, Pei J. Cell-Free Formation of RNA Granules: Low Complexity Sequence Domains Form Dynamic Fibers within Hydrogels. Cell. 2012;149:753–767. doi: 10.1016/j.cell.2012.04.017. [DOI] [PMC free article] [PubMed] [Google Scholar]
- Kshirsagar M, Parker R. Identification of Edc3p as an enhancer of mRNA decapping in Saccharomyces cerevisiae. Genetics. 2004;166:729–739. doi: 10.1534/genetics.166.2.729. [DOI] [PMC free article] [PubMed] [Google Scholar]
- Longtine MS, McKenzie A, 3rd, Demarini DJ, Shah NG, Wach A, Brachat A, Philippsen P, Pringle JR. Additional modules for versatile and economical PCR-based gene deletion and modification in Saccharomyces cerevisiae. Yeast. 1998;14:953–961. doi: 10.1002/(SICI)1097-0061(199807)14:10<953::AID-YEA293>3.0.CO;2-U. [DOI] [PubMed] [Google Scholar]
- Kurganov BI, Sugrobova NP, Mil’man LS. Supramolecular organization of glycolytic enzymes. Journal of Theoretical Biology. 1985;116(4):509–526. doi: 10.1016/s0022-5193(85)80086-2. [DOI] [PubMed] [Google Scholar]
- Lorenz MA, Burant CF, Kennedy RT. Reducing time and increasing sensitivity in sample preparation for adherent mammalian cell metabolomics. Analytical Chemistry. 2011;83:3406–3414. doi: 10.1021/ac103313x. [DOI] [PMC free article] [PubMed] [Google Scholar]
- Menard L, Maughan D, Vigoreaux J. The Structural and Functional Coordination of Glycolytic Enzymes in Muscle: Evidence of a Metabolon? Biology. 2014;3(3) doi: 10.3390/biology3030623. [DOI] [PMC free article] [PubMed] [Google Scholar]
- Molliex A, Temirov J, Lee J, Coughlin M, Kanagaraj AP, Kim HJ, et al. Phase Separation by Low Complexity Domains Promotes Stress Granule Assembly and Drives Pathological Fibrillization. Cell. 2015;163(1):123–133. doi: 10.1016/j.cell.2015.09.015. [DOI] [PMC free article] [PubMed] [Google Scholar]
- Miura N, Shinohara M, Tatsukami Y, Sato Y, Morisaka H, Kuroda K, Ueda M. Spatial Reorganization of Saccharomyces cerevisiae Enolase To Alter Carbon Metabolism under Hypoxia. Eukaryotic Cell. 2013;12(8):1106–1119. doi: 10.1128/EC.00093-13. [DOI] [PMC free article] [PubMed] [Google Scholar]
- Murakami T, Qamar S, Lin JQ, Schierle GSK, Rees E, Miyashita A, et al. ALS/FTD Mutation-Induced Phase Transition of FUS Liquid Droplets and Reversible Hydrogels into Irreversible Hydrogels Impairs RNP Granule Function. Neuron. 2015;88(4):678–690. doi: 10.1016/j.neuron.2015.10.030. [DOI] [PMC free article] [PubMed] [Google Scholar]
- Narayanaswamy R, Levy M, Tsechansky M, Stovall GM, O’Connell JD, Mirrielees J, Ellington AD, Marcotte EM. Widespread reorganization of metabolic enzymes into reversible assemblies upon nutrient starvation. Proceedings of the National Academy of Sciences. 2009;106:10147–10152. doi: 10.1073/pnas.0812771106. [DOI] [PMC free article] [PubMed] [Google Scholar]
- Nielsen FC, Hansen HT, Christiansen J. RNA assemblages orchestrate complex cellular processes. BioEssays. 2016;38(7):674–681. doi: 10.1002/bies.201500175. [DOI] [PMC free article] [PubMed] [Google Scholar]
- O’Connell JD, Zhao A, Ellington AD, Marcotte EM. Dynamic reorganization of metabolic enzymes into intracellular bodies. Annual Review of Cell and Developmental Biology. 2012;28:89–111. doi: 10.1146/annurev-cellbio-101011-155841. [DOI] [PMC free article] [PubMed] [Google Scholar]
- Peng J, Elias JE, Thoreen CC, Licklider LJ, Gygi SP. Evaluation of Multidimensional Chromatography Coupled with Tandem Mass Spectrometry (LC/LC–MS/MS) for Large-Scale Protein Analysis: The Yeast Proteome. Journal of Proteome Research. 2003;2(1):43–50. doi: 10.1021/pr025556v. [DOI] [PubMed] [Google Scholar]
- Protter DSW, Parker R. Principles and Properties of Stress Granules. Trends in Cell Biology. 2016;26(9):668–679. doi: 10.1016/j.tcb.2016.05.004. [DOI] [PMC free article] [PubMed] [Google Scholar]
- Tabb DL, McDonald WH, Yates JR. DTASelect and Contrast: Tools for Assembling and Comparing Protein Identifications from Shotgun Proteomics. Journal of Proteome Research. 2002;1(1):21–26. doi: 10.1021/pr015504q. [DOI] [PMC free article] [PubMed] [Google Scholar]
- Tran Q, Lee H, Park J, Kim SH, Park J. Targeting Cancer Metabolism - Revisiting the Warburg Effects. Toxicological Research. 2016;32(3):177–193. doi: 10.5487/TR.2016.32.3.177. [DOI] [PMC free article] [PubMed] [Google Scholar]
- Usaite R, Jewett MC, Oliveira AP, Yates JR, Olsson L, Nielsen J. Reconstruction of the yeast Snf1 kinase regulatory network reveals its role as a global energy regulator. Molecular Systems Biology. 2009;5 doi: 10.1038/msb.2009.67. [DOI] [PMC free article] [PubMed] [Google Scholar]
- Vander Heiden MG, Cantley LC, Thompson CB. Understanding the Warburg effect: the metabolic requirements of cell proliferation. Science. 2009;324:1029–1033. doi: 10.1126/science.1160809. [DOI] [PMC free article] [PubMed] [Google Scholar]
- Vizcaíno JA, Csordas A, del-Toro N, Dianes JA, Griss J, Lavidas I, Mayer G, Perez-Riverol Y, Reisinger F, Ternent T, Xu QW, Wang R, Hermjakob H. 2016 update of the PRIDE database and related tools. Nucleic Acids Res. 2016;44(D1):D447–D456. doi: 10.1093/nar/gkv1145. [DOI] [PMC free article] [PubMed] [Google Scholar]
- Wallace EWJ, Kear-Scott JL, Pilipenko EV, Schwartz MH, Laskowski PR, Rojek AE, et al. Reversible, Specific, Active Aggregates of Endogenous Proteins Assemble upon Heat Stress. Cell. 2015;162(6):1286–1298. doi: 10.1016/j.cell.2015.08.041. [DOI] [PMC free article] [PubMed] [Google Scholar]
- Walters RW, Muhlrad D, Garcia J, Parker R. Differential effects of Ydj1 and Sis1 on Hsp70-mediated clearance of stress granules in Saccharomyces cerevisiae. Rna. 2015;21(9):1660–1671. doi: 10.1261/rna.053116.115. [DOI] [PMC free article] [PubMed] [Google Scholar]
- Wolters DA, Washburn MP, Yates JR. An Automated Multidimensional Protein Identification Technology for Shotgun Proteomics. Analytical Chemistry. 2001;73(23):5683–5690. doi: 10.1021/ac010617e. [DOI] [PubMed] [Google Scholar]
- Xu T, Park SK, Venable JD, Wohlschlegel JA, Diedrich JK, Cociorva D, et al. ProLuCID: An improved SEQUEST-like algorithm with enhanced sensitivity and specificity. Journal of Proteomics. 2015;129:16–24. doi: 10.1016/j.jprot.2015.07.001. [DOI] [PMC free article] [PubMed] [Google Scholar]
- Xia J, Mandal R, Sinelnikov IV, Broadhurst D, Wishart DS. MetaboAnalyst 2.0--a comprehensive server for metabolomic data analysis. Nucleic Acids Research. 2012;40:W127–133. doi: 10.1093/nar/gks374. [DOI] [PMC free article] [PubMed] [Google Scholar]
- Yen WL, Shintani T, Nair U, Cao Y, Richardson BC, Li Z, Hughson FM, Baba M, Klionsky DJ. The conserved oligomeric Golgi complex is involved in double-membrane vesicle formation during autophagy. The Journal of Cell Biology. 2010;188:101–114. doi: 10.1083/jcb.200904075. [DOI] [PMC free article] [PubMed] [Google Scholar]
- Xu T, Park SK, Venable JD, Wohlschlegel JA, Diedrich JK, Cociorva D, et al. ProLuCID: An improved SEQUEST-like algorithm with enhanced sensitivity and specificity. Journal of Proteomics. 2015;129:16–24. doi: 10.1016/j.jprot.2015.07.001. [DOI] [PMC free article] [PubMed] [Google Scholar]
Associated Data
This section collects any data citations, data availability statements, or supplementary materials included in this article.
Supplementary Materials
Supplemental Table 2. Mass Spectrometry of G Bodies. Related to Figure 2. Proteins with spectral counts and coverage recovered from mass spectrometry. Tab 1 shows proteins screened for colocalization with Pfk2-azurite. Tab 2 shows full dataset with proteins selected for further screening highlighted.