

Abstract
The expression of the muscle nicotinic acetylcholine receptor (AChR) on the cell surface entails a complex biosynthetic pathway, involving the expression and assembly of four subunits. The amount of AChR on the cell surface changes throughout muscle development and upon muscle denervation. We have examined the regulatory role of transcript levels on surface AChR expression by RNA blot analysis. During myogenesis of the fusing mouse muscle cell line C2, which expresses an embryonic type of receptor, changes in the rate of appearance of cell surface AChR have been assayed by 125I-α-bungarotoxin binding. The maximal increase in the rate of appearance of cell surface AChR occurs upon cell fusion, closely following the maximal increase in transcript levels for the α-, β-, γ-, and δ- AChR subunits. AChR α-, β-, γ-, and δ-subunit gene transcript levels have also been examined in innervated and denervated rat and mouse muscle. Muscle denervation results in an increase of transcripts for all four subunits. However, the amount of β-subunit transcript in innervated rat skeletal muscle is high relative to the other subunit transcripts, and increases less than the other subunit transcripts upon denervation. Our results indicate that, during myogenesis and upon denervation, the availability of AChR subunit transcripts for translation plays a regulatory role in surface AChR appearance.
The muscle nicotinic acetylcholine receptor (AChR)1 is a ligand-gated ion channel which mediates the synaptic interaction between nerve and muscle at the neuromuscular junction. The Torpedo electric organ receptor is comprised of four polypeptide chains, α, β, γ, and δ in the stoichiometry α2βγδ (for review, see Conti-Tronconi and Raftery, 1982; Popot and Changeux, 1984). In skeletal muscle, there is recent evidence that the γ-subunit is replaced by an ε-subunit during development of the neuromuscular junction (Mishina et al., 1986).
The amount of AChR on muscle cell surface changes during myogenesis and upon muscle innervation and denervation (for review, see Fambrough, 1979). During embryogenesis, AChRs appear throughout the muscle cell surface after myoblasts have fused to form myotubes. As development proceeds, the cell surface AChR is found in clusters. In mature, innervated muscle, the AChR is found in very dense clusters localized to the neuromuscular junction. Upon maturation of the junction, the half-life of receptor increases, the channel properties change, and de novo synthesis of receptor decreases, an effect mediated, at least in part, by muscle activity (Lomo and Rosenthal, 1972; Shainberg and Burstein, 1976). Recent evidence suggests that the channel properties of the mature AChR may be conferred by the replacement of the γ-subunit by the ε-subunit (Mishina et al., 1986). Denervation of muscle results in a renewed synthesis of AChRs which again appear throughout the surface of the muscle fiber and have the properties of the embryonic AChR.
The synthesis of the multisubunit receptor is a multistep process. The regulation of this synthesis may be transcriptional, translational, or post-translational (including AChR subunit modification, assembly, transport, and insertion into the membrane). Regulation at each of these steps might occur during the synthesis of any subunit which could affect the appearance of the mature receptors. In this regard, recent data indicate that there are at least five genes, α, β, γ, δ, and ε, which code for AChR subunits in mammals (Mishina et al., 1986).
If the appearance of the multisubunit AChR on the cell surface is regulated by gene transcript levels, the transcripts of any of the four subunits for each AChR type (embryonic or mature) could be limiting. There is a growing body of evidence that receptor appearance may be regulated, at least in part, by the availability for translation of the α-, γ-, and δ-subunit mRNAs (Merlie et al., 1983; LaPolla et al., 1984; Goldman et al., 1985; Knaack et al., 1985; Klarsfeld and Changeux, 1985; Shieh et al., 1985; Yu et al., 1986; Sebbane et al., 1982). Probes for four of the subunit mRNAs from mouse are now available (La Polla et al., 1984; Boulter et al., 1985; Yu et al., 1986; Boulter et al., 1986).2
We have been able to examine the amount of mRNA present for each of the α-, β-, γ-, and δ-subunits during myogenesis and in innervated and denervated muscle. These four subunits comprise an AChR with channel properties of the embryonic receptor (Mishina et al., 1986). We examined the initial appearance of receptor and receptor mRNAs which occurs during myogenesis of a fusing mouse muscle cell line, C2. The C2 cell line was established (Yaffe and Saxel, 1977) and characterized as an in vitro system in which to study mammalian muscle development, including the developmental appearance of the muscle nicotinic AChR (Inestrosa et al., 1982). The properties of the AChR on C2 cells resemble those of embryonic receptor (Miller, 1984).
We studied the effect of innervation on each of the AChR subunit transcript levels in rat and mouse muscle. We tested the idea that muscle innervation inhibits AChR gene expression by comparing the levels of AChR-specific mRNA in innervated and denervated muscles. Our results support the idea that transcript availability for translation regulates the appearance of AChR on the cell surface.
EXPERIMENTAL PROCEDURES
Cell Culture Conditions
Culture conditions which give reproducible behavior and allow for long term maintenance of myotubes were adapted from Yaffe and Saxel (1977).
On day 1, the C2 cells were plated at a density of 104 cells/ml (1.4 × 10³ cells/cm2) in growth medium. The volume of medium added until day 6 was 24 ml/150-mm culture dish or 4 ml/60-mm culture dish. Growth medium was Dulbecco’s modified Eagle’s medium with 0.1% glucose (GIBCO), 20% fetal calf serum (Irvine Scientific), and 0.5% chick embryo extract (GIBCO). Streptomycin sulfate (100 μg/ml) and penicillin (63 μg/ml) were added to all media. Growth medium was changed daily until cells reached confluence at day 4, when no fresh medium was added. The cells were induced to fuse by the addition of fusion medium (Dulbecco’s modified Eagle’s medium with 10% horse serum (Irvine Scientific), supplemented with antibiotics) on day 5. On day 7, the fusion medium was replaced by twice the volume of fresh fusion medium, which was thereafter replaced daily. Myoblasts placed in fusion medium on day 5 have fused by day 6. Spontaneous contractions begin to appear on day 7 and continue through day 20, which is the oldest culture we have maintained. Cells were grown at 37°C with 6–8% CO2.
To correlate the rate of appearance of receptor with receptor subunit mRNA levels, C2 cell cultures were harvested at each day, beginning with day 3 after plating, and their total RNA was extracted. Immediately following the harvesting of the cultures for RNA extraction, parallel cultures were assayed both for the total number of receptors and the rate of appearance of new receptors which could be synthesized from this mRNA population. Previous experiments indicate that the time required for the translation of receptor message and subsequent appearance of assembled receptor at the cell surface is 3 h (Devreotes et al., 1977; Patrick et al., 1977; Merlie et al., 1983).
125I-α-Bungarotoxin Binding to Cell Cultures
125I-Labeled α-bungarotoxin was prepared, as described by Patrick et al. (1972), to a specific activity of 1.1 × 10⁸ cpm/nmol. To assay for receptors, cell cultures were removed from the incubator and washed with Buffer A (10 mM Hepes, pH 7.0, Dulbecco’s modified Eagle’s medium, and 2% fetal calf serum). Buffer A was then added to the cell cultures at 2 ml/60-mm dish. From these cultures, a set of control cultures was incubated with 0.1 μM d-tubocurarine (Sigma) for 10 min at room temperature. The 125I-α-bungarotoxin, at a final concentration of 0.01 μM, was added to all culture dishes and incubated at room temperature, for 30 min. Cells were washed twice with Buffer A and once with phosphate-buffered saline (PBS) (10 mM sodium phosphate, pH 7, 0.15 M sodium chloride) containing 1 mM calcium and 1 mM magnesium. The cell monolayer was then covered with 2 ml of PBS with 2% fetal calf serum/60-mm dish, scraped from the dish, and collected on 2.5-cm cellulose acetate disc filters, 0.45 μm pore size (Millipore), in a Millipore filtration apparatus. Filters were presoaked in PBS with 10% fetal calf serum. Filters were washed three times in 5 ml of PBS, placed in scintillation vials, and counted in a Beckman γ counter. Assays were performed on duplicate dishes for each experiment.
Measurement of the Rate of Appearance of Surface AChR
To determine the rate of appearance of new AChRs, the existing surface receptors were blocked by the addition of 0.05 μM α-bungarotoxin to cells in culture medium followed by incubation at 37°C for 1 h. Cultures were then washed five times with fresh medium. 125I-α-Bungarotoxin binding was performed immediately on one set of dishes to determine the number of unblocked receptors remaining at time 0, and the remaining sets of cultures were incubated at 37°C for 1 and 2 h at which times a set was removed and assayed for new surface 125I-α-bungarotoxin binding sites as described above.
RNA Purification
RNA extraction was performed by the guanidium thiocyanate procedure (Chirgwin, 1979). Five ml of guanidium thiocyanate were added per three 150-mm dishes of C2 cells. The cell or tissue extracts were passed successively through 18- and 24-gauge hypodermic needles to shear the DNA and reduce the viscosity. This guanidium thiocyanate solution was layered over a cushion of cesium chloride and centrifuged. RNA extraction from muscle tissue was performed as described (Goldman et al., 1985). Modifications to the procedure of Chirgwin and subsequent purification of RNA into poly(A)+ and poly(A)− fractions on oligo(dT)-cellulose columns (Aviv and Leder, 1972) were performed as described by Goldman et al. (1985).
Denaturing Agarose Gel Analysis of RNA and RNA Blot Hybridization
The RNA samples were denatured in formaldehyde at 65°C and electrophoresed in 2.2 M formaldehyde, 1.5% agarose gels (Potter et al., 1981). The RNA was then transferred to GeneScreen-Plus (New England Nuclear) according to the suppliers’ instructions. Prehybridization and hybridization were performed at 42°C in 50% formamide, 1 × Denhardt’s solution, 10% dextran sulfate, 5 × SSC (ssc is 0.15 M sodium chloride, 0.015 M sodium citrate, pH 7.0), 50 μg/ml denatured salmon sperm DNA, and 1% sodium dodecyl sulfate as described by the supplier. Hybridization probes were labeled with [32P]dCTP by nick translation (Rigby et al., 1977) to a specific activity of 2 to 8 × 10⁸ cpm/μg.
The plasmid probes used to identify each of the subunits were pMARα15, BMB265, BMG116 (Boulter et al., 1985, 1986),2 and p6H (LaPolla et al., 1984) which contain inserts that code for the α-, β-, γ-, and δ-subunits, respectively. The plasmid probe p91-1 specific for α-actin sequences (Minty et al., 1981) was kindly provided by Margaret Buckingham, Institut Pasteur, Département de Biologie Moléculaire, Paris, France. The hybridized filters were washed under stringent conditions, 0.1 × SSC at 65°C.
Slot Blot Analysis of RNA
Slot blot analysis was performed as described by Goldman et al. (1985).
Quantitation by Densitometric Scanning
The RNA was quantitated by densitometric scanning of autoradiograms with a Quick Scan Band D (Helena Laboratories, Beaumont, TX). The integrals of the areas under the peaks were calculated by a Quick Quant III (Helena Laboratories). In cases where increasing amounts of a particular RNA were added, only those integral values which were consistently proportional to the amount of RNA applied to the slot blot apparatus or gel were used.
Isolation of Cytoplasmic RNA
The preparation of cytoplasmic RNA fractions and extraction of cytoplasmic RNA was as described (Maniatis et al., 1982).
Cross-contamination of cytoplasmic RNA fractions by nuclear RNA was assessed by probing RNA blots of the two RNA fractions with a nick-translated plasmid, pI23, which carries a SalI fragment from the mouse 45 S rRNA precursor. This sequence is located exclusively in the nucleus (Arnheim, 1979).
Muscle Denervation
Experiments were performed on male Sprague-Dawley rats and BALB/c mice. Mice were anesthetized with methoxyflurane (Metofane), and rats were anesthetized with ether. The sciatic nerve was cut at midthigh level of the left hindlimb. The right hindlimb served as an innervated control. Five days after denervation, right and left lower hindlimb plantar extensor muscle was removed. The left hemidiaphragm muscle of rats was denervated by sectioning the left phrenic nerve. The right hemidiaphragm served as an innervated control. Five days after denervation, left and right hemidiaphragms were removed. Tissue was quick-frozen in liquid nitrogen and stored at −70°C.
RESULTS
The fusing mouse muscle cell line C2 was assayed for the rate of appearance of acetylcholine receptor on the cell surface, the total number of receptors present on the cell surface, and the amount of mRNA present for each of the subunits from days 3–9 of development.
Surface AChRs and their rate of appearance were assayed by 125I-α-bungarotoxin binding. The results of this experiment are shown in Fig. 1. Some 125I-α-bungarotoxin binding appears at day 4 and day 5 after plating, but a marked increase in the number of surface toxin-binding sites was seen after the addition of fusion medium between day 5 and day 6. A 3-fold increase in the number of surface receptors occurred from day 4 to day 5, and a 9-fold increase was observed from day 5 to day 6. This increase was paralleled by an increase in the rate of appearance of receptor which was also maximal between day 5 and day 6, then decreased and reached a plateau at day 8, as did the total number of surface receptors. The rate of receptor appearance was negligible on day 4, but increased 12-fold from day 5 to day 6.
Fig. 1. The rate of appearance of 125I-α-bungarotoxin binding sites and the total number of binding sites present during the development of C2 cells.
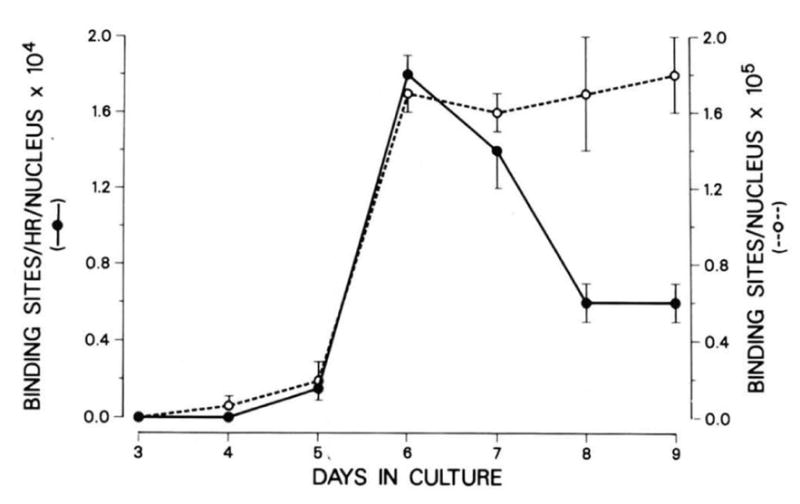
The measurement of the rate of appearance of surface acetylcholine receptors and the procedure for 125I-α-bungarotoxin binding were performed as described under “Experimental Procedures.” Each time point was performed on duplicate dishes and data shown are averages of two separate experiments. The error bars indicate the standard deviation between values from separate experiments. Each AChR molecule has two binding sites for α-bungarotoxin. The maximal number of receptors agrees well with the maximal number of receptors reported earlier for C2 cells (Inestrosa et al., 1983). Cells were harvested on day 5 before the addition of fusion medium on that day. Day 6 cultures had been in fusion medium for 24 h.
The amounts of mRNA present for each of the four subunits (relative to total RNA) during C2 development were examined by RNA blots of total RNA. The RNA blots were also hybridized to a probe specific for muscle actin RNA (Minty et al., 1981). The results of these analyses are shown in Fig. 2. In accordance with earlier observations in mouse leg muscle (Goldman et al., 1985), there appear to be two major RNA species which hybridize to the α-subunit probe and have approximate molecular sizes of 2.0 and 2.1 kb. There are also two major RNA species of 2.0 and 2.1 kb which hybridize to the γ-subunit probe. For the β- and δ-subunits, there appears to be one major RNA species, each of 2.3 and 3.2 kb, respectively. Fainter bands may be a result of cross-hybridization of a particular nick-translated cDNA to RNAs for one of the other highly homologous subunits.
Fig. 2. RNA blot analysis of the accumulation of AChR subunit mRNAs during C2 cell myogenesis.

Total cellular RNA was extracted from C2 cells and purified as described under “Experimental Procedures.” Ten μg of total RNA from each of the developmental days indicated above each lane (3–9, 20) were run on 1.5% formaldehyde agarose gels, blotted, and probed as described under “Experimental Procedures.” Molecular sizes were determined by comparison to molecular size standards of λ-DNA cut with HindIII, and ϕX174 DNA digested with HaeIII.
Examination of total cellular RNA indicated that the greatest increase in the amount of message present for each of the four subunits relative to total cellular RNA was seen between days 5 and 6. The amount of each subunit message relative to total RNA on each day of development was quantitated by densitometric scanning of the autoradiograms in Fig. 2. The amount of message present in total RNA for each of the subunits increased 1.5- to 2-fold from day 4 to day 5, and 3-to 5-fold from day 5 to day 6, or 6- to 8-fold between days 4 and 7. These results indicate that the largest increase in the amount of AChR subunit mRNAs relative to the total cellular RNA occurs at a time when the rate of appearance of receptor on the cell surface is maximal (Fig. 1).
Quantitative Northern blot analysis of the increase in the cytoplasmic poly(A)+ AChR mRNAs relative to total cellular cytoplasmic poly(A)+ RNA was performed. The resulting autoradiograms are shown in Fig. 3. The amount of increase for all AChR subunit mRNAs was 2- to 8-fold from day 5 to day 6, with the greatest increase being for γ-subunit mRNA (Table I). The results for cytoplasmic RNA are consistent with those seen with total RNA.
Fig. 3. Quantitation by RNA blot analysis of cytoplasmic RNA from C2 cells before (day 5) and after (day 6) the addition of fusion medium.

Cytoplasmic poly(A)+ RNA was prepared from C2 cells at day 5 and day 6 as described under “Experimental Procedures.” RNA blot analysis was performed. The resulting autoradiograms are shown. The amounts of cytoplasmic poly(A)+ RNA loaded from each day are indicated above the autoradiograms of each blot. Two- or four-fold more RNA was loaded for day 5 RNAs relative to day 6 RNAs. The probes used are indicated above the autoradiogram of each blot.
Table I.
The increase in cytoplasmic poly(A)+ AChR subunit RNAs relative to total cellular cytoplasmic poly(A)+ RNAs in C2 cells from day 5 to day 6
| Subunit probe | Day 5 | Day 6 | Fold increase |
|---|---|---|---|
| unitsa/μg RNA loaded | |||
| α | 33,000 ± 1,000 | 58,000 ± 8,200 | 1.8 |
| β | 6,200 ± 290 | 18,000 ± 250 | 2.9 |
| γ | 6,400 ± 450 | 51,000 ± 8,600 | 8.0 |
| δ | 2,500 ± 60 | 15,000 ± 170 | 7.1 |
The autoradiogram of the RNA blot shown in Fig. 3 was quantitated by densitometric scanning as described under “Experimental Procedures.”
Values shown are in arbitrary units and are averaged over three samples of RNA. The standard deviation for each value is indicated. The values for each probe increased linearly with the amount of RNA applied. Values have not been normalized to the specific activities of the probes and cannot be compared between subunits.
To address the question of whether muscle innervation suppresses acetylcholine receptor gene expression, the level of poly(A)+ RNA coding for the four AChR subunits was compared in innervated and denervated skeletal muscle. The levels of poly(A)+ RNA coding for the various AChR subunits in innervated and denervated muscle tissue were compared by RNA blot analysis. Denervation of rat diaphragm muscle results in a large increase in the level of poly(A)+ RNA coding for the α-, γ-, and δ-subunits of the AChR (Fig. 4A). Surprisingly, we find less of an increase in the level of the β-subunit encoding transcript upon denervation of rat diaphragm muscle. Furthermore, the level of this transcript is higher in innervated muscle than any of the other subunit encoding transcripts (Fig. 4A).
Fig. 4. Effect of muscle denervation on the levels of mRNA coding for the α-, β-, γ-, and δ-subunits of the acetylcholine receptor.

The denervation data shown are from 5-day denervated muscle tissue. Time course experiments indicated that RNA levels for rat muscle were maximal at 4 days postdenervation and maintained throughout a 12-day period (data not shown). A, RNA blot analysis of innervated or 5-day denervated rat diaphragm RNA. Each lane contains approximately 5 μg of either poly(A)+ or -(A)− RNA. The circular signal appearing in the poly(A)− RNA lane from the denervated tissue probed with the β-subunit probe is an artifact. B, RNA blot analysis of innervated and 5-day denervated mouse hindlimb muscle RNA. Each lane contains approximately 5 μg of poly(A)+ RNA, except those lanes probed with the α-subunit cDNA which contains 4.6 μg of innervated muscle RNA and 3.5 μg of denervated muscle RNA. PROBE refers to one of the four different acetylcholine receptor subunits which were radiolabeled by nick-translation and used to identify their homologous transcript. Specific activities for different probes and the length of time the blot was exposed to x-ray film varied. The blots were exposed for a length of time sufficient to be able to visualize the subunit transcripts from innervated muscle.
Previous experiments revealed that denervation of rat diaphragm muscle resulted in a 7-fold increase in the level of poly(A)+ RNA coding for the α-subunit, while denervation of the mouse plantar extensor muscles resulted in a greater than 50-fold increase in this RNA species (Goldman et al., 1985). We therefore examined the various transcripts encoding AChR subunits in both normal and denervated mouse lower hindlimb plantar extensor muscles (Fig. 4B). Consistent with our original observation for the α-subunit, we find a quantitatively larger effect of denervation on RNA coding for the AChR in mouse skeletal muscle than in rat skeletal muscle. This is most dramatic for the β-subunit encoding transcript which increases significantly upon denervation of mouse skeletal muscle, but increases less when rat skeletal muscle is denervated (Fig. 4, A and B).
To determine whether the differential regulation of the β-subunit encoding transcript observed in mouse and rat represents a species difference or a muscle difference (diaphragm versus plantar extensor), the influence of denervation in the rat and mouse plantar extensor group of muscle was compared (Fig. 5). It is clear that in the rat the β-subunit-encoding transcript is weakly influenced by denervation, whereas the same muscle, when denervated in the mouse, results in a large increase in this RNA species. This result indicates a species difference in the regulation of the gene encoding the β-subunit of the AChR.
Fig. 5. The effect of denervating the plantar extensor group of muscles of rat or mouse on the level of mRNA coding for the β-subunit of the AChR.
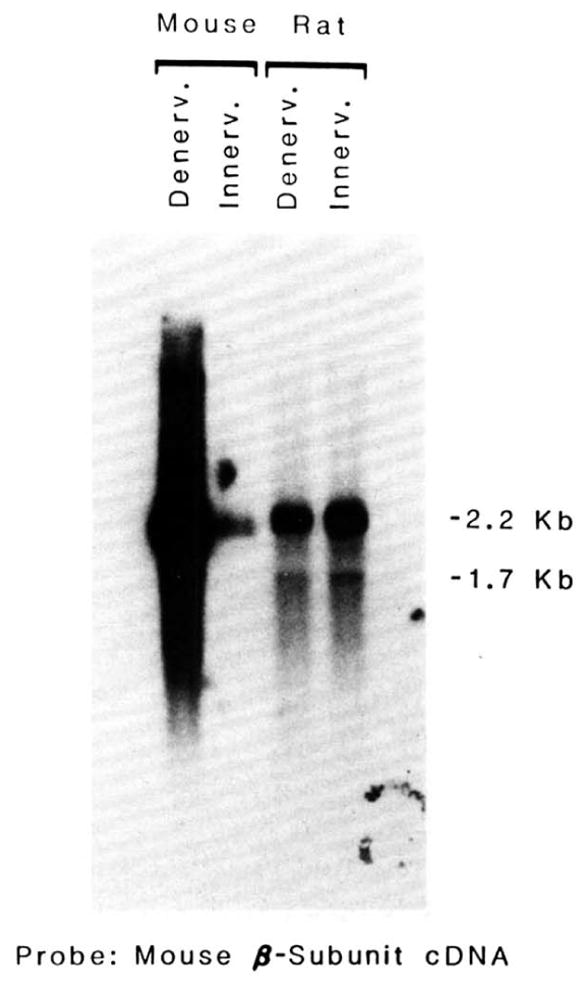
5 μg of poly(A)+ RNA isolated from innervated and 5-day denervated plantar extensor muscles of the rat or mouse were applied to the gel. RNA blots were probed with nick-translated 32P-labeled cDNA corresponding to the β-subunit of the AChR. Blots were exposed long enough to enable visualization of innervated muscle transcripts. Specific activities for different probes and the length of time the blot was exposed to x-ray film varied.
DISCUSSION
Our results indicate that transcript availability plays a regulatory role in receptor biosynthesis during the initial stages of muscle development. The greatest increase in mRNAs for each of the subunits coincides with the greatest increase in the rate of AChR appearance on the cell surface (Figs. 1 and 2). Both of these events coincide with fusion of myoblasts to form myotubes.
The increase seen in cytoplasmic AChR subunit RNAs between day 5 and day 6 of C2 development is comparable to the increase seen in AChR subunit RNAs relative to total cellular RNA. This increase could be due to changes in the rate of initiation of gene transcription, gene transcription rate, post-transcriptional processing, nuclear message stability, transcript compartmentalization either in the nucleus or in the cytoplasm, and cytoplasmic message stability. Recently, other investigators have reported that an 8-fold increase in transcription rate of the α- and δ-subunit genes occurs during differentiation of C2 cells (Buonanno and Merlie, 1986).
Regulation may also be occurring at other levels in the biosynthetic pathway. Despite similar levels of AChR subunit mRNAs in total RNA in C2 cells on days 6, 7, and 8 (Fig. 2), the rate of appearance of receptor slows on days 7 and 8 (Fig. 1). Receptor half-lives range from 8 to 16 h in C2 cells, increasing with the age of the culture (Miller, 1984). Therefore, it is unlikely that an increased turnover of receptor contributes to the apparent decrease in the rate of receptor appearance. These observations suggest that, in addition to transcriptional regulation, post-transcriptional events regulate the appearance of receptor on the cell surface.
Our studies of AChR subunit mRNA expression also included examination of α-actin (muscle-specific) expression for purposes of comparison. Muscle-specific actin gene expression increases with myoblast fusion (Minty et al., 1981). The α-actin mRNA profiles were the same as those of the receptor subunits suggesting that the regulation of these genes at the early stages of myogenesis may have a common element. There would appear to be a low basal level of gene transcription for these muscle-specific genes occurring in myoblasts which is enhanced significantly immediately following the fusion of myoblasts into myotubes. Alternately, the low level of transcripts present before fusion could result from a few differentiated cells being present in the myoblast population.
Our results comparing AChR subunit transcript levels in innervated and denervated muscle tissues show that transcript levels for the α-, β-, γ-, and δ-subunits increase upon denervation and could account for the increased synthesis of embryonic AChR which occurs upon denervation (for review, see Fambrough, 1979). The finding that muscle denervation increases the level of RNA coding for the AChR is consistent with the idea that electrical activity influences AChR gene expression. However, when we compared muscle denervation in mouse and rat, we found some significant differences. Overall, denervation of rat skeletal muscle has less of an effect on AChR encoding RNAs than it does in the mouse (Fig. 4, A and B). An extreme example is the β-subunit-encoding transcript, which, in mouse, increases dramatically upon muscle denervation, but, in rat, is only slightly affected by denervation (Fig. 5). In rat, not only is the β-subunit-encoding transcript level relatively insensitive to muscle denervation, but its level is higher in innervated muscle tissue than the other three subunit transcripts (Fig. 4). This may indicate that the regulatory region of the β-subunit gene has suffered a mutation that has resulted in it not being repressed upon muscle innervation. Therefore, at least in the rat, the level of RNA coding for the AChR β-subunit does not appear to correlate with the amount of receptor protein found on the cell surface.
Acknowledgments
We would like to thank Margaret Buckingham for sending us the muscle actin specific plasmid, p91-1, and Norman Arnheim and Douglas Treco for providing us with the rRNA precursor plasmid, pI23. Thank you to Jim Boulter, Karen Evans, Gary Martin, and Pam Mason for providing the four AChR subunit plasmids. We would like to thank Jim Boulter for many helpful discussions.
Footnotes
The abbreviations used are: AChR, acetylcholine receptor; Hepes, 4-(2-hydroxyethyl)-1-piperazineethanesulfonic acid; PBS, phosphate-buffered saline; kb, kilobase pairs.
J. Boulter, K. Evans, G. Martin, P. Mason, S. Stengelin, D. Goldman, S. Heinemann, and J. Patrick, unpublished data.
References
- Arnheim N. Gene ( Amst ) 1979;7:83–96. doi: 10.1016/0378-1119(79)90025-8. [DOI] [PubMed] [Google Scholar]
- Aviv H, Leder P. Proc Natl Acad Sci U S A. 1972;69:1408–1412. doi: 10.1073/pnas.69.6.1408. [DOI] [PMC free article] [PubMed] [Google Scholar]
- Boulter J, Luyten W, Evans K, Mason P, Ballivet M, Goldman D, Stengelin S, Martin G, Heinemann S, Patrick J. J Neurosci. 1985;5:2545–2552. doi: 10.1523/JNEUROSCI.05-09-02545.1985. [DOI] [PMC free article] [PubMed] [Google Scholar]
- Boulter J, Evans K, Martin G, Mason P, Stengelin S, Goldman D, Heinemann S, Patrick J. J Neurosci Res. 1986;16:37–49. doi: 10.1002/jnr.490160106. [DOI] [PubMed] [Google Scholar]
- Buonanno A, Merlie JP. J Biol Chem. 1986;261:11452–11455. [PubMed] [Google Scholar]
- Conti-Tronconi BM, Raftery MA. Annu Rev Biochem. 1982;51:491–530. doi: 10.1146/annurev.bi.51.070182.002423. [DOI] [PubMed] [Google Scholar]
- Chirgwin JW, Przybyla AE, MacDonald RJ, Rutter WJ. Biochemistry. 1979;18:5294–5299. doi: 10.1021/bi00591a005. [DOI] [PubMed] [Google Scholar]
- Devreotes PN, Gardner JM, Fambrough DM. Cell. 1977;10:365–373. doi: 10.1016/0092-8674(77)90023-x. [DOI] [PubMed] [Google Scholar]
- Fambrough DM. Physiol Rev. 1979;59:165–227. doi: 10.1152/physrev.1979.59.1.165. [DOI] [PubMed] [Google Scholar]
- Goldman D, Boulter J, Heinemann S, Patrick J. J Neurosci. 1985;5:2553–2558. doi: 10.1523/JNEUROSCI.05-09-02553.1985. [DOI] [PMC free article] [PubMed] [Google Scholar]
- Inestrosa NC, Silberstein L, Hall ZW. Cell. 1982;29:71–79. doi: 10.1016/0092-8674(82)90091-5. [DOI] [PubMed] [Google Scholar]
- Inestrosa NC, Miller JF, Silberstein L, Ziskind-Conhaim L, Hall ZW. Exp Cell Res. 1983;147:393–405. doi: 10.1016/0014-4827(83)90221-5. [DOI] [PubMed] [Google Scholar]
- Klarsfeld A, Changeux JP. Proc Natl Acad Sci U S A. 1985;82:4558–4562. doi: 10.1073/pnas.82.13.4558. [DOI] [PMC free article] [PubMed] [Google Scholar]
- Knaack D, Admon S, Podleski T, Oswald R, Salpeter MM. Neurosci Abstr. 1985;11:771. [Google Scholar]
- LaPolla RJ, Mayne KM, Davidson N. Proc Natl Acad Sci U S A. 1984;81:7970–7974. doi: 10.1073/pnas.81.24.7970. [DOI] [PMC free article] [PubMed] [Google Scholar]
- Lomo T, Rosenthal J. J Physiol (Lond) 1972;221:493–513. doi: 10.1113/jphysiol.1972.sp009764. [DOI] [PMC free article] [PubMed] [Google Scholar]
- Maniatis T, Fritsch EF, Sambrook J. Molecular Cloning: A Laboratory Manual. Cold Spring Harbor Laboratory; Cold Spring Harbor, NY: 1982. p. 191. [Google Scholar]
- Merlie JP, Sebbane R, Gardner S, Olson E, Lindstrom J. Cold Spring Harbor Symp Qunt Biol. 1983;48:135–145. doi: 10.1101/sqb.1983.048.01.016. [DOI] [PubMed] [Google Scholar]
- Miller JB. Exp Cell Res. 1984;154:256–269. doi: 10.1016/0014-4827(84)90685-2. [DOI] [PubMed] [Google Scholar]
- Minty AJ, Caravatti M, Robert B, Cohen A, Daubas P, Weydert A, Gros F, Buckingham ME. J Biol Chem. 1981;256:1008–1014. [PubMed] [Google Scholar]
- Mishina M, Takai T, Imoto K, Noda M, Takahashi T, Numa S, Methfessel C, Sakmann B. Nature. 1986;321:406–411. doi: 10.1038/321406a0. [DOI] [PubMed] [Google Scholar]
- Patrick J, Heinemann SF, Lindstrom J, Schubert D, Steinbach JH. Proc Nutl Acad Sci U S A. 1972;69:2762–2766. doi: 10.1073/pnas.69.10.2762. [DOI] [PMC free article] [PubMed] [Google Scholar]
- Patrick J, McMillan J, Wolfson H, O’Brien JC. J Biol Chem. 1977;252:2143–2153. [PubMed] [Google Scholar]
- Popot JL, Changeux JP. Physiol Rev. 1984;64:1162–1239. doi: 10.1152/physrev.1984.64.4.1162. [DOI] [PubMed] [Google Scholar]
- Potter E, Nicolaisen AK, Org ES, Evans RM, Rosenfeld MG. Proc Natl Acad Sci U S A. 1981;78:6662–6666. doi: 10.1073/pnas.78.11.6662. [DOI] [PMC free article] [PubMed] [Google Scholar]
- Rigby PWJ, Dieckmann M, Rhodes C, Berg P. J Mol Biol. 1977;113:237–251. doi: 10.1016/0022-2836(77)90052-3. [DOI] [PubMed] [Google Scholar]
- Sebbane R, Clokey G, Merlie JP, Tzartos S, Lindstrom J. J Biol Chem. 1983;258:3294–3303. [PubMed] [Google Scholar]
- Shainberg A, Burstein M. Nature. 1976;264:368–369. doi: 10.1038/264368a0. [DOI] [PubMed] [Google Scholar]
- Shieh BH, Ballivet M, Schmidt J. Neurosci Abstr. 1985;11:811. [Google Scholar]
- Yaffe D, Saxel O. Nature. 1977;270:725–727. doi: 10.1038/270725a0. [DOI] [PubMed] [Google Scholar]
- Yu L, LaPolla RJ, Davidson N. Nucleic Acids Res. 1986;14:3539–3555. doi: 10.1093/nar/14.8.3539. [DOI] [PMC free article] [PubMed] [Google Scholar]