

Abstract
Background and objectives
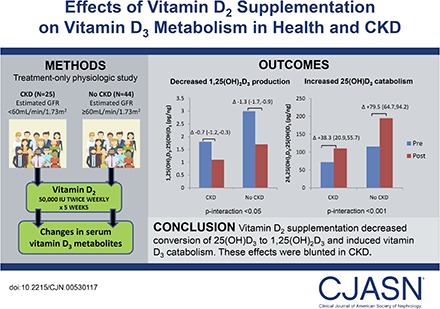
Vitamin D supplements are prescribed to correct low circulating concentrations of 25-hydroxyvitamin D. In CKD, vitamin D metabolism is complicated by decreased conversion of 25-hydroxyvitamin D to 1,25-dihydroxyvitamin D by CYP27B1 and possibly decreased conversion of 25-hydroxyvitamin D to 24,25-dihydroxyvitamin D by CYP24A1. The aim of this study was to determine the effects of vitamin D2 supplementation on vitamin D metabolism in health and CKD.
Design, setting, participants, & measurements
We conducted a treatment-only intervention study of 25 individuals with CKD (eGFR<60 ml/min per 1.73 m2) and 44 individuals without CKD from three academic centers, all with screening 25-hydroxyvitamin D <30 ng/ml. Each participant was prescribed vitamin D2 (ergocalciferol) 50,000 IU orally twice weekly for 5 weeks. We tested whether changes in plasma concentrations of vitamin D metabolites and vitamin D metabolic ratios differed by CKD status. Plasma 1,25-dihydroxyvitamin D3-to-25-hydroxyvitamin D3 ratio and 24,25-dihydroxyvitamin D3-to-25-hydroxyvitamin D3 ratio were calculated as estimates of CYP27B1 and CYP24A1 function, respectively.
Results
With treatment, plasma 25-hydroxyvitamin D2 and total 25-hydroxyvitamin D concentrations increased similarly for participants with and without CKD. For participants without CKD, 1,25-dihydroxyvitamin D2 increased (2.8±1.3–32.9±1.4 pg/ml), whereas 1,25-dihydroxyvitamin D3 decreased (45.6±1.9–14.6±1.9 pg/ml), resulting in no significant change in total 1,25-dihydroxyvitamin D; 1,25-dihydroxyvitamin D3-to-25-hydroxyvitamin D3 ratio decreased (3.0±0.2–1.7±0.2 pg/ng), and 24,25-dihydroxyvitamin D3-to-25-hydroxyvitamin D3 ratio increased (115.7±7.8–195.2±7.9 pg/ng). Individuals with CKD had lower baseline levels and smaller changes in magnitude for 1,25-dihydroxyvitamin D2 (2.1±1.6–24.4±1.6 pg/ml; P interaction =0.01), 1,25-dihydroxyvitamin D3-to-25-hydroxyvitamin D3 ratio (1.8±0.2–1.1±0.2 pg/ng; P interaction =0.05), and 24,25-dihydroxyvitamin D3-to-25-hydroxyvitamin D3 ratio (72.0±9.1–110.3±9.3 pg/ng; P interaction <0.001). Fibroblast growth factor-23 and parathyroid hormone were not significantly changed in either group.
Conclusions
Vitamin D2 supplementation decreases conversion of 25-hydroxyvitamin D3 to 1,25-dihydroxyvitamin D3 and induces vitamin D3 catabolism as evidenced by changes in D3 metabolites and vitamin D metabolic ratios. These effects occur without significant changes in fibroblast growth factor-23 or parathyroid hormone and are blunted in CKD.
Podcast
This article contains a podcast at https://www.asn-online.org/media/podcast/CJASN/2017_08_02_CJASNPodcast_17_09.mp3
Keywords: Vitamin D, metabolism, chronic kidney disease
Introduction
Vitamin D supplements are used widely in people with and without CKD, because low circulating concentrations of 25-hydroxyvitamin D [25(OH)D] are common and deficiency in 25(OH)D may contribute to adverse health outcomes (1,2). In 2003, the National Kidney Foundation-Kidney Disease Outcomes Quality Initiative guidelines recommended vitamin D supplementation for patients with stages 3 and 4 CKD and 25(OH)D<30 ng/ml, specifically using high-dose treatment with vitamin D2 (ergocalciferol) (3). In 2009, Kidney Disease Improving Global Outcomes guidelines recommended using vitamin D in patients with stage 3 to predialysis stage 5 CKD with low circulating concentrations of 25(OH)D and elevated concentrations of parathyroid hormone (PTH) (4). Despite widespread use, the effects of vitamin D supplements on downstream vitamin D metabolism are unclear.
In health, vitamin D3 is hydroxylated to 25-hydroxyvitamin D3 [25(OH)D3] by the hepatic cytochrome P450 enzyme CYP2R1; 25(OH)D3 may then be converted by CYP27B1 to the active hormone 1,25-dihydroxyvitamin D3 [1,25(OH)2D3; calcitriol]; by CYP24A1 to 24,25-dihydroxyvitamin D3 [24,25(OH)2D3], which undergoes further metabolism and elimination; or to other metabolites that are less well described (5,6). Vitamin D2 undergoes parallel metabolism through the same pathways. PTH induces CYP27B1 transcription and downregulates CYP24A1 (6,7). Fibroblast growth factor-23 (FGF-23) decreases CYP27B1 while inducing CYP24A1 (8–10). In addition, 1,25(OH)2D [i.e., 1,25(OH)2D3 and 1,25(OH)2D2] regulates its own metabolism by inhibiting CYP27B1 and stimulating CYP24A1. Although these metabolic pathways are well defined, the fate of vitamin D supplements and their effects on this system are not well described.
CKD is known to strongly affect vitamin D metabolism (5). Specifically, CYP27B1-mediated production of 1,25(OH)2D is markedly reduced (11–13), CYP24A1-mediated vitamin D clearance may also be reduced, and circulating concentrations of PTH and FGF-23 rise markedly, exerting opposing effects on CYP27B1 and CYP24A1 activity (5). The goal of this study was to analyze the physiologic effect of vitamin D supplementation on vitamin D metabolism in persons with and without CKD.
Materials and Methods
Study Participants
Between 2007 and 2009, participants with and without CKD were recruited from the Massachusetts General Hospital (MGH) outpatient nephrology clinics, the MGH campus-wide email solicitation, the University of Miami Hospital, the St. Louis University Hospital, and the affiliated John Cochran Veteran Affairs Medical Center. All potential candidates indicating interest in the study were invited to attend a screening visit, at which eligibility for inclusion was assessed and informed consent was obtained. Inclusion criteria included screening 25(OH)D<30 ng/ml at the local clinical laboratory and age >18 years old. Exclusion criteria are listed in Supplemental Material.
Of 192 participants screened, 69 participants consented, qualified, completed treatment with D2 supplementation, attended end of study visits, and were included in the final analysis. Baseline plasma samples were used to measure creatinine and cystatin C traceable to isotope dilution mass spectrometry and ERM-DA471 (from the International Federation of Clinical Chemistry). Interassay coefficients were 1.5%–3.0%. The combined creatinine-cystatin C Chronic Kidney Disease Epidemiology Collaboration equation was used to calculate baseline eGFR. Persons with baseline eGFR <60 ml/min per 1.73m2 were classified as having CKD. In the primary analysis, 15 participants with screening eGFR <60 ml/min per 1.73 m2 (using the Modification of Diet in Renal Disease formula) but baseline eGFR≥60 ml/min per 1.73m2 were analyzed as the group without CKD, and one participant with borderline screening eGFR ≥60 ml/min per 1.73 m2 and eGFR<60 ml/min per 1.73m2 was analyzed as having CKD. These discordant participants were excluded in a sensitivity analysis.
Intervention
All participants were prescribed a fixed dose of oral vitamin D2 (ergocalciferol) filled at local clinical pharmacies at 50,000 IU twice weekly for 5 weeks. This treatment period was used to evaluate the short-term effects of vitamin D2 supplementation. Subjects were asked to take no other vitamin D–containing supplements or products, including multivitamins, during the study period.
Vitamin D Metabolites
Vitamin D metabolites were measured from plasma samples collected before the first dose of vitamin D2 (baseline) and 3–5 days after completion of the last dose of vitamin D2. For two participants with unavailable plasma, serum was used instead. Samples were stored at −80°C and thawed before analysis in 2015 at the University of Washington Nutrition Obesity Research Center. Immunoaffinity enrichment-liquid chromatography-tandem mass spectrometry on a Xevo TQ-MS triple quadrupole mass spectrometer (Waters, Milford, CT) was used to measure 25(OH)D2; 25(OH)D3 [summed to calculate total 25(OH)D]; 1,25(OH)2D2; 1,25(OH)2D3 [summed to calculate total 1,25(OH)2D]; and 24,25(OH)2D3 (14). Interassay coefficients of variation (CVs) were 8.9%–9.9% for 1,25(OH)D2; 8.0%–10.4% for 1,25(OH)D3; 6.0%–6.7% for 25(OH)D2; 3.5%–4.4% for 25(OH)D3; and 5.2%–7.4% for 24,25(OH)2D3. Calibration of serum 25(OH)D concentrations was verified using SRM 972 from the National Institutes of Standards and Technology. Vitamin D metabolic ratios were calculated as functional estimates of CYP24A1 and CYP27B1 activity: 1,25(OH)2D3-to-25(OH)D3 ratio estimated CYP27B1-mediated production of 1,25(OH)2D3, and 24,25(OH)2D3-to-25(OH)D3 ratio estimated CY24A1-mediated clearance of 1,25(OH)2D3. Estimation of bioavailable 25(OH)D is described in Supplemental Material.
Other Mineral Metabolism Biomarkers
Intact PTH was measured using an automated two-site immunoassay (Beckman-Coulter, Inc., Brea, CA; interassay CV=6.1%–3.4%). FGF-23 was measured using the Kainos immunoassay, which detects the full-length biologically intact FGF-23 molecule via distal and midmolecule epitopes (interassay CV=6.7%–12.4%). Vitamin D binding protein was quantified by proteolysis and liquid chromatography-tandem mass spectrometry on a Xevo TQ MS triple quadrupole mass spectrometer (Waters) (15).
Statistical Analyses
Descriptive statistics were used to compare baseline participant characteristics according to CKD status.
Spaghetti plots were constructed to reflect trajectories of mineral metabolism biomarkers over time and according to study group. We used generalized estimating equations, accounting for within-participant clustering across study time, to determine whether change in circulating mineral metabolism markers differed with respect to CKD status. A Wald test of the multiplicative CKD by time interaction term was used to evaluate the statistical significance of the difference in change in biomarker by CKD status.
We selected covariates a priori on the basis of biologic plausibility that they could confound or mediate associations of kidney function with change in biomarkers. The first model included age, sex, race, recruitment site, and body mass index. A subsequent model was constructed to evaluate potential mediation effects of PTH and FGF-23 on the estimates. Missing values for covariates were multiply imputed (n=10) with chained equations, and the resulting analyses were combined using the rules of Rubin (16,17).
Institutional Review Board Approval
This study was approved by the institutional review boards of the MGH, the University of Miami, and St. Louis University in 2007. The study was initiated before the adoption of the expanded definition of clinical trial by the International Committee of Medical Journal Editors in 2008 and considered at the time to be a detailed physiologic study rather than a clinical trial. For this reason, it was not prospectively entered into a clinical trials registry.
Results
Characteristics of the Participants
Of 69 participants included in analyses, 25 had CKD mean (SD) eGFR of 40 (13) ml/min per 1.73 m2 (Table 1). Participants with and without CKD had mean ages of 62 and 52 years old, respectively; 24% and 50% were women, respectively, and 48% and 41% were nonwhite, respectively. Mean (SD) baseline total 25(OH)D concentrations were 18.9 (1.8) and 20.4 (1.6) ng/ml for participants with and without CKD, respectively. Participants with CKD had more diabetes mellitus, hypertension, and prevalent cardiovascular disease and higher body mass index at baseline compared with participants without CKD.
Table 1.
Baseline characteristics of study participants
| Characteristic | eGFR | |
|---|---|---|
| <60 ml/min per 1.73 m2, n=25 | ≥60 ml/min per 1.73 m2, n=44 | |
| Age, yrs | 62±13 | 52±14 |
| Sex | ||
| Men | 19 (76) | 22 (50) |
| Women | 6 (24) | 22 (50) |
| Race/ethnicity | ||
| White | 13 (52) | 26 (59) |
| Black | 9 (36) | 9 (21) |
| Hispanic | 3 (12) | 7 (16) |
| Asian | 0 | 2 (5) |
| Study site | ||
| Massachusetts General Hospital | 15 (60) | 31 (70.5) |
| University of Miami | 3 (12) | 11 (25) |
| St. Louis University Hospital | 7 (28) | 2 (5) |
| Prevalent cardiovascular disease, % | 25 | 12 |
| Hypertension, % | 83 | 44 |
| Diabetes mellitus, % | 42 | 19 |
| Multivitamin use, % | 33 | 11 |
| Calcium supplement use, % | 0 | 7 |
| BMI, kg/m2 | 33.1±6.9 | 31.7±5.3 |
| Creatinine, mg/dl | 1.96±0.88 | 0.91±0.28 |
| Cystatin C, mg/L | 0.78±0.24 | 1.77±0.58 |
| eGFR, ml/min per 1.73 m2 | 40±13 | 118±45 |
| eGFR category, ml/min per 1.73 m2 | ||
| ≥60 | 0 | 44 (100) |
| 45–59 | 9 (36) | 0 |
| 30–44 | 11 (44) | 0 |
| 15–29 | 4 (16) | 0 |
| <15 | 1 (4) | 0 |
Cell contents are presented as n (%) or mean (±SDs). Prevalent cardiovascular disease refers to a history of coronary artery disease and/or myocardial infarction and/or coronary artery bypass grafting and/or congestive heart failure. Data were unavailable for 31 participants regarding diabetes status, 29 participants for multivitamin and calcium supplement use, and 32 participants regarding hypertension and prevalent cardiovascular disease status. Data were missing for BMI for 45 participants. BMI, body mass index.
Vitamin D Metabolites and Vitamin D Metabolic Ratios
Among participants without CKD, there were significant increases in plasma 25(OH)D2 and total 25(OH)D with treatment (Figure 1, Table 2). Plasma 1,25(OH)2D2 also increased, whereas 1,25(OH)2D3 decreased, resulting in no significant change in total 1,25(OH)2D. The 1,25(OH)2D3-to-25(OH)D3 ratio decreased (3.0–1.70 pg/ng), whereas the 24,25(OH)2D3-to-25(OH)D3 ratio increased (115.7–195.2 pg/ng) (Figure 2, Table 2).
Figure 1.

Changes in 25-hydroxyvitamin D and 1,25-dihydroxyvitamin D metabolites with vitamin D2 supplementation. Spaghetti plots show individual changes in metabolite concentrations from baseline to end of treatment (blue lines). The means are represented by the bold red lines. Mean changes with treatment and 95% confidence intervals are represented within each graph. (A) 25-Hydroxyvitamin D2 [25(OH)D2]. (B) 1,25-Dihydroxyvitamin D2 [1,25(OH)2D2]. (C) 25-Hydroxyvitamin D3 [25(OH)D3]. (D) 1,25-Dihydroxyvitamin D3 [1,25(OH)2D3]. (E) 25-Hydroxyvitamin D2 and 25-hydroxyvitamin D3 [total 25(OH)D]. (F) 1,25-Dihydroxyvitamin D2 and 1,25-dihydroxyvitamin D3 [total 1,25(OH)2D].
Table 2.
Mineral metabolism biomarkers by CKD status before and after treatment
| Biomarker | CKD (eGFR<60 ml/min per 1.73 m2) | Non-CKD (eGFR≥60 ml/min per 1.73 m2) | Difference in Change by CKD Status | |||||||
|---|---|---|---|---|---|---|---|---|---|---|
| Baseline | Post-Treatment | Change (95% CI) | P Value | Baseline | Post-Treatment | Change (95% CI) | P Value | Difference in Change (95% CI) | P Value Interaction | |
| 25(OH)D total, ng/ml | 18.9 (1.8) | 41.1 (1.9) | 22.3 (18.3 to 26.2) | <0.001 | 20.4 (1.6) | 39.3 (1.6) | 18.9 (15.6 to 22.3) | <0.001 | 3.4 (−1.8 to 8.5) | 0.21 |
| 25(OH)D3, ng/ml | 16.9 (1.1) | 9.6 (1.2) | −7.3 (−9.0 to −5.7) | <0.001 | 18.1 (1.0) | 9.2 (1.0) | −8.9 (−10.3 to −7.5) | <0.001 | 1.6 (−0.6 to 3.7) | 0.15 |
| 25(OH)D2, ng/ml | 2.0 (1.5) | 31.7 (1.6) | 29.7 (25.7 to 33.6) | <0.001 | 2.3 (1.3) | 30.1 (1.3) | 27.8 (24.4 to 31.2) | <0.001 | 1.9 (−3.3 to 7.1) | 0.48 |
| 1,25(OH)2D total, pg/ml | 30.8 (2.5) | 34.2 (2.6) | 3.4 (−1.3 to 8.1) | 0.15 | 48.4 (2.2) | 47.5 (2.2) | −0.9 (−4.8 to 3.1) | 0.67 | 4.3 (−1.8 to 10.4) | 0.17 |
| 1,25(OH)2D3, pg/ml | 28.7 (2.2) | 9.9 (2.3) | −18.8 (−23.8 to −13.7) | <0.001 | 45.6 (1.9) | 14.6 (1.9) | −31.0 (−35.3 to −26.7) | <0.001 | 12.2 (5.6 to 18.9) | <0.001 |
| 1,25(OH)2D2, pg/ml | 2.1 (1.6) | 24.4 (1.6) | 22.3 (18.2 to 26.4) | <0.001 | 2.8 (1.3) | 32.9 (1.4) | 30.1 (26.6 to 33.6) | <0.001 | −7.8 (−13.2 to −2.4) | 0.01 |
| 24,25(OH)2D3, ng/ml | 1.3 (0.2) | 1.0 (0.2) | −0.2 (−0.5 to −0.0) | 0.05 | 2.2 (0.2) | 1.7 (0.2) | −0.5 (−0.7 to −0.3) | <0.001 | 0.3 (−0.1 to 0.6) | 0.10 |
| PTH, pg/ml | 103.1 (9.2) | 94.6 (9.3) | −8.6 (−20.3 to 3.1) | 0.15 | 60.4 (8.0) | 50.6 (8.0) | −9.8 (−19.7 to 0.1) | 0.05 | 1.2 (−14.1 to 16.5) | 0.88 |
| FGF-23, pg/ml | 81.6 (6.1) | 83.6 (6.2) | 2.0 (−5.7 to 9.8) | 0.61 | 47.0 (5.3) | 50.5 (5.3) | 3.4 (−3.1 to 10.0) | 0.30 | −1.4 (−11.6,8.7) | 0.78 |
| Calcium, mg/dl | 8.9 (0.2) | 8.9 (0.2) | 0.0 (−0.3 to 0.4) | 0.86 | 8.7 (0.2) | 8.7 (0.2) | −0.0 (−0.4 to 0.3) | 0.83 | 0.1 (−0.4 to 0.6) | 0.78 |
| Phosphorus, mg/dl | 3.4 (0.2) | 3.6 (0.2) | 0.2 (−0.3 to 0.6) | 0.45 | 3.2 (0.2) | 3.5 (0.2) | 0.3 (−0.1 to 0.7) | 0.11 | −0.1 (−0.7 to 0.4) | 0.62 |
| 24,25(OH)2D3 to 25(OH)D3, pg/ng | 72.0 (9.1) | 110.3 (9.3) | 38.3 (20.9 to 55.7) | <0.001 | 115.7 (7.8) | 195.2 (7.9) | 79.5 (64.7 to 94.2) | <0.001 | −41.2 (−64.0 to −18.3) | <0.001 |
| 1,25(OH)2D3 to 25(OH)D3, pg/ng | 1.8 (0.2) | 1.1 (0.2) | −0.7 (−1.2 to −0.3) | 0.001 | 3.0 (0.2) | 1.7 (0.2) | −1.3 (−1.7 to −0.9) | <0.001 | 0.6 (0.0 to 1.2) | 0.05 |
| Vitamin D binding protein, μg/ml | 264.0 (7.0) | 253.8 (7.2) | −10.1 (−22.1 to 1.8) | 0.10 | 255.4 (6.1) | 260.8 (6.1) | 5.5 (−4.6 to 15.6) | <0.001 | −15.6 (−31.2 to 0.0) | 0.05 |
| Estimated bioavailable 25(OH)D | 2.2 (0.3) | 5.2 (0.3) | 2.9 (2.3 to 3.6) | <0.001 | 2.3 (0.3) | 4.4 (0.3) | 2.1 (1.5 to 2.7) | <0.001 | 0.8 (−0.0 to 1.7) | 0.06 |
Cell contents are mean (SD), mean change (95% CI), difference in mean changes (95% CI), P value within group, or P value for interaction comparing change among participants with CKD with change among participants without CKD. 95% CI, 95% confidence interval; 25(OH)D, 25-hydroxyvitamin D; 25(OH)D3, 25-hydroxyvitamin D3; 25(OH)D2, 25-hydroxyvitamin D2; 1,25(OH)2D, 1,25-dihydroxyvitamin D; 1,25(OH)2D2, 1,25-dihydroxyvitamin D2; 1,25(OH)2D3, 1,25-dihydroxyvitamin D3; 24,25(OH)2D3, 24,25-dihydroxyvitamin D3; PTH, parathyroid hormone; FGF-23, fibroblast growth factor-23.
Figure 2.

Changes in the 1,25-dihydroxyvitamin D3 [1,25(OH)2D3]-to-25-hydroxyvitamin D3 [25(OH)D3] and 24,25-dihydroxyvitamin D3 [24,25(OH)2D3]-to-25-hydroxyvitamin D3 [25(OH)D3] ratios, parathyroid hormone (PTH), and fibroblast growth factor-23 (FGF-23) with vitamin D2 supplementation. Spaghetti plots show individual changes in vitamin D metabolic ratio concentrations from baseline to end of treatment (blue lines). The means are represented by the bold red lines. Mean changes with treatment and 95% confidence intervals are represented within each graph. (A) The 1,25(OH)2D3-to-25(OH)D3 ratio. (B) PTH. (C) The 24,25(OH)2D3-to-25(OH)D3 ratio. (D) FGF-23.
In the CKD group, baseline concentrations and changes in 25(OH)D2 and total 25(OH)D (18.9–41.1 ng/ml) were similar to those in the control group (treatment group interaction, P>0.05). However, comparing the CKD group with the control group, baseline levels were lower and changes were smaller in magnitude for 1,25(OH)2D2, 1,25(OH)2D3-to-25(OH)D3 ratio, and 24,25(OH)2D3-to-25(OH)D3 ratio when evaluated on the absolute scale (each interaction P<0.05). Comparing participants with and without CKD, differences in changes in 1,25(OH)2D2, 1,25(OH)2D3-to-25(OH)D3 ratio, and 24,25(OH)2D3-to-25(OH)D3 ratio remained significant after adjusting for demographic variables (Table 3). In a sensitivity analysis excluding 15 participants who were recruited as subjects with CKD but later found to have study eGFR ≥60 ml/min per 1.73 m2 and one participant with borderline screening eGFR ≥60 ml/min per 1.73 m2 and baseline eGFR <60 ml/min per 1.73 m2, differences comparing participants with CKD with the control group were of larger magnitude (Supplemental Tables 1 and 2). When changes in mineral metabolism markers were evaluated on the relative scale (as percentage change), there were no significant differences comparing participants with and without CKD (Supplemental Table 3).
Table 3.
Associations of CKD status with change in vitamin D metabolic ratios
| Covariate Adjustments | Difference in Change in the 24,25(OH)2D3-to-25(OH)D3 Ratio, pg/ng | Difference in Change in the 1,25(OH)2D3-to-25(OH)D3 Ratio, pg/ng | ||
|---|---|---|---|---|
| Difference (95% Confidence Interval) | P Value | Difference (95% Confidence Interval) | P Value | |
| None (unadjusted) | −41.29 (−64.09 to −18.39) | <0.001 | 0.59 (0.01 to 1.18) | 0.05 |
| Age/sex/race, site, BMI | −30.40 (−53.9 to −6.88) | 0.01 | 0.7 (−0.10 to 1.30) | 0.02 |
| Age/sex/race, site, BMI + FGF-23 + PTH | −22.40 (−49.0 to 4.30) | 0.10 | 0.8 (0.13 to 1.47) | 0.02 |
Cell contents represent the difference in change in vitamin D metabolic ratios comparing participants with CKD with those in non-CKD group [(change in vitamin D metabolic ratio from baseline to post-treatment in CKD group) − (change in vitamin D metabolic ratio from baseline to post-treatment in the non-CKD group)], with 95% confidence intervals and P values. Model 1: age, sex, race, site of enrollment, and BMI were assessed as potential confounding factors in the differences in change noted in the vitamin D metabolic ratios between the participants with CKD and the participants without CKD. Model 2 was adjusted for all covariates in model 1 in addition to baseline PTH and FGF-23 to assess if PTH and/or FGF-23 were potential mediators in the differences observed in the vitamin D metabolic ratios by CKD status. 24,25(OH)2D3-to-25(OH)D3 ratio, the ratio of 24,25-dihydroxyvitamin D3 to 25-hydroxyvitamin D3; 1,25(OH)2D3-to-25(OH)D3 ratio, the ratio of 1,25-dihydroxyvitamin D3 to 25-hydroxyvitamin D3; BMI, body mass index; FGF-23, fibroblast growth factor-23; PTH, parathyroid hormone.
Plasma PTH, FGF-23, and Vitamin D Binding Protein
As expected at baseline, the CKD group was observed to have a higher mean PTH concentration of 103.1 pg/ml compared with the control group: 60.4 pg/ml (Table 2). With treatment, small decreases in mean PTH concentration that did not meet statistical significance were noted in each treatment group, with no difference in change by group (P interaction =0.88).
Mean FGF-23 was also higher in the CKD group before treatment: 81.6 (6.1) compared with 47.0 (5.3) pg/ml. There was no significant change in FGF-23 concentration in either treatment group. At baseline, FGF-23 was inversely correlated with 1,25(OH)2D, and PTH was inversely correlated with 24,25(OH)2D3. However, baseline PTH and baseline FGF-23 were not associated with change in any of the metabolites (Supplemental Figures 1–4). Adjustment for PTH and FGF-23 attenuated the association of CKD with 24,25(OH)2D3-to-25(OH)D3 ratio (Table 3). Mean vitamin D binding protein concentration did not differ by CKD status, and there were no changes in vitamin D binding protein with treatment. Changes in bioavailable 25(OH)D paralleled changes in total 25(OH)D.
Discussion
In this detailed physiologic study, intensive vitamin D2 supplementation effectively raised plasma concentrations of 25(OH)D2 and total 25(OH)D among participants with and without CKD. Vitamin D2 supplementation also raised plasma 1,25(OH)2D2 concentrations, with a reciprocal fall in 1,25(OH)2D3 concentration, resulting in no significant change in total 1,25(OH)2D. There was a decrease in the 1,25(OH)2D3-to-25(OH)D3 ratio, suggesting downregulation of CYP27B1, and an increase in the 24,25(OH)2D3-to-25(OH)D3 ratio, suggested upregulation of CYP24A1. Comparing participants with CKD with those in the non-CKD group, baseline levels were lower and changes were smaller in magnitude for 1,25(OH)2D2, 1,25(OH)2D3-to-25(OH)D3 ratio, and 24,25(OH)2D3-to-25(OH)D3 ratio when evaluated on the absolute scale but not when evaluated on the relative scale. No significant change in FGF-23, PTH, or vitamin D binding protein was observed with vitamin D2 supplementation.
Numerous other studies, together spanning a large range of kidney function from normal to CKD to ESRD, have shown that vitamin D2 or D3 supplementation increases circulating 25(OH)D concentration (18–20). The conversion of vitamin D2 or D3 to 25(OH)D2 or 25(OH)D3 is catalyzed by the hepatic enzyme CYP2R1, which is not expected to be altered in CKD. However, it has been hypothesized that increased CYP24A1 activity induced by FGF-23 may contribute to 25(OH)D deficiency and blunt the 25(OH)D response to supplements in CKD. A prior study found that catabolism of 25(OH)D may contribute to low circulating vitamin D levels in CKD, because elevations of FGF-23 in CKD were associated with increased 24,25(OH)2D3 after cholecalciferol administration (21). Our findings suggest that stages 3 and 4 CKD do not significantly modify the effect of vitamin D supplementation on circulating 25(OH)D concentration.
Our results are consistent with recent studies reporting little or no effect of vitamin D supplementation on circulating total 1,25(OH)2D concentrations (22,23). We found that increased plasma 1,25(OH)2D2 (from the vitamin D2 supplement) was completely compensated by a reciprocal decrease in 1,25(OH)2D3 (derived from other sources), resulting in no significant change in total 1,25(OH)2D concentration. Two prior studies assessed the effects of supplementation on circulating vitamin D metabolites measured by mass spectrometry among people with normal kidney function and found similar results (22,23). Older studies reporting increased 1,25(OH)2D concentrations with vitamin D supplementation used less specific assays for dihydroxyvitamin D metabolites and may have detected increased concentrations of 25(OH)D or 24,25(OH)2D rather than 1,25(OH)2D. Our data support the prevailing theory that total circulating 1,25(OH)2D concentration is tightly regulated, even during vitamin D supplementation, and suggest that this regulation is maintained in moderate-severe CKD, albeit at a lower 1,25(OH)2D concentration.
Examination of vitamin D metabolic ratios and circulating hormones provided new insight into underlying mechanisms regulating circulating 1,25(OH)2D concentration. With supplementation, the 1,25(OH)2D3-to-25(OH)D3 metabolic ratio decreased, and the 24,25(OH)2D3-to-25(OH)D3 ratio increased. These changes in vitamin D metabolic ratios could be influenced by reduced availability of substrate [25(OH)D3] or competition by supplemented vitamin D2. However, similar changes in vitamin D metabolic ratios were reported in a prior study of vitamin D3 supplementation, in which 25(OH)D3 concentrations increased substantially with treatment and 25(OH)D2 concentrations were presumably very low (24). Together, these studies suggest that circulating 1,25(OH)2D concentration is maintained during vitamin D supplementation through downregulation of CYP27B1 and upregulation of CYP24A1.
Circulating 1,25(OH)2D and 24,25(OH)2D are largely produced in the kidneys, and therefore, these data suggest a shift in renal vitamin D metabolism during supplementation. Interestingly, these changes cannot be explained by changes in circulating PTH or FGF-23, hormones that are known to regulate renal CYP27B1 and CYP24A1, because changes in PTH and FGF-23 were small or null during this study. This observation suggests that the kidney may contribute to vitamin D homeostasis through mechanisms that are both dependent on and independent of systemic hormones. For example, vitamin D metabolites within kidney tubular cells, particularly 1,25(OH)2D, may directly regulate CYP27B1 and CYP24A1 (5,25).
It has long been known that 1,25(OH)2D production is decreased in CKD (11–13). Our findings that baseline 1,25(OH)2D concentrations and the 1,25(OH)2D3-to-25(OH)D3 metabolic ratio are lower in participants with versus without CKD are consistent with this. With supplementation, CKD was associated with blunted absolute changes but similar relative (percentage) changes in 1,25(OH)2D and the 1,25(OH)2D3-to-25(OH)D3 metabolic ratio. This suggests that the same defects contributing to impaired 1,25(OH)2D production in the unsupplemented state extend to vitamin D supplementation. Plasma FGF-23 concentration inversely correlated with plasma 1,25(OH)2D concentration at baseline, and adjusting for PTH and FGF-23 concentrations attenuated associations of CKD with change in the 24,25(OH)2D3-to-25(OH)D3 metabolic ratio, suggesting that PTH and FGF-23 may mediate, in part, effects of CKD on vitamin D metabolism. However, it is hard to distinguish PTH and FGF-23 concentrations from CKD itself given large differences by CKD status, and estimates of association of CKD change in vitamin D metabolic ratios were not reduced to zero with adjustment for PTH and FGF-23.
Moreover, our data examining plasma 24,25(OH)2D3 and the 24,25(OH)2D3-to-25(OH)D3 metabolic ratio support the concept that vitamin D catabolism is also reduced in CKD, consistent with a “stagnant” state of vitamin D metabolism (5). Lower eGFR has been associated with lower plasma 24,25(OH)2D3 concentrations in published studies (26–28). Our findings of lower baseline 24,25(OH)2D3 concentration and lower 24,25(OH)2D3-to-25(OH)D3 metabolic ratio among participants with versus without CKD are consistent with these reports. Furthermore, among participants with CKD, 24,25(OH)2D3-to-25(OH)D3 ratio increased substantially with supplementation to levels near those of the non-CKD group without supplementation. This is important, because low 24,25(OH)2D3 concentration has been associated with mortality and proposed as a biomarker of insufficient 1,25(OH)2D3 activity in CKD (5,26,29). Our data show that the 24,25(OH)2D3-to-25(OH)D3 metabolic ratio is modifiable with a simple intervention.
As for 1,25(OH)2D and the 1,25(OH)2D3-to-25(OH)D3 ratio, absolute changes in the 24,25(OH)2D3-to-25(OH)D3 metabolic ratio with vitamin D2 supplementation were blunted among participants with versus without CKD, but relative (percentage) changes were similar. These results are consistent with those of a published study, in which vitamin D3 supplementation increased plasma 24,25(OH)2D3 concentration and the 24,25(OH)2D3-to-25(OH)D3 ratio, with significantly smaller changes among participants with versus without CKD (24). In comparison, our study used a vitamin D2 intervention to more clearly discriminate vitamin D metabolites arising from study medication versus usual sources and evaluate changes in the 24,25(OH)2D3-to-25(OH)D3 ratio without substantial increases in 25(OH)D3. Together, the two studies offer a compelling argument that CYP24A1-mediated clearance of vitamin D supplements is reduced in CKD, perhaps due to decreased 25(OH)D delivery to kidney tubules, impaired 25(OH)D uptake by megalin and cubulin, or reduced CYP24A1 enzyme abundance or activity.
Recently, there has been increasing interest in bioavailable 25(OH)D [i.e., the sum of free 25(OH)D and 25(OH)D loosely bound to albumin, excluding 25(OH)D tightly bound to vitamin D binding protein] (30,31). In this context, it is important to note that we observed no effect of vitamin D2 supplementation on the plasma concentration of vitamin D binding protein measured using a precise assay unbiased with regard to vitamin D binding protein isoform (15,32). Therefore, effects of vitamin D2 supplementation on bioavailable 25(OH)D and 1,25(OH)2D paralleled effects on total 25(OH)D and 1,25(OH)2D.
Strengths of this study include the ability to compare changes in vitamin D metabolites and mineral metabolism biomarkers with treatment in persons with CKD with those in healthy individuals. In addition, the use of vitamin D2 allowed rough differentiation of vitamin D metabolites arising from the study drug versus other sources and the evaluation of vitamin D metabolic ratios. The use of specific and sensitive mass spectrometry allowed for accurate and reliable measurements of the major vitamin D metabolites, eliminating the problem of variability or crossreactivity with immunoassay measurements (32). Our study population was derived from four nephrology clinic sites from three different parts of the country, increasing the generalizability of our findings to the prevalent CKD population compared with single-center studies.
Limitations of this study include the relatively small sample size, which prohibits us from excluding small differences in biomarkers for which null or insignificant results were observed, such as in FGF-23 and PTH; they have been shown to decrease with vitamin D interventions in prior studies (33). This study cannot determine the responsible site(s) of vitamin D metabolism. Circulating levels of vitamin D metabolites were measured and analyzed but may not reflect those in tissues. Although participants received the same dose of vitamin D2, a specific formulation was not used. Participants with and without CKD were not matched, although differences in vitamin D metabolic ratios by CKD status persisted with adjustment, and the large observed differences are difficult to explain by other potential confounders. Misclassification of CKD status for participants with screening and baseline eGFRs near 60 ml/min per 1.73 m2 may have biased associations of CKD with changes in vitamin D metabolites toward the null. The short duration of treatment time may have obscured the full long-term effects of vitamin D2 supplementation. Reliability of vitamin D metabolite assays may have been overestimated using internal reference standards.
We conclude that vitamin D2 supplementation decreases conversion of 25(OH)D3 to 1,25(OH)2D3 and induces vitamin D3 catabolism as evidenced by changes in plasma vitamin D3 metabolites and vitamin D metabolic ratios. These effects do not seem to be fully attributable to changes in circulating PTH or FGF-23 levels. In CKD, production of 1,25(OH)2D3 and 24,25(OH)2D3 is reduced in the unsupplemented stated and with vitamin D2 supplementation. Nonetheless, vitamin D2 supplementation does increase the 24,25(OH)2D3-to-25(OH)D3 metabolic ratio to levels comparable with those observed among unsupplemented participants without CKD, showing that the 24,25(OH)2D3-to-25(OH)D3 ratio is a modifiable biomarker of impaired vitamin D metabolism in CKD.
Disclosures
T.I. is a consultant for Kyowa Hakko Kirin. K.J.M. is a consultant for Amgen, Diasorin, and OPKO. M.S.W. is a consultant or has received honoraria from Amag, Amgen, Ardelyx, Diasorin, Incyte, Keryx, Lilly, Pfizer, Sanofi, Ultragenyx, and ZS and has received grant support from Shire. Z.B., C.R.-C., A.N.H., B.K., and I.H.d.B. have nothing to disclose.
Supplementary Material
Acknowledgments
This study was supported by grant R01DK099199 from the National Institute of Diabetes and Digestive Kidney Diseases (NIDDK); grants T32HL007028 and R01HL096875 from the National Heart, Lung, and Blood Institute; grant 1 UL1 RR025758-04 (Harvard Clinical and Translational Science Center) from the National Center for Research Resources, and grant M01-RR-01066 from the National Center for Research Resources. M.S.W. is supported by grants R01DK076116, R01DK081374, R01DK094796, K24DK093723, and U01DK099930 from the NIDDK and a Strategically Focused Research Network Center Grant on Health Disparities from the American Heart Association.
Because I.H.d.B. is a Deputy Editor of the Clinical Journal of the American Society of Nephrology, he was not involved in the peer review process for this manuscript. Another editor oversaw the peer review and decision-making process for this manuscript.
Rajnish Mehrotra, the Editor-in-Chief is at the same institution as some of the authors, including the Deputy Editor, and was therefore also not involved in the peer-review process for this manuscript.
Footnotes
Published online ahead of print. Publication date available at www.cjasn.org.
This article contains supplemental material online at http://cjasn.asnjournals.org/lookup/suppl/doi:10.2215/CJN.00530117/-/DCSupplemental.
References
- 1.Navaneethan SD, Schold JD, Arrigain S, Jolly SE, Jain A, Schreiber MJ Jr, Simon JF, Srinivas TR, Nally JV Jr: Low 25-hydroxyvitamin D levels and mortality in non-dialysis-dependent CKD. Am J Kidney Dis 58: 536–543, 2011 [DOI] [PMC free article] [PubMed] [Google Scholar]
- 2.Mehrotra R, Kermah DA, Salusky IB, Wolf MS, Thadhani RI, Chiu Y-W, Martins D, Adler SG, Norris KC: Chronic kidney disease, hypovitaminosis D, and mortality in the United States. Kidney Int 76: 977–983, 2009 [DOI] [PMC free article] [PubMed] [Google Scholar]
- 3.National Kidney Foundation : K/DOQI clinical practice guidelines for bone metabolism and disease in chronic kidney disease. Am J Kidney Dis 42[Suppl 3]: S1–S201, 2003 [PubMed] [Google Scholar]
- 4.Kidney Disease: Improving Global Outcomes (KDIGO) CKD-MBD Work Group : KDIGO clinical practice guideline for the diagnosis, evaluation, prevention, and treatment of Chronic Kidney Disease-Mineral and Bone Disorder (CKD-MBD). Kidney Int Suppl 113: S1–S130, 2009 [DOI] [PubMed] [Google Scholar]
- 5.Bosworth C, de Boer IH: Impaired vitamin D metabolism in CKD. Semin Nephrol 33: 158–168, 2013 [DOI] [PMC free article] [PubMed] [Google Scholar]
- 6.Jones G, Prosser DE, Kaufmann M: 25-Hydroxyvitamin D-24-hydroxylase (CYP24A1): Its important role in the degradation of vitamin D. Arch Biochem Biophys 523: 9–18, 2012 [DOI] [PubMed] [Google Scholar]
- 7.Zierold C, Mings JA, DeLuca HF: Regulation of 25-hydroxyvitamin D3-24-hydroxylase mRNA by 1,25-dihydroxyvitamin D3 and parathyroid hormone. J Cell Biochem 88: 234–237, 2003 [DOI] [PubMed] [Google Scholar]
- 8.Perwad F, Portale AA: Vitamin D metabolism in the kidney: Regulation by phosphorus and fibroblast growth factor 23. Mol Cell Endocrinol 347: 17–24, 2011 [DOI] [PubMed] [Google Scholar]
- 9.Shimada T, Hasegawa H, Yamazaki Y, Muto T, Hino R, Takeuchi Y, Fujita T, Nakahara K, Fukumoto S, Yamashita T: FGF-23 is a potent regulator of vitamin D metabolism and phosphate homeostasis. J Bone Miner Res 19: 429–435, 2004 [DOI] [PubMed] [Google Scholar]
- 10.Wu S, Grieff M, Brown AJ: Regulation of renal vitamin D-24-hydroxylase by phosphate: Effects of hypophysectomy, growth hormone and insulin-like growth factor I. Biochem Biophys Res Commun 233: 813–817, 1997 [DOI] [PubMed] [Google Scholar]
- 11.Dusso A, Lopez-Hilker S, Lewis-Finch J, Grooms P, Brown A, Martin K, Slatopolsky E: Metabolic clearance rate and production rate of calcitriol in uremia. Kidney Int 35: 860–864, 1989 [DOI] [PubMed] [Google Scholar]
- 12.Gray R, Boyle I, DeLuca HF: Vitamin D metabolism: The role of kidney tissue. Science 172: 1232–1234, 1971 [DOI] [PubMed] [Google Scholar]
- 13.Fraser DR, Kodicek E: Unique biosynthesis by kidney of a biological active vitamin D metabolite. Nature 228: 764–766, 1970 [DOI] [PubMed] [Google Scholar]
- 14.Laha TJ, Strathmann FG, Wang Z, de Boer IH, Thummel KE, Hoofnagle AN: Characterizing antibody cross-reactivity for immunoaffinity purification of analytes prior to multiplexed liquid chromatography-tandem mass spectrometry. Clin Chem 58: 1711–1716, 2012 [DOI] [PMC free article] [PubMed] [Google Scholar]
- 15.Henderson CM, Lutsey PL, Misialek JR, Laha TJ, Selvin E, Eckfeldt JH, Hoofnagle AN: Measurement by a novel LC-MS/MS methodology reveals similar serum concentrations of vitamin D-binding protein in blacks and whites. Clin Chem 62: 179–187, 2016 [DOI] [PMC free article] [PubMed] [Google Scholar]
- 16.Rubin DB: Multiple Imputation for Nonresponse in Surveys, New York, Wiley, 1987 [Google Scholar]
- 17.Royston P: Multiple imputation of missing values. Stata J 4: 227–241, 2004 [Google Scholar]
- 18.Eastwood JB, Stamp TC, De Wardener HE, Bordier PJ, Arnaud CD: The effect of 25-hydroxy vitamin D3 in the osteomalacia of chronic renal failure. Clin Sci Mol Med 52: 499–508, 1977 [DOI] [PubMed] [Google Scholar]
- 19.Eastwood JB, Stamp TCB, Harris E, de Wardener HE: Vitamin-D deficiency in the osteomalacia of chronic renal failure. Lancet 2: 1209–1211, 1976 [DOI] [PubMed] [Google Scholar]
- 20.DeVille J, Thorp ML, Tobin L, Gray E, Johnson ES, Smith DH: Effect of ergocalciferol supplementation on serum parathyroid hormone and serum 25-hydroxyvitamin D in chronic kidney disease. Nephrology (Carlton) 11: 555–559, 2006 [DOI] [PubMed] [Google Scholar]
- 21.Alshayeb H, Showkat A, Wall BM, Gyamlani GG, David V, Quarles LD: Activation of FGF-23 mediated vitamin D degradative pathways by cholecalciferol. J Clin Endocrinol Metab 99: E1830–E1837, 2014 [DOI] [PMC free article] [PubMed] [Google Scholar]
- 22.Biancuzzo RM, Clarke N, Reitz RE, Travison TG, Holick MF: Serum concentrations of 1,25-dihydroxyvitamin D2 and 1,25-dihydroxyvitamin D3 in response to vitamin D2 and vitamin D3 supplementation. J Clin Endocrinol Metab 98: 973–979, 2013 [DOI] [PMC free article] [PubMed] [Google Scholar]
- 23.Swanson CM, Nielson CM, Shrestha S, Lee CG, Barrett-Connor E, Jans I, Cauley JA, Boonen S, Bouillon R, Vanderschueren D, Orwoll ES; Osteoporotic Fractures in Men (MrOS) Study Research Group : Higher 25(OH)D2 is associated with lower 25(OH)D3 and 1,25(OH)2D3. J Clin Endocrinol Metab 99: 2736–2744, 2014 [DOI] [PMC free article] [PubMed] [Google Scholar]
- 24.Stubbs JR, Zhang S, Friedman PA, Nolin TD: Decreased conversion of 25-hydroxyvitamin D3 to 24,25-dihydroxyvitamin D3 following cholecalciferol therapy in patients with CKD. Clin J Am Soc Nephrol 9: 1965–1973, 2014 [DOI] [PMC free article] [PubMed] [Google Scholar]
- 25.Akeno N, Saikatsu S, Kawane T, Horiuchi N: Mouse vitamin D-24-hydroxylase: Molecular cloning, tissue distribution, and transcriptional regulation by 1alpha,25-dihydroxyvitamin D3. Endocrinology 138: 2233–2240, 1997 [DOI] [PubMed] [Google Scholar]
- 26.Bosworth CR, Levin G, Robinson-Cohen C, Hoofnagle AN, Ruzinski J, Young B, Schwartz SM, Himmelfarb J, Kestenbaum B, de Boer IH: The serum 24,25-dihydroxyvitamin D concentration, a marker of vitamin D catabolism, is reduced in chronic kidney disease. Kidney Int 82: 693–700, 2012 [DOI] [PMC free article] [PubMed] [Google Scholar]
- 27.de Boer IH, Sachs MC, Chonchol M, Himmelfarb J, Hoofnagle AN, Ix JH, Kremsdorf RA, Lin YS, Mehrotra R, Robinson-Cohen C, Siscovick DS, Steffes MW, Thummel KE, Tracy RP, Wang Z, Kestenbaum B: Estimated GFR and circulating 24,25-dihydroxyvitamin D3 concentration: A participant-level analysis of 5 cohort studies and clinical trials. Am J Kidney Dis 64: 187–197, 2014 [DOI] [PMC free article] [PubMed] [Google Scholar]
- 28.Dai B, David V, Alshayeb HM, Showkat A, Gyamlani G, Horst RL, Wall BM, Quarles LD: Assessment of 24,25(OH)2D levels does not support FGF23-mediated catabolism of vitamin D metabolites. Kidney Int 82: 1061–1070, 2012 [DOI] [PMC free article] [PubMed] [Google Scholar]
- 29.Berg AH, Powe CE, Evans MK, Wenger J, Ortiz G, Zonderman AB, Suntharalingam P, Lucchesi K, Powe NR, Karumanchi SA, Thadhani RI: 24,25-Dihydroxyvitamin d3 and vitamin D status of community-dwelling black and white Americans. Clin Chem 61: 877–884, 2015 [DOI] [PMC free article] [PubMed] [Google Scholar]
- 30.Powe CE, Evans MK, Wenger J, Zonderman AB, Berg AH, Nalls M, Tamez H, Zhang D, Bhan I, Karumanchi SA, Powe NR, Thadhani R: Vitamin D-binding protein and vitamin D status of black Americans and white Americans. N Engl J Med 369: 1991–2000, 2013 [DOI] [PMC free article] [PubMed] [Google Scholar]
- 31.Powe CE, Ricciardi C, Berg AH, Erdenesanaa D, Collerone G, Ankers E, Wenger J, Karumanchi SA, Thadhani R, Bhan I: Vitamin D-binding protein modifies the vitamin D-bone mineral density relationship. J Bone Miner Res 26: 1609–1616, 2011 [DOI] [PMC free article] [PubMed] [Google Scholar]
- 32.Strathmann FG, Laha TJ, Hoofnagle AN: Quantification of 1α,25-dihydroxy vitamin D by immunoextraction and liquid chromatography-tandem mass spectrometry. Clin Chem 57: 1279–1285, 2011 [DOI] [PMC free article] [PubMed] [Google Scholar]
- 33.Kandula P, Dobre M, Schold JD, Schreiber MJ Jr, Mehrotra R, Navaneethan SD: Vitamin D supplementation in chronic kidney disease: A systematic review and meta-analysis of observational studies and randomized controlled trials. Clin J Am Soc Nephrol 6: 50–62, 2011 [DOI] [PMC free article] [PubMed] [Google Scholar]
Associated Data
This section collects any data citations, data availability statements, or supplementary materials included in this article.