Abstract
Objective
The aim of our study was to determine whether or not dynamic magnetic resonance imaging (MRI) with kinetic and morphological parameters can reveal significant differences between malignant and benign pulmonary lesions, and thus to evaluate the use of dynamic MRI in the management of pulmonary nodules.
Patients and Methods
Thirty-one patients (4 women and 27 men) underwent 1.5 T MRI, where 10 consecutive dynamic series were performed every 30 s by using 3D fast low-angle shot sequences. The percentage increase in the signal intensity of the lesions was determined for each time point. Time-enhancement curves of the lesions were drawn and classified into four types: A, B, C and D. Early peak (EP) and maximum peak (MP) values of the curves were calculated and compared with the diagnoses of the patients. The usefulness of these parameters was tested statistically. In addition to the comparison of the parameters between the groups, receiver-operating characteristic analysis was used to assess sensitivity, specificity, and both positive and negative predictive values of EP and MP parameters.
Results
Of the 31 pulmonary lesions, 16 (52%) were malignant. These showed a stronger enhancement with higher median values of EP and MP (77.08 and 123.15, respectively) than those corresponding to the benign lesions (14.45 and 32.53, respectively). There were significant differences between the benign and malignant lesions (p < 0.001). Sensitivity, specificity, positive predictive value and negative predictive value were 75, 93, 92 and 78% for EP and 93, 86, 88 and 93% for MP, respectively.
Conclusion
A combination of kinetic and morphological evaluation in dynamic MRI provided accurate differentiation between benign and malignant pulmonary lesions. It was a useful and noninvasive method of evaluating pulmonary nodules.
Key Words: Pulmonary nodules, Dynamic MRI, Kinetic parameters
Introduction
Indeterminate lesions are still one of the most challenging problems in current clinical practice. In such cases, computerized tomography (CT) serves as the standard of reference and its use is recommended for the evaluation of these nodules in the current guidelines [1,2,3,4,5,6,7,8]. Although magnetic resonance imaging (MRI) is not used as a first choice in the evaluation of indeterminate nodules, the advantages of using dynamic MRI for tumor catheterization have been demonstrated in several studies [9,10], and due to technical improvements MRI has gained importance for tumor detection and interpretation [11,12,13].
In this study, we aimed to determine whether MRI with kinetic and morphological parameters revealed significant differences between malignant and benign pulmonary lesions, and thus to evaluate the use of dynamic MRI in the management of indeterminate pulmonary lesions.
Subjects and Methods
Case Selection
This prospective study included 31 patients, 27 men and 4 women, from January 2009 to January 2010. They all signed informed consent forms. All the patients were diagnosed by direct chest X-ray and underwent a CT scan. The morphological characteristics of the lesions were evaluated. Dynamic MRI was performed on selected patients who required further evaluation. The 2 patients who could not tolerate MRI were excluded from the study.
Imaging Technique
MRI was performed with a 1.5-tesla scanner using body coil (Magnetom Symphony; Siemens, Germany). The localizations of the lesions were detected by localizer images which were achieved in three planes. The images obtained in the sagittal and transverse planes at the greatest diameter were evaluated by dynamic MRI. Breath-hold fat-suppressed T1-weighted FLASH 3D (TR/TE: 6/2.51; FA: 10, voxel size: 2.3 × 1.4 × 5 mm) was sequenced. Following the first images without contrast delivery, the contrast medium (i.v. 0.1 mmol/kg gadolinium-DPTA) was administered through an automatic injector with an 18- to 20-gauge cannula positioned in an antecubital vein at a flow rate of 3 ml/s; about 15 ml saline was injected following the gadolinium. Dynamic images were obtained at 30, 60, 90, 120, 150, 180, 210, 240 and 600 s with an 8- to 12-second breath-holding episode per series.
Evaluation of the Images: Morphological Evaluation
The lesion size, contour, presence of cavity formation, intensity of adipose tissue and signal characteristics were also assessed using a T1-weighted gradient echo and a T2-weighted turbo spin echo. The signal characteristics (isointense, hypointense, hyperintense and heterogeneous) were established comparing thoracic wall images to muscle images. CT scans and direct X-ray images were compared to evaluate the size of the nodules.
Kinetic Evaluation
Signal intensity (SI) measurement was performed to evaluate the dynamic images by positioning the circular region of interest (ROI) at the most contrast-enhancing part of the lesion for each case. While establishing the size and region for the ROI, positioning it in the larger area was considered in order to minimize the effect of the region on hemodynamic inhomogeneity of the tumor without necrosis or calcification. In addition, any pulmonary parenchyma and pulmonary veins adjacent to the lesion area were excluded in order to avoid partial volume effect. The same physician positioned the ROI manually in the same region of the lesion in all images, and the SI measurement was performed from the peripheral solid area for the necrotic lesions. The area of the ROI varied between 0.23 and 1.60 cm2. After the SI measurement, the following equation was used to establish the ratio increase (SI%) for each time point (t): SI%t = [(SIt – SIt0)/SIt0] × 100. t0 refers to the value before the injection of the contrast medium.
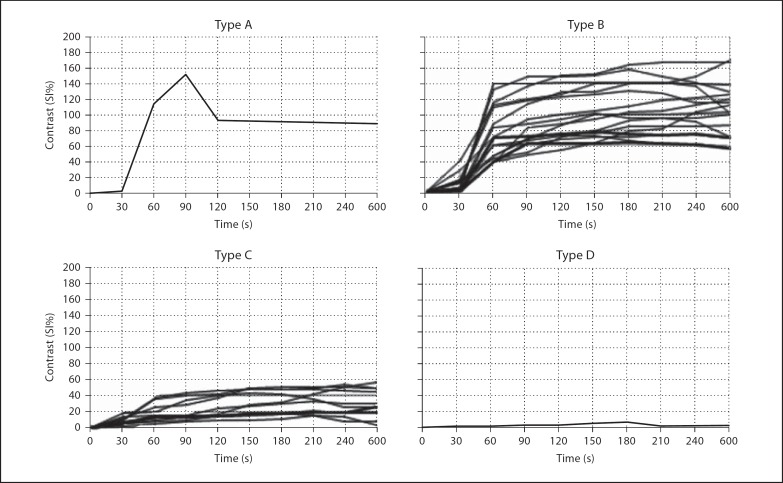
Time-SI curves were converted to time-contrast curves (SI%) for each lesion using this equation. These curves were evaluated using the classification of Schaefer et al. [14]. This classification includes type A: a strong increase in SI within the first minute followed by a rapid decrease through the early peak (EP); type B: a strong increase in SI within the first minute followed by a plateau or slow increase without washout; type C: a moderate or mild increase in SI without a rapid EP value, and type D: no significant increase in SI (those with a mean increase of <10% were included in this group).
The other parameters evaluated were the EP value, i.e. the maximum relative contrast level within the 1st minute following t0, and the maximum peak (MP) value, i.e. the maximum relative contrast level during the procedure.
Statistical Analysis
Statistical analysis was performed using frequency distribution. The χ2 test, Fisher's exact test and the Mann-Whitney U test were used to compare variables between the groups. Also, receiver-operating characteristic (ROC) analysis was used to assess sensitivity, specificity, and both positive and negative predictive values of the EP and MP parameters. SPSS 17.0 software was used to analyze the data.
Results
Of the 31 patients, 15 (48%) were diagnosed with benign and 16 (52%) with malignant lesions. The overall mean age was 57 ± 12 years (range: 40–70 years). The mean age of the patients with benign lesions was 55 ± 14 years, while that of patients with malignant lesions was 60 ± 9 years and the difference was not statistically different (p > 0.05).
The mean size of the benign lesions was 26.5 ± 5.2 mm (range: 11–59 mm), while the mean size of the malignant lesions was 48 ± 21.2 mm (range: 21–92 mm); the longest diameter was measured on the axial images. The difference in size between the benign and malignant lesions was statistically significant (p < 0.05). Five (33%) of the benign lesions were ≥30 mm, while 3 (19%) of the malignant lesions were <30 mm.
A total of 8 benign lesions had a smooth surface, while 6 had a lobulated contour. Three of the malignant lesions were lobulated, 5 were irregular, and 8 had a spiculated border. In addition, all lesions diagnosed with squamous cell carcinoma were irregular with spiculated borders. On the other hand, 2 lesions with a lobulated contour were considered adenocarcinoma, while 1 was considered large cell carcinoma.
Of the 16 patients with malignant lesions, 8 (50%) underwent CT-guided transthoracic needle aspiration biopsy, and 5 (31%) underwent transbronchial biopsy. In addition, 3 (19%) patients were diagnosed by thoracoscopic wedge resection. The number of patients diagnosed with squamous cell carcinoma was 8 (50%), which included 6 (38%) adenocarcinoma, 1 (6%) non-small cell carcinoma and 1 (6%) large cell carcinoma. Of the 15 patients with benign lesions, 6 (40%) were diagnosed histopathologically. Of these, 4 patients had granuloma including 1 with tuberculoma, while 2 had hamartoma. The remaining 9 (60%) patients with benign lesions were diagnosed by means of clinicoradiological features as well as by the findings of direct X-ray, CT and MRI during a 2-year follow-up period.
In the T1-weighted images, heterogeneous (4 vs. 1) and isointense signals (11 vs. 9) were higher in the malignant lesions whereas hypointense (2 vs. 0) and hyperintense signals (3 vs. 1) were seen in the benign ones. In the T2-weighted images, the heterogeneous signal was higher in the malignant lesions (9 vs. 4), whereas the hyperintense signal was higher in the benign ones (11 vs. 6). There was no isointense signal in the benign lesions and only 1 in the malignant ones. In both images, there was no statistical difference between the malignant and benign lesions in terms of signal intensities (p = 0.179 and p = 0.113 for T1- and T2-weighted images, respectively). Lack of benefit of signal characteristics on differential diagnosis resulted in the necessity of further dynamic evaluation. Time-contrast enhancement curves obtained from the 10 consecutive dynamic series of pulmonary lesions and interpreted using the equation SI%t = [(SIt – SIt0)/SIt0] × 100 are shown in figure 1 based on the disease type.
Fig. 1.
The distribution of the 4 different patterns (types A, B, C and D) according to time-contrast enhancement curves.
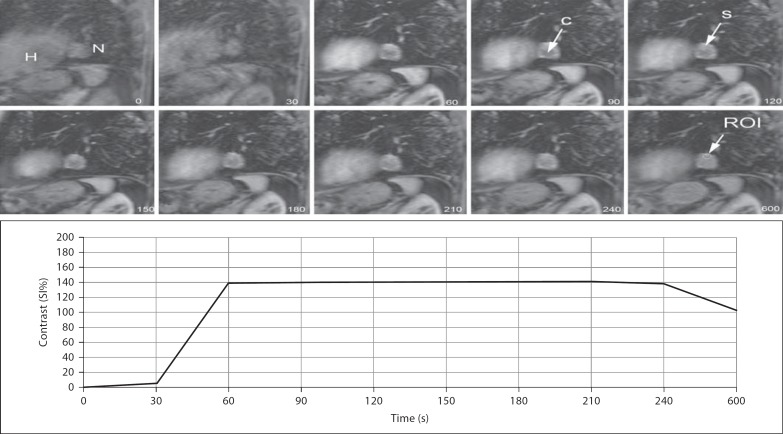
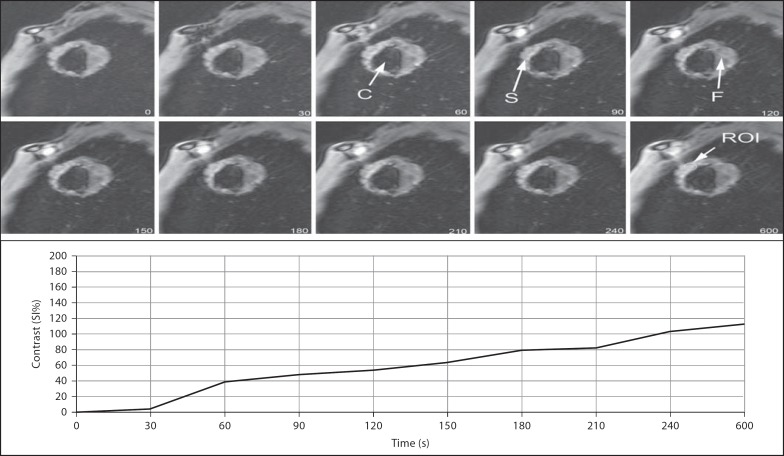
Only 1 patient with malignant disease showed the type A pattern. Fourteen patients with malignant disease and 3 with benign disease showed the type B pattern. While 10 patients with benign disease and 1 with malignant disease showed the type C pattern, only 2 patients with benign disease showed the type D pattern. All diagnoses made and data based on the types of the curve are shown in table 1. A higher proportion of the patients with malignant disease had type A and B curve patterns (p = 0.001), while a higher proportion of the patients with benign disease had type C and D curve patterns with some overlapping of B and C curve patterns among the patients with benign and malignant lesions (fig. 2, 3).
Table 1.
The proportion of malignant and benign lesions based on the dynamic curve types
| Diagnosis | Type A (n = 1) | Type B (n = 17) | Type C (n = 11) | Type D (n = 2) |
|---|---|---|---|---|
| Malignant | 1 (100%) | 14 (82%) | 1 (9%) | 0 (0%) |
| Squamous cell carcinoma | 1 | 6 | 1 | 0 |
| Adenocarcinoma | 0 | 6 | 0 | 0 |
| Small cell carcinoma | 0 | 1 | 0 | 0 |
| Large cell carcinoma | 0 | 1 | 0 | 0 |
| Benign | 0 (0%) | 3 (18%) | 10 (91%) | 2 (100%) |
| Hamartoma | 0 | 1 | 1 | 0 |
| Granuloma | 0 | 2 | 1 | 1 |
| Follow-up diagnosis of benign cases | 0 | 0 | 8 | 1 |
Fig. 2.
Dynamic images of a 63-year-old man showing a 29 × 25 mm nodule (N) with lobulated contour adjacent to the heart (H), with a significantly increased SI ratio in the early phase. The nodule also has cystic (C) and necrotic components. Time-contrast enhancement curve showing type B pattern characterized by a strong increase in SI within the first minute with EP. The patient was diagnosed with adenocarcinoma. S = Solid.
Fig. 3.
Dynamic images of a 61-year-old man. Time-contrast enhancement curve showing EP within the first minute followed by a relatively slower increase in intensity through the peripheral cavitary lesion containing solid mass. The patient was diagnosed with squamous cell carcinoma. C = Cavitary; S = solid; F = fluid.
A comparison between the SI% ratio of the steepest slope, EP, of the time-contrast enhancement curve within the first minute following injection and the maximum SI% ratio, MP, in all dynamic series showed significant differences between benign and malignant disease. As a result, the patients with malignant disease had a significantly higher value of EP and MP (p < 0.001). The median values of kinetic parameters in time-contrast enhancement curves are shown in table 2.
Table 2.
Time-contrast enhancement curve parameters
| Parameter | Benign (n = 15, 48%) | Malignant (n = 16, 52%) | p | ||
|---|---|---|---|---|---|
| median | quartiles | median | quartiles | ||
| EP | 14.45 | 7.75–37.50 | 77.08 | 44.68–113.70 | <0.001 |
| MP | 32.53 | 17.24–56.60 | 123.15 | 101.00–149.90 | <0.001 |
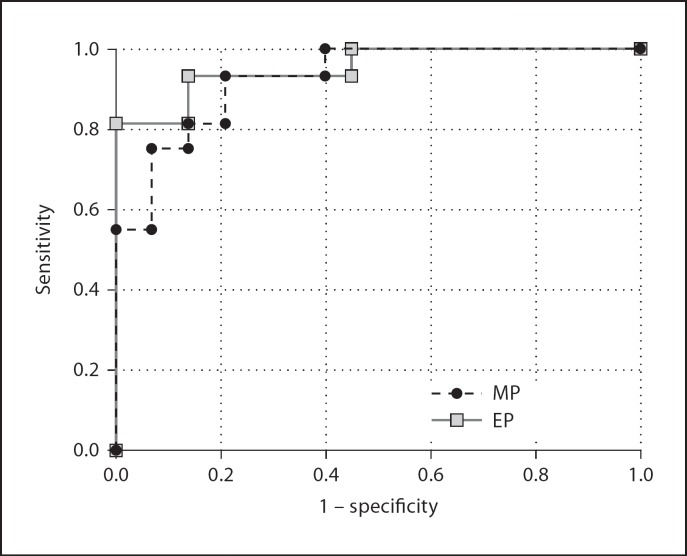
The ROC analysis showed a threshold value of 46.73% for EP with 75% sensitivity and 93% specificity. The analysis also showed a threshold value of 64.86% for MP with 93% sensitivity and 86% specificity. The area under the ROC curve was 0.929 and 0.954 for EP and MP, respectively, suggesting that the MP was more effective than the EP in differentiating between benign and malignant disease (fig. 4).
Fig. 4.
ROC curves of MP and EP.
Discussion
The findings of this study indicate that dynamic contrast-enhanced MRI in the management of indeterminate lesions was used to differentiate malignant from benign lesions and to evaluate lesion morphology, although there is no recommendation about its use in the algorithm of such lesions in current guidelines [15,16].
It has been reported [17] that the maximum enhancement rate and slope as determined in the time-contrast enhancement curve correlated with tumor angiogenesis (microvascular density), while the washout correlated with tumor interstitium (the ratio of elastic and collagen fibers). Within this context, a rapid and strong uptake of contrast medium is associated with interstitial aggregation of the medium due to increased vascularity and capillary permeability. These findings are commonly associated with malignant tumors [18].
Washout of the contrast medium was found in 57% of patients with malignant nodules (n = 58) in a study by Schaefer et al. [14]. However, two other studies observed it only in inflammatory lesions and a carcinoid tumor, while there were no quantitative data regarding washout characteristics of pulmonary nodules [19,20]. In our study, we found that only 1 patient with malignant disease showed a type A curve characterized by a washout pattern. The biggest overlap was seen in the type B curve. Increased SI within the first minute was seen in both curve types even without washout, which was consistent with the data obtained from the literature, suggesting that an increased SI rate of the first passing of the contrast medium was associated with malignant lesions [18,21,22]. However, most of the patients with benign disease showed the type C pattern characterized by a slow increase in SI without a rapid peak. Among the patients with malignant disease, only non-small cell carcinoma patients showed the type C pattern. This finding might be associated with low vascularity of the tumor.
In this study, kinetic analysis was performed using EP and MP values. As the concentration gradient between the tissue and blood after the first passing reaches the maximum level, a rapid increase is observed in the time-contrast enhancement curve parallel to tissue vascularization, resulting in acquiring quantitative data regarding tissue vascularization. In this study, EP values obtained at the steepest slope drawn within the first minute following bolus injection were compared. Significantly increased SI was observed in the malignant nodules compared to the benign ones. In addition, the MP values of the malignant lesions were higher (p < 0.001).
Although CT also allows quantification of tissue perfusion, it leads to exposure to an increased radiation dose without higher specificity [23,24,25,26]. Today, perfusion study with MRI is also possible without exposure to radiation [27,28]. Because the contrast media used in CT and MR do not have similar behavior, contrast enhancement values of both techniques are not directly comparable. The results of the studies using dynamic MRI have revealed a comparable sensitivity value with CT, despite higher specificity [14,20,21].
The limitations of our study were the small number of patients in the study group and probably the characteristics of the lesions. In this study only 1 lesion with type A was observed, but in our clinical practice we commonly encounter a type B curve in patients with malignant lesions. Another limitation of our study was that we had no histopathological confirmation of some benign cases.
Conclusion
The results of our study suggest that MRI with kinetic and morphological analysis may reduce the ratio of resection of benign nodules as well as invasive procedures and confirm that MRI is applicable and repeatable in reducing the radiation burden. This technique is also used for multiple lesions, even those with different characteristics.
References
- 1.Araz O, Akgun M, Gorguner M. Lung cancer incidence in Erzurum city. EAJM. 2010;42:111–115. doi: 10.5152/eajm.2010.32. [DOI] [PMC free article] [PubMed] [Google Scholar]
- 2.Doganay S, Gocmen H, Yikilmaz A, Coskun A. Silicosis due to denim sandblasting in young people: MDCT findings. EAJM. 2010;42:21–23. doi: 10.5152/eajm.2010.07. [DOI] [PMC free article] [PubMed] [Google Scholar]
- 3.Alper F, Akgun M, Onbas O, Araz O. CT findings in silicosis due to denim sandblasting. Eur Radiol. 2008;18:2739–2744. doi: 10.1007/s00330-008-1061-3. [DOI] [PubMed] [Google Scholar]
- 4.Chang SY, Huang TC, Su WL, Chian CF, Perng WC. Multiple pulmonary nodules in ectopic adrenocorticotropic hormone syndrome: cause or result? Med Princ Pract. 2012;21:292–294. doi: 10.1159/000335129. [DOI] [PubMed] [Google Scholar]
- 5.Al-Khawari H, Kovacs A, Athyal R, Al-Manfouhi H, Fayaz MS, Madda JP. Breast magnetic resonance imaging: initial experience in Kuwait. Med Princ Pract. 2009;18:143–148. doi: 10.1159/000189813. [DOI] [PubMed] [Google Scholar]
- 6.Brandman S, Ko JP. Pulmonary nodule detection, characterization, and management with multidetector computed tomography. J Thorac Imaging. 2011;26:90–105. doi: 10.1097/RTI.0b013e31821639a9. [DOI] [PubMed] [Google Scholar]
- 7.Nair A, Hansell DM. European and North American lung cancer screening experience and implications for pulmonary nodule management. Eur Radiol. 2011;21:2445–2454. doi: 10.1007/s00330-011-2219-y. [DOI] [PubMed] [Google Scholar]
- 8.Beigelman-Aubry C, Hill C, Grenier PA. Management of an incidentally discovered pulmonary nodule. Eur Radiol. 2007;17:449–466. doi: 10.1007/s00330-006-0399-7. [DOI] [PubMed] [Google Scholar]
- 9.Kono M, Adachi S, Kusumoto M, Sakai E. Clinical utility of Gd-DTPA-enhanced magnetic resonance imaging in lung cancer. J Thorac Imaging. 1993;8:18–26. [PubMed] [Google Scholar]
- 10.Regier M, Kandel S, Kaul MG, Hoffmann B, Ittrich H, Bansmann PM, Kemper J, Nolte-Ernsting C, Heller M, Adam G, Biederer J. Detection of small pulmonary nodules in high-field MR at 3 T: evaluation of different pulse sequences using porcine lung explants. Eur Radiol. 2007;17:1341–1351. doi: 10.1007/s00330-006-0422-z. [DOI] [PubMed] [Google Scholar]
- 11.Vogt FM, Herborn CU, Hunold P, Lauenstein TC, Schröder T, Debatin JF, Barkhausen J. HASTE MRI versus chest radiography in the detection of pulmonary nodules: comparison with MDCT. AJR Am J Roentgenol. 2004;183:71–78. doi: 10.2214/ajr.183.1.1830071. [DOI] [PubMed] [Google Scholar]
- 12.Regier M, Schwarz D, Henes FO, Groth M, Kooijman H, Begemann PG, Adam G. Diffusion-weighted MR-imaging for the detection of pulmonary nodules at 1.5 Tesla: intraindividual comparison with multidetector computed tomography. J Med Imaging Radiat Oncol. 2011;55:266–274. doi: 10.1111/j.1754-9485.2011.02263.x. [DOI] [PubMed] [Google Scholar]
- 13.Sieren JC, Ohno Y, Koyama H, Sugimura K, McLennan G. Recent technological and application developments in computed tomography and magnetic resonance imaging for improved pulmonary nodule detection and lung cancer staging. J Magn Reson Imaging. 2010;32:1353–1369. doi: 10.1002/jmri.22383. [DOI] [PMC free article] [PubMed] [Google Scholar]
- 14.Schaefer JF, Schneider V, Vollmar J, Wehrmann M, Aebert H, Friedel G, Vonthein R, Schick F, Claussen CD. Solitary pulmonary nodules: dynamic contrast-enhanced MR imaging – perfusion differences in malignant and benign lesions. Radiology. 2004;232:544–553. doi: 10.1148/radiol.2322030515. [DOI] [PubMed] [Google Scholar]
- 15.MacMahon H. Compliance with Fleischner Society guidelines for management of lung nodules: lessons and opportunities. Radiology. 2010;255:14–15. doi: 10.1148/radiol.10092382. [DOI] [PubMed] [Google Scholar]
- 16.Esmaili A, Munden RF, Mohammed TL. Small pulmonary nodule management: a survey of the members of the Society of Thoracic Radiology with comparison to the Fleischner Society guidelines. J Thorac Imaging. 2011;26:27–31. doi: 10.1097/RTI.0b013e3181d73a78. [DOI] [PubMed] [Google Scholar]
- 17.Fujimoto K, Abe T, Müller NL, Terasaki H, Kato S, Sadohara J, Kono R, Edamitsu O, Ishitake T, Hayashi A, Rikimaru T, Hayabuchi N. Small peripheral pulmonary carcinomas evaluated with dynamic MR imaging: correlation with tumor vascularity and prognosis. Radiology. 2003;227:786–793. doi: 10.1148/radiol.2273020459. [DOI] [PubMed] [Google Scholar]
- 18.Fontanini G, Vignati S, Boldrini L, Chinè S, Silvestri V, Lucchi M, Mussi A, Angeletti CA, Bevilacqua G. Vascular endothelial growth factor is associated with neovascularization and influences progression of non-small cell lung carcinoma. Clin Cancer Res. 1997;3:861–865. [PubMed] [Google Scholar]
- 19.Hittmair K, Eckersberger F, Klepetko W, Helbich T, Herold CJ. Evaluation of solitary pulmonary nodules with dynamic contrast-enhanced MR imaging: a promising technique. Magn Reson Imaging. 1995;13:923–933. doi: 10.1016/0730-725x(95)02010-q. [DOI] [PubMed] [Google Scholar]
- 20.Guckel C, Schnabel K, Deimling M, Steinbrich W. Solitary pulmonary nodules: MR evaluation of enhancement patterns with contrast-enhanced dynamic snapshot gradient-echo imaging. Radiology. 1996;200:681–686. doi: 10.1148/radiology.200.3.8756914. [DOI] [PubMed] [Google Scholar]
- 21.Ohno Y, Hatabu H, Takenaka D, Adachi S, Kono M, Sugimura K. Solitary pulmonary nodules: potential role of dynamic MR imaging in management initial experience. Radiology. 2002;224:503–511. doi: 10.1148/radiol.2242010992. [DOI] [PubMed] [Google Scholar]
- 22.Padhani AR, Husband JE. Dynamic contrast-enhanced MRI studies in oncology with an emphasis on quantification, validation and human studies. Clin Radiol. 2001;56:607–620. doi: 10.1053/crad.2001.0762. [DOI] [PubMed] [Google Scholar]
- 23.Swensen SJ, Viggiano RW, Midthun DE, Müller NL, Sherrick A, Yamashita K, Naidich DP, Patz EF, Hartman TE, Muhm JR, Weaver AL. Lung nodule enhancement at CT: multicenter study. Radiology. 2000;214:73–80. doi: 10.1148/radiology.214.1.r00ja1473. [DOI] [PubMed] [Google Scholar]
- 24.Zhang M, Kono M. Solitary pulmonary nodules: evaluation of blood flow patterns with dynamic CT. Radiology. 1997;205:471–478. doi: 10.1148/radiology.205.2.9356631. [DOI] [PubMed] [Google Scholar]
- 25.Fraioli F, Anzidei M, Zaccagna F, Mennini ML, Serra G, Gori B, Longo F, Catalano C, Passariello R. Whole-tumor perfusion CT in patients with advanced lung adenocarcinoma treated with conventional and antiangiogenetic chemotherapy: initial experience. Radiology. 2011;259:574–582. doi: 10.1148/radiol.11100600. [DOI] [PubMed] [Google Scholar]
- 26.Ohno Y, Koyama H, Matsumoto K, Onishi Y, Takenaka D, Fujisawa Y, Yoshikawa T, Konishi M, Maniwa Y, Nishimura Y, Ito T, Sugimura K. Differentiation of malignant and benign pulmonary nodules with quantitative first-pass 320-detector row perfusion CT versus FDG PET/CT. Radiology. 2011;258:599–609. doi: 10.1148/radiol.10100245. [DOI] [PubMed] [Google Scholar]
- 27.Henzler T, Schmid-Bindert G, Schoenberg SO, Fink C. Diffusion and perfusion MRI of the lung and mediastinum. Eur J Radiol. 2010;76:329–336. doi: 10.1016/j.ejrad.2010.05.005. [DOI] [PubMed] [Google Scholar]
- 28.Pauls S, Mottaghy FM, Schmidt SA, Krüger S, Möller P, Brambs HJ, Wunderlich A. Evaluation of lung tumor perfusion by dynamic contrast-enhanced MRI. Magn Reson Imaging. 2008;26:1334–1341. doi: 10.1016/j.mri.2008.04.005. [DOI] [PubMed] [Google Scholar]


