Abstract
Purpose
Optical coherence tomography's (OCT) third outer retinal band has been attributed to the zone of interdigitation between RPE cells and cone outer segments. The purpose of this paper is to investigate the structure of this band with adaptive optics (AO)-OCT.
Methods
Using AO-OCT, images were obtained from two subjects. Axial structure was characterized by measuring band 3 thickness and separation between bands 2 and 3 in segmented cones. Lateral structure was characterized by correlation of band 3 with band 2 and comparison of their power spectra. Band thickness and separation were also measured in a clinical OCT image of one subject.
Results
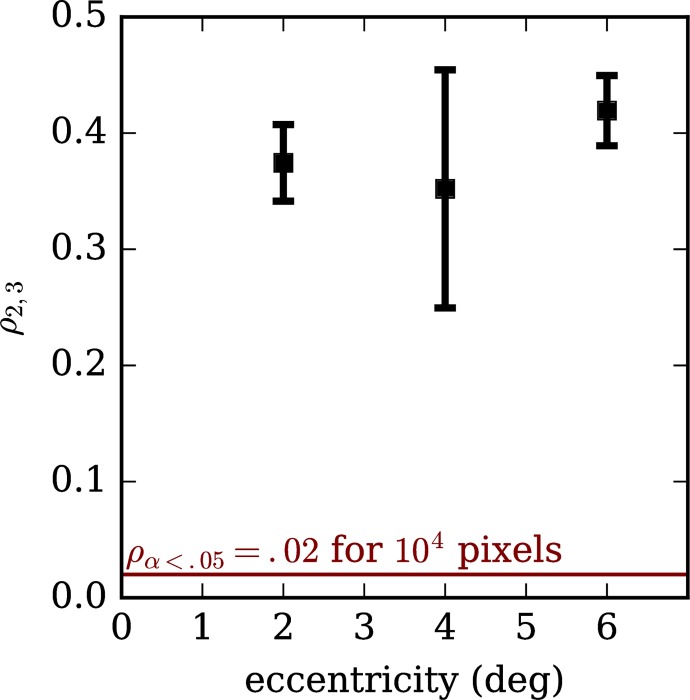
Band 3 thickness ranged from 4.3 to 6.4 μm. Band 2 correlations ranged between 0.35 and 0.41 and power spectra of both bands confirmed peak frequencies that agree with histologic density measurements. In clinical images, band 3 thickness was between 14 and 19 μm. Measurements of AO-OCT of interband distance were lower than our corresponding clinical OCT measurements.
Conclusions
Band 3 originates from a structure with axial extent similar to a single surface. Correlation with band 2 suggests an origin within the cone photoreceptor. These two observations indicate that band 3 corresponds predominantly to cone outer segment tips (COST). Conventional OCT may overestimate both the thickness of band 3 and outer segment length.
Keywords: adaptive optics, optical coherence tomography, photoreceptor morphology, photoreceptors, image analysis
A distinctive feature of optical coherence tomography (OCT) images of the human retina is the four outer retinal bands, thought to originate from the distal elements of photoreceptors and underlying RPE.1 Because disruptions of these bands are associated with several important retinal diseases, the anatomic correlates of the bands have been a topic of much recent interest. The three-dimensional structures of the second and third outer retinal bands (“band 2” and “band 3”) were first elucidated using adaptive optics (AO)-OCT.2 Based upon their qualitative similarity to en face AO images of the cone mosaic and their similar spatial frequencies, these bands were attributed to the inner-outer segment junction (IS/OS) and cone outer segment tips (COST)2; however, those attributions were initially untested.
In 2011, Spaide and Curcio1 published a paper challenging those attributions. They compared clinical OCT images with a model of the cone photoreceptor derived from dozens of anatomic studies and found that bands 2 and 3 appeared to correspond—in thickness and location—with the inner segment ellipsoid (ISe) and interdigitation zone (IZ), not the IS/OS and COST, and this new terminology was codified by an international nomenclature panel.3 Later that year we showed that band 2, when resolved within thousands of cones in four subjects, was both too thin and too far from the external limiting membrane (ELM) to originate from the ellipsoid,4 and that some aspect of the inner-outer segment junction was a more likely origin, corroborating similar observations in small numbers of cells.2,5 The controversy sparked an informative exchange of letters to the editor,6,7 which addressed several issues, some of which related to the correspondence between bands 2 and 3 and the question of whether the two bands share a common cellular origin.
The third band was originally identified and differentiated—based upon its transverse properties—from the fourth band using AO-OCT, and attributed to the tips of the cone outer segments2,8; but the recent correlative work attributes it to the IZ,1,3 with contributions from a variety of structures inside and outside the cone outer segment. The purpose of the present work is to provide a quantitative morphologic characterization of band 3—similar to the previous work on band 2—and to measure the correspondence of the two bands to one another and to previous histologic measurements of the cone mosaic. In so doing, we hope to narrow the scope of its possible origins.
Changes in the appearance of band 3 can be seen in numerous retinal diseases, including age-related macular degeneration9; central serous retinopathy10; acute posterior multifocal placoid pigment epitheliopathy11; macular telangiectasia11; choroideremia12; and cone-rod dystrophy.13 Its integrity may be an indication of recovery from epiretinal membrane surgery.14 Understanding the role played by various anatomic components of the IZ in forming the image of band 3 will improve our understanding of these diseases, and is thus of great clinical significance.
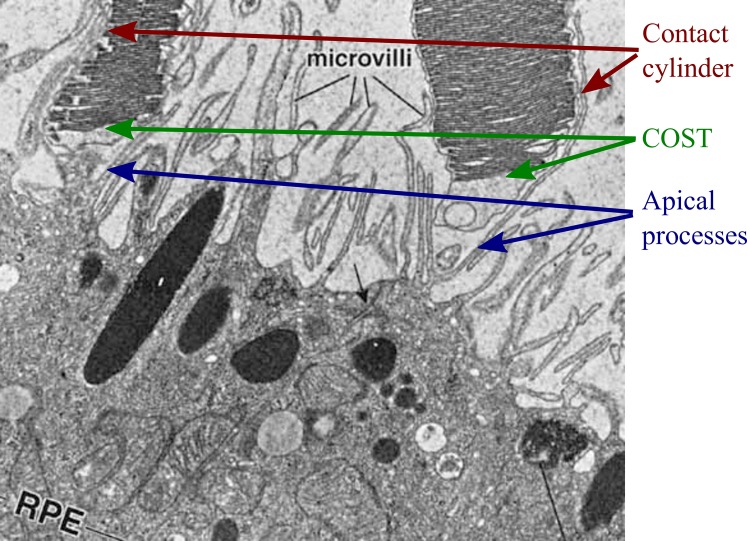
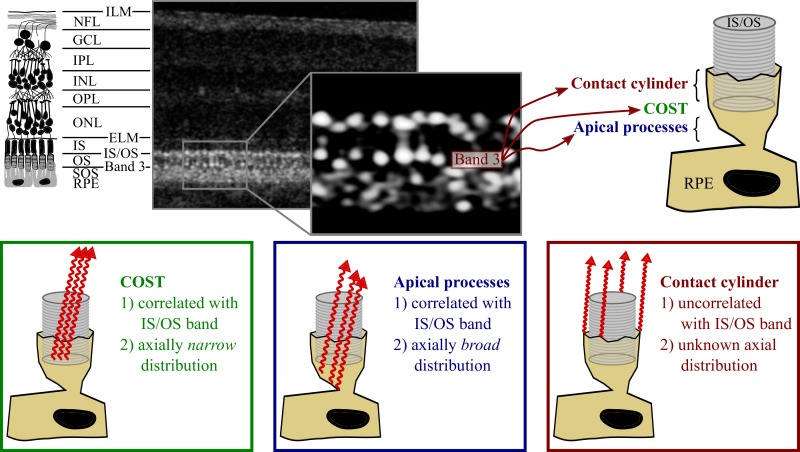
Membranous processes extend from the apical surface of the RPE cell and ensheath the outer portion of the photoreceptor OS in what is called the contact cylinder. The attribution of band 3 to the IZ implicates contributions from the COST, RPE apical processes underlying the cones, and the contact cylinder, anatomic features that are commonly seen in light and electron micrographs of the outer retina (see Fig. 1). Given its axial locus—between bands believed to originate from the IS/OS and RPE—band 3 almost certainly originates from some combination of these features. Anatomic differences among the three features lead to slightly different predictions about their appearance in AO-OCT images (see Fig. 2).
Figure 1.
Ultrastructure of the IZ. Electron micrograph of human IZ,31 reproduced with permission of the publisher. Image shows two cone outer segments (top), whose tips lie above the apical surface of the RPE (bottom). Microvilli are visible as membranous filaments extending from the apical RPE surface and running along the lateral boundaries of the cone OS. In three dimensions, these apical processes envelop the OS, forming the “contact cylinder.” The cone outer segment tips are visible as well, tightly packed with their membranous discs. Apical processes underlying the cone OS have been labeled as well. Optical coherence tomography–based studies of this band have identified three possible contributions to band 3: the contact cylinder, the outer segment tips, and the underlying apical processes, each of which would make distinct contributions to the OCT image.
Figure 2.
Possible contributions of the IZ to band 3. Top left: a diagram of the layers of the retina, with common nomenclature. Top center: an AO-OCT B-scan of the corresponding layers in log scale, with a magnified, linear scale view of band 3. Top right: Three hypothetical contributors to band 3: the contact cylinder consisting of the portion of RPE apical process that ensheaths the outer segment, the COST, and the portion of the apical processes that underlie the outer segment tip. Bottom: predicted optical characteristics of these three potential contributors.
The cone outer segment tip is a thin reflective surface which—given the guiding of light by photoreceptors—overlaps optically with the IS/OS. By “optically overlapping” we mean two structures returning photons to the detector during the same axial scan, which is true of any structures residing within the confines of a wave guide. The contribution of COST to the OCT image would have narrow axial extent (comparable to the axial point spread function [PSF] of the OCT system) and its transverse structure would be highly correlated with that of the IS/OS. The contribution of apical processes underlying COST would be broader, since these processes are axially extended over a space of several microns and fill a significant fraction of the interphotoreceptor and subretinal spaces. They may have a transverse structure resembling the IS/OS and COST, since they underlie COST and are, perhaps, illuminated by light guided by the cones. The contact cylinder, lying outside of the OS, would tend to be illuminated when the interior of the cone is not and it would thereby generate an image with transverse structure very different from that generated by IS/OS and COST, uncorrelated or inversely correlated with those. Here, we leverage the high axial and lateral resolution of AO-OCT to provide a quantitative description of the three-dimensional distribution of the light comprising band 3, and thereby assess the potential contributions of these anatomic features to the AO-OCT image. This assessment will improve our understanding of the clinical OCT image and shape our interpretation of age- and disease-related changes in its appearance.
Methods
AO-OCT Instrument
The adaptive optics OCT system consisted of two subsystems: a spectral-domain (SD)-OCT subsystem and an AO subsystem based upon a Shack-Hartmann wavefront sensor (SHWS) and voice-coil based deformable mirror (DM).
The spectral-domain OCT subsystem consisted of a light source (λ = 783 nm, Δλ = 47 nm; Broadlighter; Superlum, Inc., County Cork, Ireland; only one superluminescent diode of three was used), and a Michaelson interferometer consisting of a 80/20 fiber beam splitter that sent 80% and 20% of the source's output, respectively, to the reference and sample arms. The sample arm contained X- and Y-direction galvanometers for scanning the beam over the retina, and the components of the AO system. The reference channel consisted of a collimating lens, five planar mirrors to fold the beam into a compact footprint, a water vial designed to match chromatic dispersion induced by the eye, and a 50-mm lens focusing the beam onto a planar reference mirror. Reflected light from the two interferometer arms was combined again in the fiber coupler and sent to the spectrometer, which consisted of a fiber collimator, transmissive holographic diffraction grating, F-theta lens, and a complementary metal–oxide–semiconductor (CMOS) line scan detector (4096 pixels × 2 lines [736 × 2 used], with 12 bits per pixel, Sprint spL4096-140km; Basler AG, Ahrensburg, Germany). The optical coherence tomography system acquired 250,000 lines/sec. The theoretical axial resolution was 5.7 μm in air and 4.2 μm in the eye (n = 1.38). Axial sampling of the OCT was measured to be 3.46 μm/pixel using a calibration procedure described previously.4 The optical coherence tomography design employed here is slightly different from that used earlier,4 with the main goal being increased speed and reduced eye movement artifacts.
The adaptive optics subsystem incorporated a SHWS consisting of a lenslet array (diameter 10 mm; lenslet diameter 500 μm; f = 30 mm; Northrop Grumman Corp., Arlington, VA, USA) and an sCMOS camera (2048 × 2048 pixel, Ace acA2040-180km; Basler AG), and a high-speed, high-stroke DM (DM-97-15; ALPAO SAS, Montbonnot-Saint-Martin, France). The adaptive optics system operated at 20 Hz using the full 4 megapixel spots image. The pupil diameter was 6.75 mm, 13.5 mm, and 10 mm at the eye, DM, and SHWS, respectively. Diffraction-limited imaging (wavefront RMS < λ/14, according to the Maréchal criterion) was achieved for all subjects, corresponding to a theoretical lateral resolution of 2.5 μm in the retina (3.4 μm in the air, validated using a 1951 United States Air Force resolution test chart).
Custom software controlled the AO4 and OCT15 subsystems, written in C++ and Python/Cython/Numpy, respectively. The sample channel of the system was designed to correct for beam distortions and astigmatism that accumulate as the imaging light is relayed by the multiple off-axis spherical mirrors in the sample channel. The out-of-plane design of this system is described in detail elsewhere.16
Imaging
Using AO-OCT, subjects with no known retinal disease were imaged after providing written, informed consent. The subjects were both female emmetropes, ages 39 and 19. This research followed the tenets of the Declaration of Helsinki and was approved by the institutional review board of the University of California, Davis Medical Center (Sacramento, CA, USA). Subjects were cyclopleged and dilated with single drops of tropicamide (1%) and phenylephrine (2.5%) at the start of the experiment. Imaging lasted between 1 and 2 hours, including alignment of the subject's eye to the system.
Each subject was imaged at retinal eccentricities of 2.0°, 4.0°, and 6.0° temporal to the fovea. At eccentricities lower than 1.5°, the packing density of cones approaches the theoretical resolution limit of AO imaging, and the complete cone mosaic is not reliably resolvable. Outside of the parafovea, cones become sparser as the fractional population of rods grows, and the number of cones available for analysis in each image falls. Moreover, the proportion of area occupied by rods increases with eccentricity, and while their impact on the OCT image is the subject of ongoing studies,16–18 it is not yet well understood. Volumes subtended approximately 1° in the slow- and fast-scanned transverse dimensions, and spanned the whole retina in depth. For each subject, several volumetric images were collected at each location. Image quality varied among these volumes, and volumes were selected for analysis according to image quality.
For one subject, additional OCT imaging was performed using a commercial OCT device (Spectralis HRA+OCT; Heidelberg Engineering, Heidelberg, Germany).
Image Analysis
Analysis of OCT (Heidelberg Engineering) images consisted of measurements of band 3 thickness and the separation between bands 2 and 3. Analysis of AO-OCT images consisted of axial and lateral characterization of band 3. All analysis was conducted on linear scale images using open source tools available in the Python/Numpy/Scipy stack.
Analysis of Commercial OCT Images
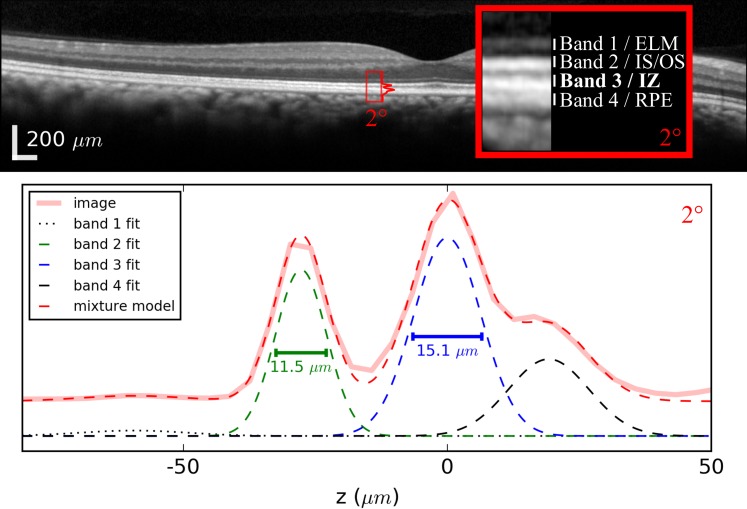
In order to provide a baseline for consideration of the AO-OCT images, we performed morphologic analysis on the OCT (Heidelberg Engineering) B-scans. Because the instrument records images in log scale, linear conversion was performed using the reported dynamic range of each image.4 At one-degree intervals between 1° and 7°, we cropped 150 μm–wide sections, each of which axially spanned the four outer retinal bands. These were averaged laterally, creating one-dimensional axial reflectance profiles for each of the eight locations. Each axial profile was fit with a Gaussian mixture model:
 |
where z was depth and  ,
,  , and
, and  were the axial position, amplitude, and Gaussian width parameter for layer
  . The error between the model and the axial profile was minimized using a numerical optimization algorithm (unconstrained Broyden–Fletcher–Goldfarb–Shanno [BFGS]). From each fit, two parameters were extracted. First, the full-width half-maximum (FWHM) thickness of band 3 (Δ
 ) was calculated from the band's width parameter
  using
using  . Next, the separation between bands 2 and 3 was calculated using
  . An example of the Gaussian mixture modeling is shown in Figure 3.
Figure 3.
Peak width measured by fitting a conventional OCT image with a Gaussian mixture model. Top: an OCT (Heidelberg Engineering) B-scan of a subject without known retinal disease. Peaks were measured at 1-degree intervals between 1° and 8°. Below: plot of the axial profile (solid pink) for the 2° location. Similar profiles were computed at 1-degree intervals between 1° and 7°. For each axial profile, a Gaussian mixture model was used to fit the four peaks corresponding to outer retinal bands 1, 2, 3, and 4 (shown in black dotted, green, blue, and black dashed). The model was used to compute full-width half-maximum peak widths and the distance between peaks 2 and 3. Plots of the profile and mixture model are offset vertically from the Gaussian components of the model in order to facilitate visibility. The wide-field image at the top is shown in the instrument's automatic log scale, while the inset image and plot were converted to linear scale
Analysis of the Axial Characteristics of AO-OCT Cone Images
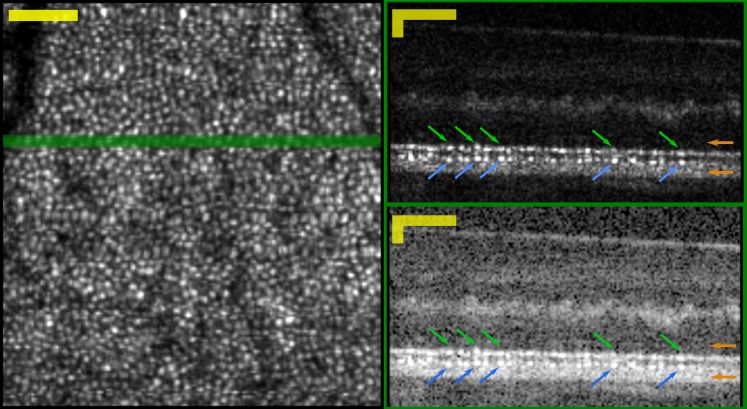
The key motivation for using AO-OCT in this experiment is the ability to measure the axial structure of band 3 in individual cones. As such, the first step was automatic identification of cone outer segments and three-dimensional segmentation (see Fig. 4). Identification of cone outer segments (OS) was performed in two steps. First, the axial borders of the OS were determined using model-based segmentation. These locations were used to generate areal projections of the band 2 and 3 surfaces. The lateral locations of cones were determined using a custom two-dimensional gradient search. The two-step process is described in detail elsewhere.4 Identification of the axial and lateral borders of each OS permitted three-dimensional segmentation of cones. For the present study, we chose to conduct measurements on the brightest cones; cones were included whose brightest pixel was more than 2 SDs above the volume median. From both subjects, between 300 and 500 cones were studied at each retinal eccentricity.
Figure 4.
Areal and cross-sectional views into the three-dimensional AO-OCT image. Left: Areal projection of cone mosaic, generated by segmenting and averaging en face slices through the volume, at the depths of bands 2 and 3. Right: cross-sectional views of the AO-OCT image generated by averaging three consecutive B-scans, shown in linear (top) and logarithmic (bottom) scales. The green line in the en face view shows the location of the B-scans. The linear scale shows clearly two correlated series of features, which appear to correspond to bands 2 and 3 seen in conventional OCT images. Features corresponding to bands 2 and 3 are indicated in the images with green and blue arrows, respectively. The locations of the band 1 and 4 peaks are indicated with orange arrows at the right. Image was acquired at 6° from subject 1. Scale Bars: 50 μm in lateral and axial dimensions.
After segmentation, the A-lines comprising each cone were averaged to produce an axial reflectance profile for the cone, and the bands were fit with a Gaussian mixture model as described above. From the resulting band 3 width parameter, the FWHM band thickness was calculated, as above. For comparison, band 2 thickness was measured identically, and from the locations of the band 2 and 3 peaks, the distance between them was calculated as well.
Analysis of the Lateral Characteristics of AO-OCT Cone Images
Two aspects of the transverse structure of the band 3 mosaic were measured. Both measurements were performed on the areal projections of bands 2 and 3 used for segmentation of the cones. First, in order to test whether the scattering structures responsible for band 3 lie within the cone, we calculated Pearson correlations between projections of band 2 and 3. Second, in order to compare the spacings of the structures comprising the bands, we computed power spectra for each band at each eccentricity. Individual B-scans were collected within 1 to 2 ms, depending upon eccentricity and sampling density. Within this time frame, the effect of fixational eye movements on the image (i.e., warp) can be neglected. Because volumes required between 200 and 300 ms to capture, eye movement artifacts were present. The component of eye motion in the slow scan dimension can cause apparent expansion or compression of image features, and these broaden the relevant power spectrum peak. To avoid these artifacts, power spectra were computed by performing one-dimensional Fourier transformations of the areal projections, along the dimension of the fast scan of the AO-OCT. This approach could cause another sort of error, due to anisotropy of spatial frequencies. We assumed that local variations in mosaic orientation would wash out any such anisotropy bias.
The Potential Influence of Rods on Cone Measurements
Rod photoreceptors are present at all of the eccentricities we imaged, with rods outnumbering cones by factors of 2 to 10.19 Bulk averaging of volumetric data in the lateral dimensions, at these eccentricities, would include the influence of rods and could lead to biases or systematic errors in our measurements. Indeed, at these loci in clinical and conventional OCT images, where the profiles of neighboring rods and cones are blurred together (due to both the larger lateral PSF and B-scan averaging, when used), rods almost certainly make contributions to the axial reflectance profile of the tissue, and could result in errors if the resulting profile were attributed wholly to cones.
Our analytical approach was designed to take advantage of the cellular resolution offered by AO-OCT by restricting measurements to portions of the image generated by the cones, as much as possible. In the case of axial measurements, this was done by volumetrically segmenting cones prior to averaging A-lines. We believe that this is an effective way to minimize contributions from the rods to the axial profiles of the cones. In the case of lateral measurements—correlations between bands and spatial power spectra—we segmented the band 2 and 3 layers from the AO-OCT volumes and analyzed them. In both cases, we believe that the contributions of the rod outer segment tips (ROST) would be minimal, because ROST lies very close to the RPE (band 4), distal to bands 2 and 3 and easy to avoid in the analysis, even in the presence of lateral blur that might bring some of the ROST signal into the segmented cone volumes. We are less certain about contributions due to the rod IS/OS. Adaptive optics images of the rod IS/OS have not, to date, been published, and little is known about its axial locus or brightness. Preliminary evidence, however, suggests that the rod IS/OS location is a few microns distal to the cone IS/OS, and that it is much less reflective than the latter (Jonnal RJ, et al. IOVS 2016;57:ARVO E-Abstract 4641 and Wells-Gray E, et al. IOVS 2016;57:ARVO E-Abstract 4633).
Results
Characterization of Axial Structure of Band 3
Peak Width and Separation in Conventional OCT Images
An optical coherence tomography (Heidelberg Engineering) B-scan along with results of Gaussian mixture fitting of the outer retinal bands is shown in Figure 3. The resulting band 3 widths ranged between 14 and 19 μm where they could be reliably measured. At 8° and beyond, bands 2 and 3 could not be clearly differentiated, and measurements of peak width were not considered. The distance between bands 2 and 3 ranged from 31.5 μm at 1.0° to 17.5 μm at 7.0°. Again, measurements at and beyond 8° were not considered.
Detection and Segmentation of Cones
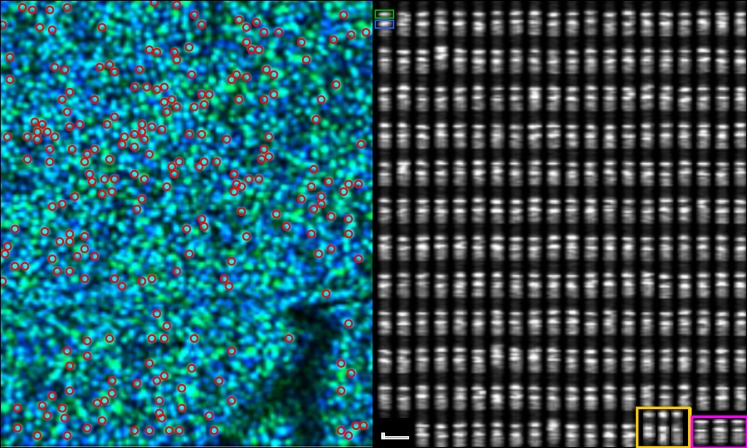
Three-dimensional segmentation of cones permitted areal projection of the cone mosaic (see Fig. 4, left), from which cones were automatically detected and measured if sufficiently bright. This was followed by a cross-sectional projection, which revealed that each cone OS consists of two bright spots at the levels of outer retinal bands 2 and 3 in conventional OCT images (see Fig. 4, right). These two bands are usually separated by a relatively dark area, and a somewhat brighter area can be seen below the second (band 3) spot in most cones. These features can be observed in most of the cross-sectional images of cones in Figure 5.
Figure 5.
To characterize axial structure of the cones, outer segments were segmented in three dimensions from the volumetric image. Left: an aerial view of the cone mosaic. The pseudocolor composite was generated by putting bands 2 and 3 in the green and blue channels of a red, green, blue image. Cones with a relatively brighter band 2 appear green and cones with a relatively brighter band 3 appear blue; cones with similar contributions from bands 2 and 3 appear cyan. Bright cones, automatically selected for analysis, are indicated with red circles. Right: the same cones shown in cross-section. Each cone consists of two bright bands, the band 2 and 3 reflections, and many of them possess a more diffusely scattering region distal to (below) band 3. In the upper-left cone, the band 2 and 3 reflections are indicated with green and blue boxes, respectively. The thicknesses of the two bands are qualitatively similar. Thickness of both bands was later measured by Gaussian fitting. Images acquired at 4° from subject 1. In the lower right, three cones from the 2° and 6° eccentricities in the same subject are shown in yellow and magenta boxes, respectively. Scale bar indicates 10 μm in axial and lateral dimensions.
Band 3 Thickness in AO-OCT Images of Cones
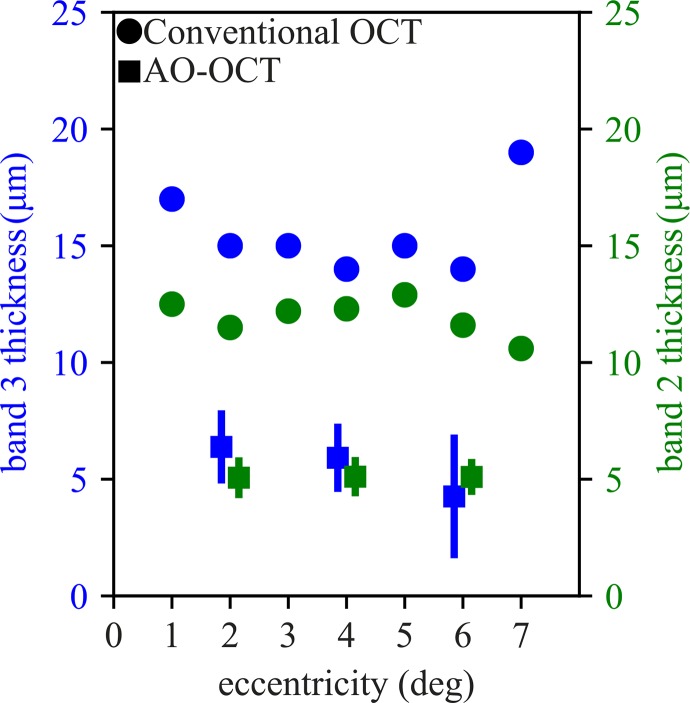
Band 3 thickness, averaged across cones in both subjects, ranged from 6.4 μm at 2° to 4.3 μm at 6°, and are plotted in Figure 6 (blue squares). Average band 3 thickness is comparable to average band 2 thickness (Fig. 6, green squares), which we have previously shown to originate from a single reflector or multiple closely-spaced (≤3.5 μm) reflectors. For both bands 3 and 2, thickness measured with the OCT device (Heidelberg Engineering) is greater by a factor of 2 to 3, with band 3 significantly broader at every eccentricity (Fig. 6, blue and green circles, respectively).
Figure 6.
The thicknesses of band 3 across retinal eccentricities. Thicknesses of bands were determined by fitting each cone's axial linear intensity profile with a Gaussian function. Average AO-OCT band 3 thickness (blue squares) ranged from 6.4 μm at 2° to 4.3 μm at 6°, but dependence upon eccentricity was not significant. Average AO-OCT band 2 thickness (green squares) was 5.1 μm at all three eccentricities. The similarity between thickness measurements for the two bands suggests similar physical origins, namely one or more reflective surfaces spanning no more than a few microns in depth. Error bars show standard deviation of measurements, which appear larger for band 3 (green) than for corresponding measurements of band 2 (blue), which may be due to additional optical complexity of scattering near the outer segment tips. The axial PSF is 4.7-μm wide, which is at most 1.7 μm smaller than the mean thickness measured with AO-OCT, and within the error range for most measurements. Corresponding measurements of bands 2 and 3 from OCT (Heidelberg Engineering) B-scans are plotted with green and blue circles, respectively. For adaptive optics OCT measurements, markers offset horizontally for visibility.
Outer Segment Length
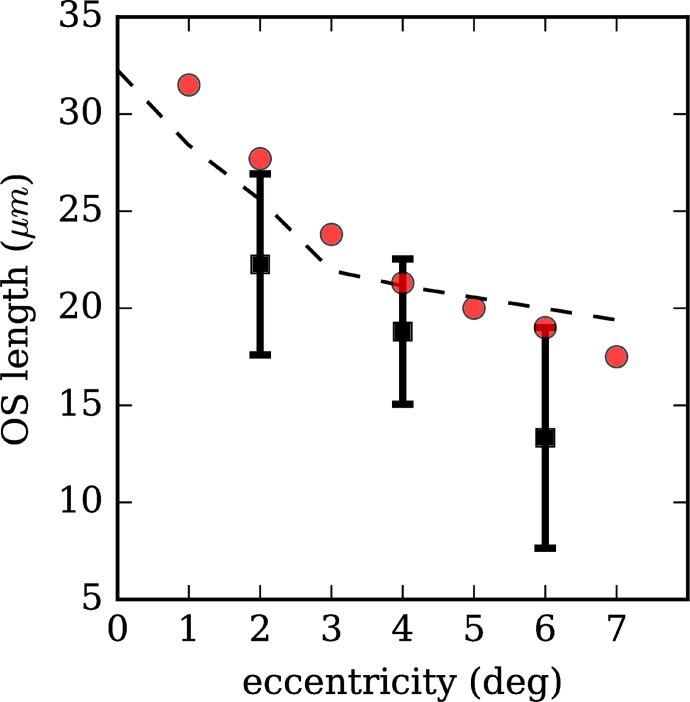
At each eccentricity, in the same cones in which band thickness was measured, the distance between bands 2 and 3 was measured as well. The resulting average values were 22.3 μm, 18.7 μm, and 13.2 μm at eccentricities of 2°, 4°, and 6°, respectively, with the differences among eccentricities being highly significant (ANOVA, F = 1574.4, P ≪ 0.05). The resulting values are plotted in Figure 7 (black squares). Along with the AO-OCT measurements, corresponding measurements from our Spectralis images (red circles) and another study using conventional research-grade OCT17 (dashed line) are plotted as well. Our AO-OCT measurements of the distance between these bands are notably lower than those from our Spectralis images and from those reported in the literature.
Figure 7.
Outer segment length across retinal eccentricities. Outer segment length was determined by segmenting the band 2 and 3 reflections from AO-OCT images of single cones and computing the distance between them (black squares). Outer segment length falls with increasing retinal eccentricity. Previous measurements using research-grade ultrahigh resolution-OCT and our measurements using the commercial OCT device (Heidelberg Engineering) are shown (black dashed line and red circles, respectively). Overestimation of OS length using the latter two approaches may be caused by broadening of peak width by structures below the outer segment tip (e.g., RPE apical processes or phagosomes).
Characterization of Lateral Structure of Band 3
Segmentation of Distinct Band 2 and 3 Cone Mosaics
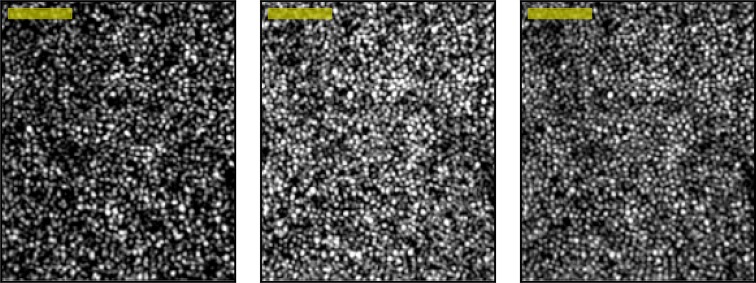
The en face cone mosaic was visible at two discrete depths in the volumetric AO-OCT images, corresponding to the band 2 and 3 reflections visible in B-scans (see Fig. 8, left and center). Because light is reflected from both surfaces in each cone, we surmise that two-dimensional AO images of the cone mosaic (e.g., those collected with AO-flood and AO–scanning laser ophthalmoscope [SLO] systems) consist of a sum of these two mosaics (Fig. 8, right). The band 2 and 3 mosaics bear qualitative similarity, but sometimes differ in overall brightness. Even when overall brightness of the two layers is similar, the reflectances of the bands within individual cones may differ—sometimes the band 2 reflection from a cone is brighter than the band 3 reflection, and sometimes vice versa (see Fig. 5, left). With increasing eccentricity, the en face shape of the cone may differ significantly at the two layers, provisionally due to differences in modal content related to multimode propagation in the inner segment, but this is unlikely to be a major factor at the eccentricities we studied.20
Figure 8.
Two distinct en face projections of the cone mosaic. The cone mosaic can be detected aerially at the level of band 2 (left) or band 3 (center). These two projections may be added (right) to simulate an image produced by a two-dimensional AO instrument (e.g., AO-flood or AO-SLO), which (presumably) collect light from both surfaces simultaneously. The band 2 and 3 projections have many qualitative similarities, consisting of arrays of apparently overlapping bright spots. Contrast has been scaled identically for the three images, which permits observation of real differences in brightness of the reflective structures. In this volume, more light was returned from band 3 than 2, but in general their relative brightnesses depend upon focus and other instrument settings. Images acquired at 2° location in subject 2. Scale Bar: 50 μm.
Correlation of Areal Projections of Bands 2 and 3
We computed the Pearson correlation between areal projections of bands 2 and 3 in order to assess whether the lateral distribution of light in the two layers was similar. The resulting correlations, which ranged between 0.35 and 0.41, are plotted in Figure 9. For 100 × 100 pixel images, a correlation of 0.02 is significant at α = 0.05, indicated with the horizontal red line; the cutoff is still lower for our images, which were between 175 × 200 and 200 × 200 pixels. These correlations suggest significant similarity between the structures visible in projections of the two bands.
Figure 9.
Correlation between areal projections of bands 2 and 3, across retinal eccentricities (ρ2,3). Positive correlations (ρ2,3 > 0) suggest that the reflective structures in band 3 overlap with those in band 2. Band 2 has been shown to originate from within the cone photoreceptor. Significant positive correlation between the bands suggests that the object responsible for band 3 lies within the optical footprint of the inner and outer segments.
Power Spectra of Areal Projections of Bands 2 and 3
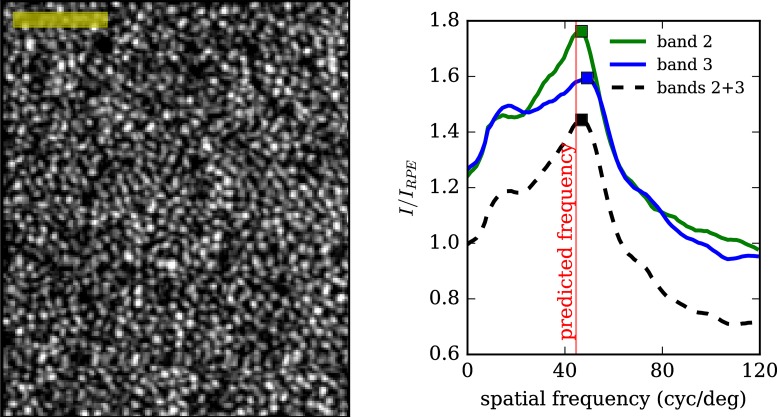
Power spectra of the band 2 projection, band 3 projection, and their average were computed for each volumetric AO-OCT image. An example average projection is shown in Figure 10 (left), along with the resulting power spectra for the three separate images (right). Power spectra were computed by one-dimensional Fourier transformation along the fast axis of the image, followed by normalization by the same transformation of the RPE image. All cone mosaic images displayed distinct peaks between 35 and 60 cyc/deg.
Figure 10.
Power spectra of areal projections of bands 2 and 3 reveal distinct peaks. Left: an aerial image of the cone mosaic, acquired at 4° from subject 2, generated by averaging projections from bands 2 and 3. Right: the power spectrum of the same images (bands 2, 3, and 2 + 3), computed by Fourier transformation and plotted as a fraction of the corresponding RPE power spectrum. The power spectrum peak is close to the frequency corresponding to regularly tiled cones at densities reported in the literature. Scale Bar: 50 μm.
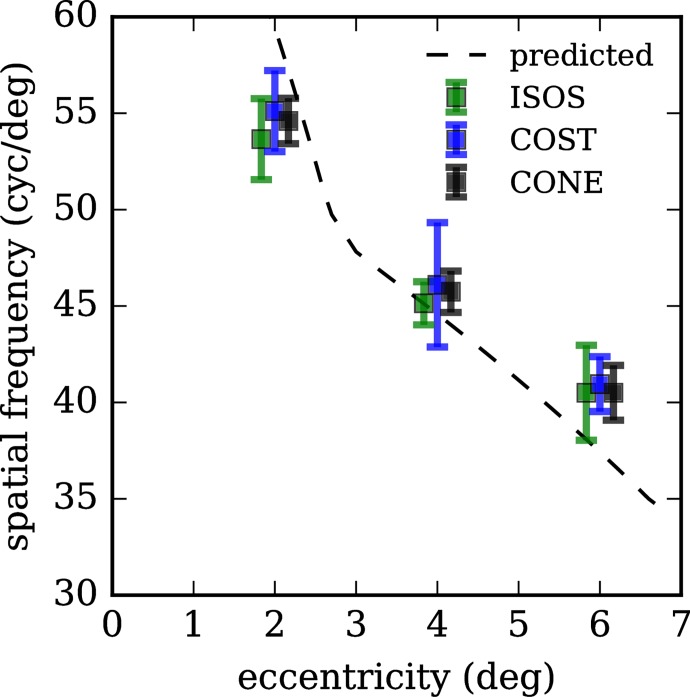
Average peak frequencies are plotted in Figure 11, separately for band 2, band 3, and their average (green, blue, and black, respectively). Using cone density measurements reported in the literature based upon histologic study of postmortem human retinae,19 we calculated corresponding spatial frequencies across the eccentricities we imaged, and these are plotted in Figure 11 (dashed black line). In our images, cones appear to be less densely packed at 2.0° and slightly more densely packed at 4.0° and 6.0° than the previous histologic study.
Figure 11.
Peaks of power spectra for bands 2, 3, and their average, across retinal eccentricities. Peak spatial frequencies of features in bands 2 and 3 decrease with increasing retinal eccentricity. This observation provides further evidence that the features at the two levels are correlated. Moreover, their agreement with predicted spatial frequencies (computed from cone density measurements reported in the literature19) provides confirmation that these are cone photoreceptors. Error bars represent 1 SD. At each eccentricity, markers are offset horizontally for visibility.
Discussion
The measured thickness of band 3 ranged between 4.3 and 6.4 μm over the eccentricities measured. Considering the system's axial PSF of 4.2 μm, this range implicates a scattering object with thickness less than 2.2 μm. We previously approached the question of band 3 thickness by studying the outer retinal bands in AO-OCT B-scans (Jonnal RJ, et al. IOVS 2015;56:ARVO E-Abstract 4097). In that study of six subjects, we segmented cones from the cross-sectional image in two dimensions, aligned them by their band 3 reflections, and averaged the resulting staggered B-scan. That system employed a broader bandwidth source with a resulting axial PSF 2.0-μm wide. The resulting band 3 FWHM measurements ranged from 3.1 to 4.9 μm, at eccentricities between 1.5° and 4.2°, suggesting one or more reflective structures spanning a distance between 1.1 and 2.9 μm, which is consistent with the present findings.
The adaptive optics OCT measurements of the band 3 thickness are significantly smaller than corresponding measurements taken with the OCT instrument (Heidelberg Engineering). As with band 2, factors contributing to this discrepancy likely include: (1) lateral aggregation of the signal, due to the clinical instrument's larger lateral PSF and B-scan averaging combined with axial staggering of COST among neighboring cones; and (2) the clinical system's larger axial PSF. As described above, beyond 8°, location and measurement of the bands was not possible with the clinical system. At approximately 8°, another band appears, between bands 3 and 4, which has been attributed to ROST.17 Additionally, band 3 becomes less consistent, possibly due to the dwindling density of the cones. Interestingly, band 2 appears to remain consistent across a larger eccentricity (≈10°), suggesting that either the cone IS/OS becomes relatively robust compared with the COST signal, or that the rod IS/OS visibility increases. In the near periphery, bands 2 and 3 approach one another as the cone OS becomes shorter; they become indistinguishable near 12°.
The significant correlation between bands 2 and 3 suggests that the transverse footprint of the band 3 scattering object is similar to that of the anatomic correlate of band 2. Whether band 2 originates from the inner segment ellipsoid or the inner-outer segment junction, it is widely believed to originate within the cone cell, which in turn suggests that the object responsible for band 3 originates within the cone as well, or at least within its lateral confines. While the correlations between the bands are significant, they are lower than some previously reported.7 A potential reason for this lies in the experimental protocol, in which band 3 visibility was the most important criterion in image acquisition and selection of volumes for analysis. Moreover, the correlation between these images depends on the system's signal-to-noise ratio. The system employed in this experiment had an SNR lower than those employed in previous work,4 as the present system was designed to reduce the impact of fixational eye motion by operating significantly faster and with both lower light levels (<500 μW at the cornea) and lower exposure times (1–2 μs). Finally, given that rods are present in significant numbers at these eccentricities, and given that we do not know the axial origin or reflectivity of the rod IS/OS, we cannot rule out the possibility that its visibility in the band 2 projection might reduce the statistical correlation between the latter and the band 3 projection, which is unlikely to have significant contribution from either rod IS/OS or ROST. Other potential sources of decorrelation between the bands are noise, minor differences in modal content,20 and instability of band 3 due to disc shedding.21
The statistical similarity between the images was echoed by similarities in their spatial power spectra. The former indicates that the two images are bright in the same places, while the latter indicates correspondence between the size and spacing of image features. Cone spacings have been frequently measured using AO modalities, and in most cases are compared with histologic measurements from the seminal paper of Curcio et al.19 on the topic. We performed the same comparison and found close correspondence between our measurements and that of Curcio et al.19 (see Fig. 11). Minor differences could be explained by a slight miscalibration of our fixation target, or by differences in mean eye length of our subjects and those in the study of Curcio et al.19 Moreover, the latter study reported variation among individual densities. To calculate retinal area corresponding to the visual solid angle, we used a constant value of 300 linear μm/°, but this is known to vary slightly with eye length and eccentricity, and some error might have been introduced thereby.
Given the narrow axial extent of the band 3 image in single cones, the most significant contribution to band 3 is likely to be the COST. Cone outer segment tips are presumed to arise from the mismatch between the index of refraction of the outer segment and that of the extracellular matrix. The former has been reported to range between 1.3922 and 1.43,23 while to our knowledge the latter has not been well-characterized. Given OS wave guiding, it can be assumed to be lower than that of the OS, and it is sometimes assumed to be similar to that of water.24 Of course the difference in refractive indices need not be large to generate OCT signal; mismatches as small as 10–3 can be detected with typical OCT systems.4
Theoretically, if band 3 originated at a mirror-like surface, its width in the AO-OCT image would be equal to that of the axial PSF (4.2 μm). Noise in the OCT subsystem can lead to deviations from this theoretical value. Some sources of noise, such as shot noise, have an equal likelihood of broadening or narrowing the appearance of a given object. However, it is apparent in the present images (e.g., see Figs. 4, 5), that another, dimmer signal exists below the bright reflection due to band 3. This may be due to uncompensated dispersion mismatch, which tends to increase the apparent size of an object, and would tend to broaden our quantitative estimates of its width.
On the other hand, if the apparent signal arises from scattering material, it implicates scatterers beyond COST, namely apical processes of the RPE. This is an intriguing hypothesis, as it would explain the difference between band 2 and 3 thickness seen in the clinical OCT images presented here (Fig. 6) and a similar difference visible in Spaide and Curcio's1 axial profiles. Presence of scattering material beyond COST (e.g., RPE apical processes, ROST, phagosomes) would tend to increase the apparent distance between bands 2 and 3 in conventional OCT images, which might explain why the AO-OCT measurements of this distance are smaller than corresponding conventional measurements (see Fig. 7). On this view, AO-OCT permits the individuation of single cone outer segment tips because of their appearance as bright peaks in single, segmented cones, while conventional OCT, with its lateral resolution of 10 to 15 μm, blurs these together along with more distal material, which generates an overall distal bias and overestimation of outer segment length. One of the reasons for the proposed new ISe/IZ nomenclature is apparent alignment of band 2 with the ellipsoid and band 3 with the IZ. The present work suggests that band 3 originates at COST with possible distal contributions. An implication of this distal shift in attribution of band 3 is that the resulting relative position of band 2 in clinical OCT images would better align with the IS/OS, providing parsimony between AO-OCT4 and clinical OCT1 measurements of its location.
Lastly, a significant contribution to band 3 from the cone contact cylinder is unlikely. Given that the contact cylinder envelops just the distal 4 μm of the OS in the perifovea,1 the bulk thickness of both contact cylinder and COST together lies within the range of error we report in band 3 thickness. However, given its transverse location outside of the footprint of the OS, and given that the IS effectively guides light and condenses it within the OS,20,25 it would not correlate with band 2. In fact, if band 3 consisted predominantly of signal returned from the contact cylinder, we might expect negative correlation with band 2.
Our interpretation of band 3 in AO-OCT images is that it consists predominantly of light originating from COST, with possible contributions from apical processes of the RPE. If this is correct, the breadth and position of band 3 in clinical OCT images would be explained by light returned from axially staggered reflective structures (COST) with possible contributions from apical processes, blurred together by a larger lateral resolution and image averaging.
Apart from the present study, a number of other studies are consistent with the interpretation that band 3 arises entirely or largely from COST. It has recently been shown that such disruptions of COST due to disc shedding dramatically reduce its reflectivity, effectively eliminating the brightest portion of the band.21 That finding is consistent with the origin of band 3 at the outer segment tips, since phagocytosis of the outer segment tip is unlikely to entirely remove contributions from the contact cylinder or RPE apical processes. Studies of AO-OCT of outer segment renewal26 demonstrated that the distance between bands 2 and 3 increases at rates of approximately 150 nm/hour, which is further evidence that band 3 originates at the outer segment tip, since neither the contact cylinder nor the apical processes are thought to retreat, in bulk, from IS/OS. Adaptive optics flood illumination studies of stimulus-evoked changes in OS optical length27 and OS renewal28 similarly confirm that a significant fraction of light generating the two-dimensional en face image of the cone originates at the outer segment tips. The involvement of COST in stimulus-evoked elongation of the outer segment was recently confirmed using OCT with digital aberration correction.29 Finally, OCT was used to measure depth-resolved Stiles-Crawford directionality and showed that the most directional component of the OCT signal was band 3, more than an order of magnitude more directional than band 4 (RPE).30 Directionality of band 3 is consistent with its origin at the tip of the wave guiding cone outer segment.
Acknowledgments
The authors thank Susan Garcia for assistance with imaging, and Yifan Jian and Marinko Sarunic for use of custom OCT imaging software.
Supported by National Institutes of Health Grants R01 EY 024239 (JSW) and K99 EY 026068 (RSJ).
Disclosure: R.S. Jonnal, P; I. Gorczynska, None; J.V. Migacz, None; M. Azimipour, None; R.J. Zawadzki, None; J.S. Werner, None
References
- 1. Spaide RF, Curcio CA. . Anatomical correlates to the bands seen in the outer retina by optical coherence tomography: literature review and model. Retina. 2011; 31: 1609– 1619. [DOI] [PMC free article] [PubMed] [Google Scholar]
- 2. Zhang Y, Cense B, Rha J,et al. High-speed volumetric imaging of cone photoreceptors with adaptive optics spectral-domain optical coherence tomography. Opt Express. 2006; 14: 4380– 4394. [DOI] [PMC free article] [PubMed] [Google Scholar]
- 3. Staurenghi G, Sadda S, Chakravarthy U, Spaide RF; International Nomenclature for Optical Coherence Tomography (IN•OCT) Panel. . Proposed lexicon for anatomic landmarks in normal posterior segment spectral-domain optical coherence tomography: the IN•OCT consensus. Ophthalmology. 2014; 121: 1572– 1578. [DOI] [PubMed] [Google Scholar]
- 4. Jonnal RS, Kocaoglu OP, Zawadzki RJ, Lee S-H, Werner JS, Miller DT. . The cellular origins of the outer retinal bands in optical coherence tomography images. Invest Ophthalmol Vis Sci. 2014; 55: 7904– 7918. [DOI] [PMC free article] [PubMed] [Google Scholar]
- 5. Meadway A, Girkin CA, Zhang Y. . A dual-modal retinal imaging system with adaptive optics. Opt Express. 2013; 21: 29792– 29807. [DOI] [PMC free article] [PubMed] [Google Scholar]
- 6. Spaide RF. . Outer retinal bands. Invest Ophthalmol Vis Sci. 2015; 56: 2505– 2506. [DOI] [PubMed] [Google Scholar]
- 7. Jonnal RS, Kocaoglu OP, Zawadzki RJ, Lee S-H, Werner JS, Miller DT. . Author response: outer retinal bands. Invest Ophthalmol Vis Sci. 2015; 56: 2507– 2510. [DOI] [PMC free article] [PubMed] [Google Scholar]
- 8. Zawadzki R, Jones S, Olivier S,et al. Adaptive-optics optical coherence tomography for high-resolution and high-speed 3D retinal in vivo imaging. Opt Express. 2005; 13: 8532– 8546. [DOI] [PMC free article] [PubMed] [Google Scholar]
- 9. Panorgias A, Zawadzki RJ, Capps AG, Hunter AA, Morse LS, Werner JS. . Multimodal assessment of microscopic morphology and retinal function in patients with geographic atrophy. Invest Ophthalmol Vis Sci. 2013; 54: 4372– 4384. [DOI] [PMC free article] [PubMed] [Google Scholar]
- 10. Kim Y-K, Ryoo N-K, Woo SJ, Park KH. . Comparison of visual and anatomical outcomes of half-fluence and half-dose photodynamic therapy in eyes with chronic central serous chorioretinopathy. Graefes Arch Clin Exp Ophthalmol. 2015; 253: 2063– 2073. [DOI] [PubMed] [Google Scholar]
- 11. Jacob J, Paques M, Krivosic V,et al. Meaning of visualizing retinal cone mosaic on adaptive optics images. Am J Ophthalmol. 2015; 159: 118– 123. [DOI] [PubMed] [Google Scholar]
- 12. Syed R, Sundquist SM, Ratnam K,et al. High-resolution images of retinal structure in patients with choroideremia. Invest Ophthalmol Vis Sci. 2013; 54: 950– 961. [DOI] [PMC free article] [PubMed] [Google Scholar]
- 13. Lima LH, Sallum JM, Spaide RF. . Outer retina analysis by optical coherence tomography in cone-rod dystrophy patients. Retina. 2013; 33: 1877– 1880. [DOI] [PubMed] [Google Scholar]
- 14. Shimozono M, Oishi A, Hata M,et al. The significance of cone outer segment tips as a prognostic factor in epiretinal membrane surgery. Am J Ophthalmol. 2012; 153: 698– 704. [DOI] [PubMed] [Google Scholar]
- 15. Jian Y, Wong K, Sarunic MV. . Graphics processing unit accelerated optical coherence tomography processing at megahertz axial scan rate and high resolution video rate volumetric rendering. J Biomed Opt. 2013; 18: 26002. [DOI] [PubMed] [Google Scholar]
- 16. Lee SH, Werner JS, Zawadzki RJ. . Improved visualization of outer retinal morphology with aberration cancelling reflective optical design for adaptive optics-optical coherence tomography. Biomed Opt Express. 2013; 4: 2508– 2517. [DOI] [PMC free article] [PubMed] [Google Scholar]
- 17. Srinivasan VJ, Monson BK, Wojtkowski M,et al. Characterization of outer retinal morphology with high-speed, ultrahigh-resolution optical coherence tomography. Invest Ophthalmol Vis Sci. 2008; 49: 1571– 1579. [DOI] [PMC free article] [PubMed] [Google Scholar]
- 18. Felberer F, Kroisamer J-S, Baumann B,et al. Adaptive optics SLO/OCT for 3D imaging of human photoreceptors in vivo. Biomed Opt Express. 2014; 5: 439– 456. [DOI] [PMC free article] [PubMed] [Google Scholar]
- 19. Curcio C, Sloan K, Kalina R, Hendrickson A. . Human photoreceptor topography. J Comp Neurol. 1990; 292: 497– 523. [DOI] [PubMed] [Google Scholar]
- 20. Liu Z, Kocaoglu OP, Turner TL, Miller DT. . Modal content of living human cone photoreceptors. Biomed Opt Express. 2015; 6: 3378– 3404. [DOI] [PMC free article] [PubMed] [Google Scholar]
- 21. Kocaoglu OP, Liu Z, Zhang F, Kurokawa K, Jonnal RS, Miller DT. . Photoreceptor disc shedding in the living human eye. Biomed Opt Express. 2016; 7: 4554– 4568. [DOI] [PMC free article] [PubMed] [Google Scholar]
- 22. Sidman RL. . The structure and concentration of solids in photoreceptor cells studied by refractometry and interference microscopy. J Biophys Biochem Cytol. 1957; 3: 15– 30. [DOI] [PMC free article] [PubMed] [Google Scholar]
- 23. Snyder A. . Stiles-Crawford effect-explanation and consequences. Vision Res. 1972; 13: 1115– 1137. [DOI] [PubMed] [Google Scholar]
- 24. Tobey F, Enoch JM, Scandrett JH. . Experimentally determined optical properties of goldfish cones and rods. Invest Ophthalmol Vis Sci. 1975; 14: 7– 23. [PubMed] [Google Scholar]
- 25. Zhang P, Zawadzki RJ, Goswami M,et al. In vivo optophysiology reveals that g-protein activation triggers osmotic swelling and increased light scattering of rod photoreceptors. Proc Nat Acad Sci U S A. 2017; 114: E2937– E2946. [DOI] [PMC free article] [PubMed] [Google Scholar]
- 26. Jonnal RS, Kocaoglu OP, Wang Q, Lee S, Miller DT. . Phase-sensitive imaging of the outer retina using optical coherence tomography and adaptive optics. Biomed Opt Express. 2012; 3: 104– 124. [DOI] [PMC free article] [PubMed] [Google Scholar]
- 27. Jonnal RS, Rha J, Zhang Y, Cense B, Gao W, Miller DT. . In vivo functional imaging of human cone photoreceptors. Opt Express. 2007; 15: 16141– 16160. [DOI] [PMC free article] [PubMed] [Google Scholar]
- 28. Jonnal RS, Besecker JR, Derby JC,et al. Imaging outer segment renewal in living human cone photoreceptors. Opt Express. 2010; 18: 5257– 5270. [DOI] [PMC free article] [PubMed] [Google Scholar]
- 29. Hillmann D, Spahr H, Pfäffle C, Sudkamp H, Franke G, Hüttmann G. . In vivo optical imaging of physiological responses to photostimulation in human photoreceptors. Proc Natl Acad Sci U S A. 2016; 113: 13138– 13143. [DOI] [PMC free article] [PubMed] [Google Scholar]
- 30. Gao W, Cense B, Zhang Y, Jonnal RS, Miller DT. . Measuring retinal contributions to the optical Stiles-Crawford effect with optical coherence tomography. Opt Express. 2008; 16: 6486– 6501. [DOI] [PMC free article] [PubMed] [Google Scholar]
- 31. Ross MH, Kaye GI, Pawlina W. . Histology: A Text and Atlas. 4th ed. Philadelphia, PA: Lippincott Williams & Wilkins; 2003. [Google Scholar]


