

Abstract
Wildland-Urban Interface (WUI) fires have become a problem of great concern across multiple continents. An important mechanism of structure ignition in WUI fires and urban fires is the production of firebrands. During WUI fires, decking assemblies have been observed to be an ignition vulnerability based on post-fire damage surveys conducted by NIST and elsewhere. The authors have conducted scoping experiments and demonstrated the dangers of the dynamic process of continual, wind-driven firebrand showers landing on decking assemblies for wind speeds of 6 m/s. In this study, eight full-scale experiments were conducted with wood decking assemblies under a wind speed of 8 m/s. The basis for these new investigations was twofold: observe possible vulnerabilities of wood decking assemblies to continuous, wind-driven firebrands at higher wind speed as firebrand accumulation patterns were expected to be influenced by wind speed, and examine if wall ignition occurred due to the burning decking assembly. To this end, sections of wood decking assemblies (1.2 m by 1.2 m) were constructed and attached to a reentrant corner assembly. The deck/reentrant corner assembly was then exposed to continuous, wind-driven firebrand bombardment generated by a full-scale Continuous Feed Firebrand Generator installed in the Fire Research Wind Tunnel Facility (FRWTF) at the Building Research Institute (BRI) in Japan. The mass of firebrands required for flaming ignitions under a wind speed of 8 m/s was considerably less compared with those under a wind speed of 6 m/s. This result is postulated to be due to higher firebrand surface temperatures as the wind speed was increased. For the decking assembly to wall ignition studies, the interface between the decking assembly and the wall appeared to be a weak point; this is not addressed in the current test methods.
INTRODUCTION
Large outdoor fires, such as Wildland-Urban Interface (WUI) fires in USA, bushfires in Australia, and urban fires in Japan are a major concern. In particular, structure ignitions are a major problem. An important factor for structure ignitions in large outdoor fires is acceleration of fire spread caused by firebrands produced from burning structures [1].
In large outdoor fires, decking assemblies have been observed to be an ignition vulnerability based on post-fire damage surveys conducted by the National Institute of Standards and Technology (NIST), the Insurance Institute for Business & Home Safety (IBHS), and the Commonwealth Scientific and Industrial Research Organization (CSIRO) [2–4]. Recently, the use of decking assemblies has also become more popular in Japan.
The Office of the State Fire Marshal (OFSM) in California adopted the test method known as State Fire Marshal (SFM) STANDARD 12-7A-4 [5]. The SFM test method is intended to determine the response of decks to firebrand exposure and is similar to ASTM E2726 [6], and was proposed at a time when WUI fire science was in its infancy. Both of those test methods are extensions of the ASTM E108 roof test [7]. A firebrand is simulated by placing a burning wood crib on top of a section of a decking assembly under an air flow. The dynamic process of multiple firebrands bombarding decking materials as a function of time is not adequately represented or simulated in this standard. Based on firebrand attack from real WUI fires, it is expected that multiple firebrands would deposit within gaps/crevices between or on deck boards. In addition to not simulating a dynamic firebrand attack, the California and ASTM test methods do not fully consider possible differences between the size and mass of firebrands produced from burning vegetation and structures. As WUI fire science has developed further, the limitations of this test method have received increased attention.
Most recently, Hasburgh et al., [8] conducted preliminary experiments to determine wall ignition vulnerabilities exposed to burning decking assemblies. In their experiments, the decking assemblies were 609 mm by 711 mm, and these were attached to a wall fitted with heat flux gages and thermocouples. Two ignition sources were considered: a below deck flame exposure using a propane burner, and an above deck test using a Class A burning brand (largest), both taken from the SFM test method above. For the Class A firebrand ignition experiments, the experimental data showed that wind speeds of 2.9 m/s and 5.4 m/s had the highest temperature and heat flux on the wall from the burning decking assembly. Hasburgh et al., [8] suggested that test methods developed in their paper and the data obtained can be used to gain insight into how a burning wood deck contributes to structural ignition. However, as pointed out by the authors, a great deal of work remains to be done, as the number of experiments were limited [8].
The authors conducted experiments and demonstrated the dangers of the dynamic process of continual, wind-driven firebrand showers landing onto wood decking assemblies [9]. The accumulation of glowing firebrands resulted in flaming ignition of the deck boards. It was also observed that ignition of the deck boards produced smoldering ignition in the supporting members under the decking assembly. In that work, the wind speed was limited to 6 m/s (to compare to existing test methods already discussed). These experiments were the first to investigate wood decking vulnerabilities to wind-driven firebrand showers with firebrand size and mass distribution linked to those determined from burning vegetation and an actual WUI fire [9].
In this study, a series of experiments were conducted with similar wood decking assemblies under a wind speed of 8 m/s, a higher wind speed than the previous study. The reason for this is to examine possible vulnerabilities of wood decking assemblies to continuous, wind-driven firebrands under higher wind speed as firebrand accumulation patterns were expected to be influenced by wind speed. As described in detail below, as wind speeds were increased from 6 m/s to 8 m/s, a transition in firebrand accumulation patterns has been observed for firebrand flow in front of walls. Another purpose was to examine the possibility of deck to wall ignition, as prior experiments did not consider this aspect. An important aspect of the work presented here is that the decking assemblies coupled to reentrant corner assemblies are realistic scales, and the firebrand sizes were predicated on results measured from burning vegetation and actual WUI fires. Some details of these experiments were presented at a recent conference [10], but this paper presents these experimental results for the peer-reviewed literature in depth.
EXPERIMENTAL DESCRIPTION
Full-Scale Experiments at the Fire Research Wind Tunnel Facility (FRWTF)
Comprehensive findings from the full-scale decking assembly experiments conducted at 6 m/s are described elsewhere [9]. As the experimental protocols for firebrand generation were the same in the prior work when conducting experiments here at 8 m/s (again done intentionally by design to compare results at various wind speeds), these details are repeated here for completeness.
The experiments made use of a full-scale Continuous Feed Firebrand Generator [9]. This version of the device is modified from the NIST Dragon and consists of two parts, the main body (essentially the same as prior investigations; Dragon component), and continuous feeding component (see Figure 1). A blower, to provide airflow, was connected to the main body, with more details of the blower described below [9]. To produce firebrands required a feeding system to meter in specific amounts of wood pieces. The feeding system consisted of a pneumatic cylinder coupled to a cylindrical container where the unburned wood pieces were stored. Details of the feeding system are presented elsewhere [9]. For all experiments, Douglas-fir wood pieces machined to dimensions of 7.9 mm (H) by 7.9 mm (W) by 12.7 mm (L) were used to produce firebrands. The same-size wood pieces have been shown to be commensurate with sizes measured from full-scale burning trees, as well size distributions obtained from actual WUI fires [9].
Figure 1.

Schematic of full-scale continuous feed firebrand generator. This version of the device is designed to generate firebrand showers using Douglas-fir wood pieces.
The blower speed was selected to generate firebrands with the desired combustion characteristics (3.0 m/s airflow). For blower velocities greater than 3.0 m/s, many firebrands produced were in a state of flaming combustion, as compared to glowing combustion. It is possible for firebrands to remain in a flaming state under an air flow, and it is reasonable to assume that some firebrands may still be in a state of flaming combustion upon impact. Nevertheless, glowing firebrands were used in this study to simulate long-range spotting. Spotting refers to new fires initiated by firebrands traveling over long distances, as is observed from vegetative firebrands attacking structures in WUI fires [2–4]. While glowing firebrands were the focus of this study, due to the design on the firebrand generator, flaming firebrands could also be generated as part of future studies [9].
The experimental device was installed inside the test section of BRI’s FRWTF. The facility was equipped with a 4.0 m diameter fan to produce the wind field, up to 10 m/s (± 10 %). The wind speed was verified using a vertical, 21-point hot wire anemometer array. The measurement location closest to the ground had the highest variation, so the uncertainty of 10 % considers all the measurement points. The cross section of the FRWTF is 5.0 m wide by 4.0 m high. A parametric study was conducted to determine the influence of various conditions for the firebrands to arrive at the deck location [9]. As a result of these scoping investigations, the reentrant corner was placed at a distance of 3.25 m downstream of the full-scale Continuous Feed Firebrand Generator. The dimensions of the reentrant corner assembly were 1.2 m wide by 2.1 m high on each side. The walls of the reentrant corner were lined with gypsum board since a majority of these experiments were focused on deck assembly ignition, not the ignition of the wall assembly itself.
Each of the decking assemblies was installed inside the reentrant corner assembly at the base (ground level). In all experiments, the decking assemblies were 1.2 m by 1.2 m. Three different types of wood decking boards were used: Western Red Cedar, Douglas-fir, and Redwood, as these are very common wood decking types used [11]. The actual dimensions of all decks boards were: 25.4 mm thick by 137 mm wide (Cedar), 25.4 mm thick by 139 mm wide (Douglas-fir); 25.4 mm thick by 137 mm wide (Redwood). Other decking boards of varying thicknesses are commercially available, but these board thicknesses were chosen to develop a database of various decking assembly performance. The spacing of the decks boards was 5 mm [9,11]. The boards were installed using a wood supporting frame (boards were 38 mm thick by 140 mm height) with members spaced 406 mm on center. Figure 2 displays the orientation of the decking boards for all experiments.
Figure 2.

Orientation of deck boards with respect to the direction of the firebrand-laden flow. Note that this drawing is for illustration purposes and is not intended to reflect the total number of deck boards used per experiment or the actual dimensions of the decking assembly itself [9].
The following procedures were completed for each experiment. The deck assembly was fitted inside the reentrant corner. The wind tunnel speed was set to the desired level (e.g. 6 m/s or 8 m/s). Wood pieces were loaded into the cylinder storage container and the air compressor needed to provide compressed air for the pneumatic cylinder and gate system was switched on (air compressor pressure was set to 0.7 MPa). The blower was set at 3.0 m/s, and two propane burners were ignited and inserted into the side of the device. The propane burners were operated continuously during the experiment. The pneumatic piston was then activated and the sliding rod was positioned to allow wood pieces to enter the volume in the metal sleeve. The sliding rod was moved to push the wood pieces (200 g) to the first gate. The gate was opened, closed, and the second gate was then opened, and the wood fell into the main body (Dragon). The feeding was initially varied to determine the optimal conditions for continuous firebrand showers. It was observed that 200 g, inserted every 15 s (800 g/min), provided an adequate firebrand generation rate to ignite building materials [9].
The number flux (number of firebrand generated/m2s), exiting the outlet duct, was measured at a feed rate of 800 g/min. To determine the number flux, the number of firebrands was counted at every frame of the video recording (side view camera). Based on the analysis, the number flux reached a steady value of 340/m2s ± 10 %. Mass flux data (mass of firebrands generated/m2s) were calculated by multiplying the number flux and the average mass of each firebrand. To measure the firebrand mass, another set of experiments was conducted using a series of water pans placed downstream of the NIST full-scale Continuous Feed Firebrand Generator. Water pans were required to quench combustion of the firebrands. Without water pans, the firebrands would continue to burn and by the time collection was completed; only ash would remain. After the experiment was finished, the pans were collected, and the firebrands were filtered from the water, using a series of fine-mesh filters. As in previous work, the mass versus drying time was monitored to determine the duration need to completely dry the firebrands. The mass was measured using a precision balance. The mean mass and standard deviation of the firebrands were 0.05 g ± 0.02 g. Therefore, the mass flux of generated firebrands was calculated to be 17 g/m2s ± 10 %.
Firebrand sizes using this device fed with Douglas-fir wood pieces have been linked with those from actual burning vegetation and actual WUI fires [12]. Specifically, firebrand sizes produced using this device were similar with the characteristics of firebrand exposure at a single location during a severe WUI fire in California [12]. This is important since empirical characterization of firebrand exposure is extremely limited, especially with respect to firebrand size distributions during actual WUI fire conditions. Consistently small sizes of windblown firebrands, similar to those generated using this device, were observed by data collection adjacent to a home that survived severe interface fire exposure [12]. This is in contrast with the size of firebrands referenced in existing test standards [5–7] and wildfire protection building construction recommendations.
The authors have also redesigned the continuous firebrand feeding component described here to produce firebrands with size and mass distributions more similar to those measured from burning structures (nearly double the average projected area to the firebrands generated here). The interested reader is referred elsewhere for a comprehensive discussion of this redesigned device capable of generating firebrand showers similar to burning structures, as well as the structure firebrand database in development by the authors [13].
RESULTS
Prior Work at 6 m/s
As the detailed results for experiments for 6 m/s were presented elsewhere, only a summary is provided here; see Manzello and Suzuki [9] for more details. For all three wood deck types considered, smoldering was observed to transition to flaming. Figure 3 displays flaming ignition for Cedar, Douglas-fir, and Redwood, respectively. These experiments clearly demonstrated that it was the accumulation of firebrands that pose an ignition danger. Specifically, accumulated firebrands produced self-sustaining smoldering ignition of the deck boards, that eventually transitioned to flaming ignition.
Figure 3.

Flaming ignition of Cedar, Douglas-fir, and Redwood decking assemblies at 6 m/s [9].
It was not possible to determine the time for the exact onset of smoldering ignition. This was because the board gaps were eventually covered with firebrands (Figure 3). However, intense smoke generation, an indication of smoldering ignition, was observed. Therefore, the time to reach flaming ignition was determined for each wood type. The time was defined as the time sustained flaming was observed on the deck surface less the time the first firebrand landed on the deck surface. The time to reach flaming ignition was the longest, on average, for the Douglas-fir decking assemblies. Firebrand generation was continued until sustained flaming ignition was observed. Table 1 provides a summary of all results.
TABLE 1.
Summary of mass of firebrands required for flaming ignition, moisture content, and ignition location, for experiments at 6 m/s and 8 m/s. Note that T1 and T2 refer to Test 1 and Test 2, respectively. The moisture content (dry basis) of the deck boards, determined by oven drying at 104 °C, was determined for all experiments. The moisture content (± 10 %) was similar for all wood decking assemblies tested.
| Wood Type | Density [kg/m3] | 6 m/s | |||||
|---|---|---|---|---|---|---|---|
| Test 1 | Test 2 | ||||||
| Mass of firebrands required for FI [g] | MC [%] | Location of FI | Mass of firebrands required for FI [g] | MC [%] | Location of FI | ||
| Cedar | 361 | 120 | 11.6 | front | 89 | 11.3 | front |
| Redwood | 437 | 85 | 11.2 | front | 278 | 9.8 | front |
| Douglas-fir | 534 | 283 | 8.8 | front | 165 | 10.8 | front |
| Wood Type | Density [kg/m3] | 8 m/s | |||||
| Test 1 | Test 2 | ||||||
| Mass of firebrands required for FI [g] | MC [%] | Location of FI | Mass of firebrands required for FI [g] | MC [%] | Location of FI | ||
| Cedar | 361 | 9.4 | 11.7 | corner | 8.7 | 11.7 | corner |
| Redwood | 437 | 9.1 | 12.2 | corner | 10 | 12.2 | front |
| Douglas-fir | 534 | 7.5 | 12.7 | corner | 24.1 | 12.6 | corner |
As discussed earlier, the total number/mass flux of firebrands generated from the full-scale Continuous Feed Firebrand Generator was determined. However, all the generated firebrands that depart the exit duct of the main component (Dragon) did not land on the surface of the deck. The total number of firebrands arriving on the surface of the deck was determined from image analysis of video records to estimate the number and thus mass required for ignition. The results of these analyses are shown in Figure 4.
Figure 4.
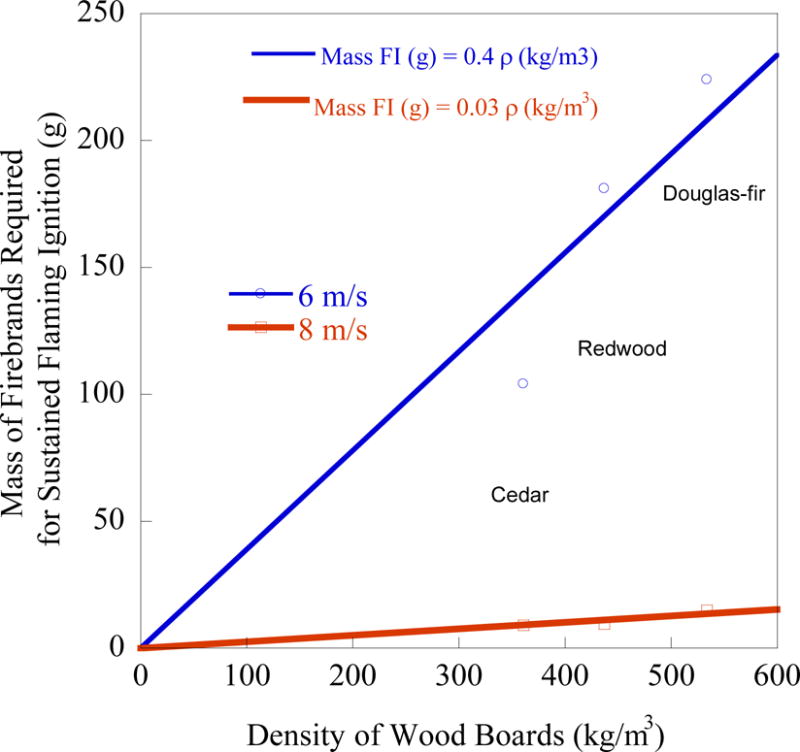
Firebrand mass required for sustained flaming ignition as a function of wind speed. The 6 m/s data is taken from [9]. The average moisture content (MC) of all three wood decking types was 12 % (dry basis) for data at 8 m/s; the average MC was 11 % for all three wood types at 6 m/s [9]. Correlations are proposed for mass required for sustained flaming ignition of deck boards.
Finally, the ignition of deck boards also began to produce smoldering ignition in the supporting members under the decking assembly. Figure 5 shows the underside of the Cedar decking assembly (overall view and detail of one of the sections). Even long after the experiments were completed, sustained smoldering ignition was occurring in the supporting members. This provides direct confirmation of what has been observed in post-fire studies. Specifically, burning decking assemblies are extinguished by the fire service and these assemblies have been observed to re-ignite once again requiring additional suppression, or without suppression, resulting in the loss of the home in the WUI [4].
Figure 5.

(a) Picture of the underside of the decking assembly (Cedar); overall view. (b) Detail of the underside of the decking assembly (Cedar). The ignition process spread to the wood supporting members [9].
Wind Speeds of 8 m/s
The mass of firebrands as a function of projected area was determined for the firebrand showers directed at the decking assemblies and is shown in Figure 6a. As the mass versus the projected area of the generated firebrands were similar for 6 m/s and 8 m/s, all the data were plotted to together, with a simple curve fit applied (Figure 6b). Overall, it was observed that less firebrands accumulated on the surface of decking assemblies under a wind speed of 8 m/s than 6 m/s. Firebrands were observed to accumulate around the corner of deck/reentrant corner assemblies (see Figure 7–9; 8 m/s results), while firebrands accumulated around the front under a wind speed of 6 m/s, and this resulted in flaming ignition of the decking boards. Ignitions occurred near the corner in 5 out of 6 experiments while in one case firebrands caused ignition near the front of the decking assembly. Figures 7–9 shows the severity of ignition on the assemblies. The supporting joists, as well as deck boards, were also ignited. Firebrands that accumulated between the gaps caused ignitions. Figure 10 displays a schematic to better grasp the differences in the accumulated firebrand location zones for the different wind speeds. Note that accumulation zones are not intended to represent actual areas, but to simply show locations where firebrands accumulated for the different wind speeds.
Figure 6.


a Mass of firebrands as a function of projected area that were directed at the decking assemblies for wind speeds of 6 m/s and 8 m/s. b The data were similar under 6 m/s and 8 m/s, and a curve fir was applied.
Figure 7.

Cedar decking assembly ignition by firebrand showers at 8 m/s. Note that the circles denote the same ignition locations.
Figure 9.

Douglas-fir decking assembly ignition by firebrand showers at 8 m/s. Note that the circles denote the same ignition locations.
Figure 10.

Differences in the accumulated firebrand location zones for 6 m/s and 8 m./s wind speeds. The most firebrand accumulation was observed in Area 1 (6 m/s), as compared to when the wind speed was increased, Area 2 (8 m/s). Note that accumulation zones are not intended to represent actual areas, but to simply show locations where firebrands accumulated.
The mass of firebrands required to reach flaming ignition was calculated as well for 8 m/s, and is shown in Figure 4. Based on the calculation, approximately 7 g to 25 g of firebrands were required to cause flaming ignition on deck boards under a wind speed of 8 m/s. Results were also compared with the data with 6 m/s; see Table 1 [9]. Less than 10 % of the mass of firebrands were required to cause flaming ignition of decking assemblies under a wind speed of 8 m/s than 6 m/s. The highest wood density resulted in the largest mass required for flaming ignition, as was observed for wind speeds of 6 m/s as well.
Ignited Decking Assembly Resulting in Wall Ignition at 8 m/s
Two experiments were performed to examine the possibility of the deck to wall ignition. The same deck/reentrant corner assembly configuration, lined with one layer of gypsum board, was used for the first experiment. After the decking assembly was ignited by firebrand showers, combustion on the deck boards was allowed to continue. Fire spread through the assembly was observed even though the wall was protected by gypsum boards all the way down to the ground (see Figure 11). Future experiments will quantify this heat flux.
Figure 11.
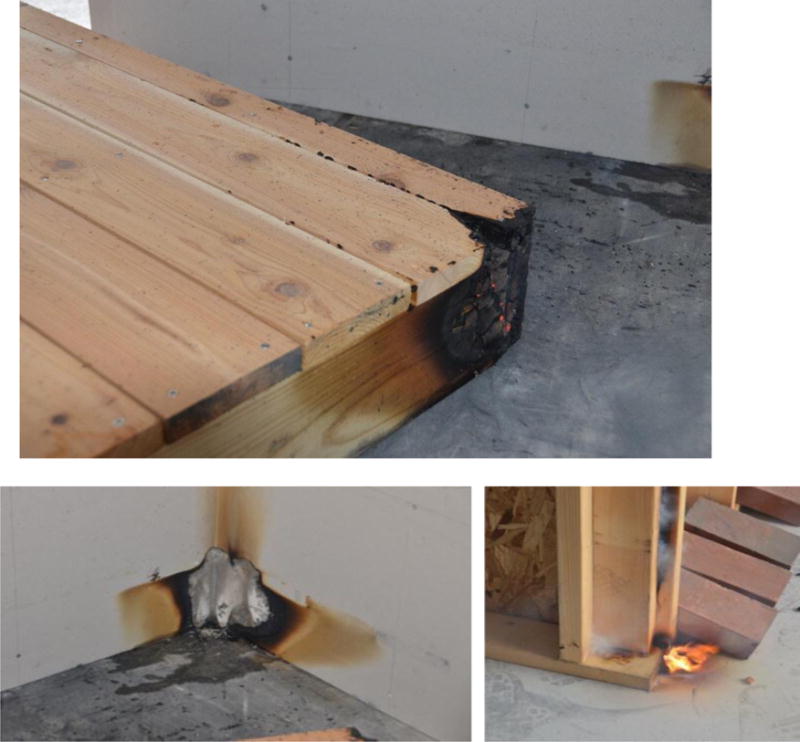
Once ignition occurred, the cedar decking assembly was allowed to combust until flame spread was observed through the re-entrant corner. In this experiment, the wall as lined with gypsum board.
A second experiment was conducted to show the influence of bare un-protected oriented strand board (OSB) placed adjacent to a cedar decking assembly (see Figure 12). The firebrands ignited the decking assembly as well as the OSB. The purpose of this experiment was to simply show a situation where a decking assembly is located next to unprotected wall assembly.
Figure 12.

Once ignition occurred, the cedar decking assembly was allowed to combust until flame spread was observed through the re-entrant corner. In this experiment, the wall was not lined with gypsum board (bare OSB).
DISCUSSION
In these experiments, firebrand showers were observed to ignite the surface of the decking assemblies in the absence of other combustibles located on the surface of the deck. In this work, it was useful to determine if ignition was even possible under such conditions, so no combustible materials, such as leaf litter or lawn furniture, were placed on the decking assembly surface. In post-fire investigations, it has been suggested that if combustibles are located on the decking assembly surface, ignition by firebrand showers may be even easier [2–4].
Another interesting observation was that as the wind speed was increased, fewer firebrands accumulated on the decking assembly surface. This result was qualitatively similar to prior work where firebrand accumulation patterns were measured in front of walls under various wind speeds [14]. In that work, it was observed that fewer firebrands accumulated as the wind speed was increased from 4 m/s to 10 m/s. In each of these studies, the same continuous-feed firebrand generator was used and was fed with the same wood pieces to generate similar firebrand size and mass distributions. This was done intentionally to enable a direct comparison. While firebrand accumulation patterns are dependent on several parameters in actual WUI fires, future studies should consider exposing assemblies to disparate firebrand size/mass distributions as well as higher wind speeds. Present work suggests it may be more difficult for firebrands to accumulate on decking assembly surface for wind speeds higher than 10 m/s.
A simple explanation may be related to the Tachikawa number of the firebrands. Here, the firebrand Tachikawa number is defined as:
| (Equation 1) |
where ρair is the density of air, ρFB firebrand density, U is wind speed, g is gravitation acceleration, and LFB is the characteristic length of a given firebrand. The Tachikawa number is the ratio of aerodynamic forces to gravitational forces, and has been used to describe the trajectories of various wind-blown debris types [15]. For the purposes of this present study, firebrand flows may be assumed to be similar to wind-blown debris. Based on the analysis presented in Figure 6b, the firebrand characteristic length, related to project area, was similar for both wind speeds, and firebrand densities were also not different. Therefore, as the wind speed was increased from 6 m/s to 8 m/s, the ratio of firebrand Tachikawa number, TAFB, was nearly two times larger (TAFB 8 m/s ~ 1.8TAFB 6m/s). This simplistic analysis suggests that even small increases in wind speed, result in far larger aerodynamic forces on firebrands, making it harder for them to accumulate.
It was observed that less than 10 % of mass of firebrands were required to cause flaming ignition of decking assemblies under a wind speed of 8 m/s, as compared to 6 m/s. This result is postulated to be due to higher firebrand surface temperatures as the wind speed was increased, since the sizes of generated firebrands were similar at 6 m/s and 8 m/s (see Figure 6ab). It is important to consider the heat and mass transfer processes that take place at the gap between the deck boards in contact with glowing firebrands. The deposited firebrands heat up the surface, resulting in the production of pyrolysates. Flammable air/fuel mixtures are formed above the gaps between the deck boards. Continued heat supplied from the firebrands contributes to exothermic gas-phase reaction, leading to ignition. The heat and mass transfer process that occur for a firebrand in contact with wood decking boards are shown in Figure 13. The net heat flux q″net to the deck board from the accumulated firebrands is given as:
| (Equation 2) |
where q″FB, the heat flux from the firebrands, q″conv, the convective heat flux, q″rad, the radiative heat flux, , the mass loss rate per unit area, and Lv, the heat of gasification of a given wood decking board.
Figure 13.

Heat and mass transfer processes that take place at the deck board in contact with a glowing firebrand.
Manzello et al. [16] quantitatively showed that glowing firebrand surface temperature increased as the wind speed was increased (see Figure 14 taken from [16]). In that work, the surface temperature of charred area on the glowing firebrand was simultaneously measured using both the thermocouple and the infrared camera in a quiescent environment [16]. The glowing, charred, area close to the thermocouple bead was imaged using the infrared camera and the emissivity was then adjusted until the temperature readings on the infrared camera converged to those registered by the thermocouple measurements. Temperatures measured by the infrared camera approached those measured by the thermocouple as the emissivity set on the camera was reduced from 0.7 to 0.6. Based on these experimental results, the emissivity of the glowing firebrands was set to 0.6 [16]. As may be seen, the firebrand temperatures are quite sensitive to airflow. Therefore, larger firebrand temperatures were expected as the wind speed was increased from 6 m/s to 8 m/s.
Figure 14.

IR images of the glowing firebrand exposed to two different air flows [16].
Finally, two correlations were proposed to determine the mass of glowing firebrands to produce flaming ignition in wood deck boards for two different wind speeds. It will be useful to evaluate these correlations, shown as curve fits in Figure 4, using other firebrand size and mass distributions across various wind speeds.
SUMMARY
As part of the first objective of this study, a series of experiments with decking assemblies exposed to continuous firebrand showers under a wind speed of 8 m/s were performed to observe their vulnerability to firebrands. Firebrands accumulated around the corner of the assemblies and caused flaming ignitions. The mass of firebrands required for flaming ignitions under a wind speed of 8 m/s were considerably less compared with those under a wind speed of 6 m/s. This result was postulated to be due to higher firebrand surface temperatures as wind speed increased.
As part of the second objective of this study, two experiments were performed to examine the possibility of the deck to wall ignition. The same deck/reentrant corner assembly configuration, lined with one layer of gypsum board, was used for the first experiment. After the decking assembly was ignited by firebrand showers, combustion on the deck boards was allowed to continue. Fire spread through the assembly was observed even though the wall was protected by gypsum panels. A second experiment was conducted to show the influence of bare (un-protected OSB) placed adjacent to a cedar decking assembly. The firebrands ignited the decking assembly as well as the OSB. The purpose of this experiment was to simply show a situation where a decking assembly is located next to an unprotected wall assembly.
In these experiments, firebrand showers ignited the surface of the decking assemblies in the absence of other combustibles located on the surface of the deck. In post-fire investigations, it has been suggested that if combustibles were located on the decking assembly surface, ignition by firebrand showers may be even easier.
It also important to recognize that the current decking test methods were proposed based on the best information at the time of development. As additional understanding of firebrand ignition of structures is developed through experiments and incident reconstructions [17], current testing methods and standards can be improved by incorporating this new data and science. The results of this study are consistent with the interface between the decking and wall assembly being a vulnerability which may not be adequately captured in existing test methodologies and standards. Additional wood types, as well as composite deck boards will be considered, as a comprehensive database of decking assembly performance under firebrand exposure is being developed.
Figure 8.

Redwood decking assembly ignition by firebrand showers at 8 m/s. Note that the circles denote the same ignition locations.
Acknowledgments
This work was partly supported by JSPS Grant-in-Aid for Young Researchers (B) Grant Number 26750128. The help of Mr. Marco G. Fernandez of EL-NIST greatly appreciated. SLM acknowledges the support of the Building Research Institute (Japan) for use of their Fire Research Wind Tunnel Facility (FRWTF). The authors would like to acknowledge the careful, detailed reviews provided on this manuscript.
Contributor Information
Samuel L. Manzello, Fire Research Division, National Institute of Standards and Technology (NIST), Gaithersburg, MD USA
Sayaka Suzuki, Large Fire Laboratory, National Research Institute of Fire and Disaster (NRIFD), Chofu, Tokyo, Japan.
References
- 1.Manzello SL, et al. Workshop for Fire Structure Interaction and Urban and Wildland Urban Interface (WUI) Fires – Operation Tomodachi Fire Research. Fire Safety Journal. 2013;59:122–131. [Google Scholar]
- 2.Maranghides A, et al. A Case Study of a Community Affected by the Waldo Fire – Event Timeline and Defensive Actions. 2015. (NIST TN1910). [Google Scholar]
- 3.Quarles SL, et al. Lessons learned from Waldo Canyon: Fire Adapted Communities Mitigation Assessment Team Findings. Insurance Institute for Business & Home Safety; 2013. [Google Scholar]
- 4.Blanchi R, Leonard J. Property Safety – Judging Structural Safety (Chapter 7) In: Handmer J, Haynes K, editors. Community Bushfire Safety. CSIRO Press; 2008. [Google Scholar]
- 5.Materials and Construction Methods for Exterior Wildfire Exposure. 2016. (California Building Standards Code). Chapter 7A. [Google Scholar]
- 6.ASTM E2726. ASTM International; West Conshohocken, PA: 2012. [Google Scholar]
- 7.ASTM E108. ASTM International; West Conshohocken, PA: 2003. [Google Scholar]
- 8.Hasburgh L, et al. Laboratory Investigation of Fire Transfer from Exterior Wood Decks to Buildings in the Wildland–Urban Interface. Fire Technology. 2017;53:517–534. [Google Scholar]
- 9.Manzello SL, Suzuki S. Exposing Decking Assemblies to Continuous Wind-Driven Firebrand Showers. Fire Safety Science. 2014;11:1339–1352. doi: 10.3801/IAFSS.FSS.11-1339. [DOI] [Google Scholar]
- 10.Suzuki S, Manzello SL. Experimental Investigation of Wood Decking Assemblies Attacked by Firebrand Showers. INTERFLAM; 2016. [DOI] [PMC free article] [PubMed] [Google Scholar]
- 11.Manzello SL, Suzuki S. Summary of the 2011 Workshop on Research Needs for Full Scale Testing to Determine Vulnerabilities of Decking Assemblies to Ignition by Firebrand Showers. 2011. (NIST SP 1129). [Google Scholar]
- 12.Manzello SL, Foote EID. Characterizing Firebrand Exposure from Wildland-Urban Interface (WUI) Fires: Results from the 2007 Angora Fire. Fire Technology. 2014;50:105–124. [Google Scholar]
- 13.Manzello SL, Suzuki S. Generating Wind-Driven Firebrand Showers Characteristic of Burning Structures. Proc Comb Inst. 2017;36:3247–3252. doi: 10.1016/j.proci.2016.07.009. [DOI] [PMC free article] [PubMed] [Google Scholar]
- 14.Manzello SL, Suzuki S. Firebrand Accumulation Zones in Front of Structures in Wildland-Urban Interface (WUI) Fires; San Francisco, CA. 2015. [Google Scholar]
- 15.Holmes J, Baker C, Tamura Y. Tachikawa Number: A Proposal. Journal of Wind Engineering and Industrial Aerodynamics. 2006;94:41–47. [Google Scholar]
- 16.Manzello SL, et al. Investigation on the Ability of Glowing Firebrands Deposited Within Crevices to Ignite Common Building Materials. Fire Safety Journal. 2009;44:894–900. [Google Scholar]
- 17.Manzello SL, Quarles SL. Special Section on Structure Ignition in Wildland-Urban Interface (WUI) Fires. Fire Technology. 2017;53:425–427. doi: 10.1007/s10694-016-0639-6. [DOI] [PMC free article] [PubMed] [Google Scholar]