

Summary
The lateral ventricle subventricular zone (SVZ) is a frequent and consequential site of pediatric and adult glioma spread, but the cellular and molecular mechanisms mediating this are poorly understood. We demonstrate that neural precursor cell (NPC):glioma cell communication underpins this propensity of glioma to colonize the SVZ through secretion of chemoattractant signals toward which glioma cells home. Biochemical, proteomic, and functional analyses of SVZ NPC-secreted factors revealed the neurite outgrowth-promoting factor pleiotrophin, along with required binding partners SPARC/SPARCL1 and HSP90B, as key mediators of this chemoattractant effect. Pleiotrophin expression is strongly enriched in the SVZ, and pleiotrophin knockdown starkly reduced glioma invasion of the SVZ in the murine brain. Pleiotrophin, in complex with the binding partners, activated glioma Rho/ROCK signaling, and ROCK inhibition decreased invasion toward SVZ NPC-secreted factors. These findings demonstrate a pathogenic role for NPC:glioma interactions and potential therapeutic targets to limit glioma invasion.
In-brief
The chemoattractant effect exerted by neural precursor cell-derived pleiotrophin underlies the preference of high-grade glioma to invade the lateral ventricle subventricular zone, providing potential targets for therapeutic development against glioma invasion.
Introduction
High-grade gliomas (HGGs) are a diffusely infiltrating group of cancers with dire prognoses. The lateral ventricle subventricular zone (SVZ) stem cell niche is thought to be a tumor reservoir for a range of HGGs including adult glioblastoma (GBM). Glioma contact of neural stem cell niches, particularly the SVZ, has been closely associated with decreased survival (Chaichana et al., 2008; Jafri et al., 2013; Mistry et al., 2017a, 2017b) and increased tumor recurrence (Adeberg et al., 2014; Chen et al., 2015). Diffuse intrinsic pontine glioma (DIPG; recently re-classified as diffuse midline glioma, H3K27M mutant (Louis et al., 2016)) is the most common HGG of childhood and the leading cause of pediatric brain tumor-related death, with a median survival of only 9 months and a 5-year survival of less than 1% (Donaldson et al., 2006). DIPG tends to not only infiltrate the brainstem where it originates, but also spreads distantly to the lateral ventricle SVZ in ~65% of cases (Caretti et al., 2014). A point of debate regarding SVZ involvement in adult GBM has been whether gliomas spread to the SVZ or the cancer originates there. In DIPG, the tumor clearly begins in the pons and from some anatomical distance spreads to the SVZ, clarifying the propensity of HGGs to travel to the SVZ niche. DIPG is thus an illustrative tumor type in which to discern the mechanisms of SVZ invasion that may be broadly relevant to HGGs. In the present study, we sought to understand how and why DIPG and other HGGs spread so frequently to the SVZ, hypothesizing that this predilection could be mediated by interactions between the glioma cells and the neural precursor cells (NPCs) that normally reside in the SVZ (Sanai et al., 2004).
Results
SVZ-derived DIPG cells recapitulate invasion pattern in an orthotopic xenograft model
We had the opportunity to culture DIPG at the time of early postmortem autopsy from tumor in the pons and tumor in the SVZ (cultures designated SU-DIPG-XIII pons and SU-DIPG-XIII frontal lobe, also referred to as SVZ DIPG cells; Figure 1A; please see Figures S1A–D for genomic and gene expression characterizations of both cultures). In this case, the pontine tumor had been treated with radiation therapy while the SVZ metastases were treatment-naive. While tumor spread to the lateral ventricle SVZ is frequent (Figures 1B–C, Figures S1E–H), a culture of DIPG cells from an SVZ site of spread has not previously been established and provides a rare and valuable resource. Pontine and SVZ DIPG cells were transduced to express GFP and luciferase and subsequently orthotopically xenografted into the pons of juvenile immunodeficient (NOD-SCID-IL2R γ-chain-deficient; NSG) mice. Bioluminescent imaging (IVIS) indicated that SVZ DIPG cells invaded supratentorially to the cerebrum (Figure 1D), while the pontine DIPG cells from this case remained localized primarily to the hindbrain (Figure S1I). The ability of the SVZ DIPG cells to invade widely may be due to higher expression of genes involved in extracellular matrix degradation, including matrix metalloproteinases and ADAM metallopeptidases (Figures S1C–D). Histological analyses showed a diffusely infiltrating pattern of spread of SVZ DIPG cells that consistently demonstrated spread into the mouse SVZ (Figure 1E), with glioma cells in close proximity to the SVZ NPCs within the stem cell niche (Figure 1F). Spread of SVZ DIPG cells throughout the brain increased over time, with 100% of mice exhibiting widespread tumor and infiltration of the SVZ by 16 weeks post-xenograft (Figure 1G). This mouse model of SVZ invasion recapitulates the clinical behavior of the tumor and enables study of the mechanisms mediating invasion of the NPC niche.
Figure 1. DIPG cells isolated from an SVZ site of spread invade to the cerebrum and SVZ.

See also Figure S1.
(A) MRI (coronal, T1 post-gadolinium) and H&E micrograph (inset) of tumor in the SVZ of a 6-year-old female with DIPG (subject SU-DIPG-XIII). Scale bar, 50 μm.
(B–C) H&E micrograph of tumor in the lateral wall of the lateral ventricle SVZ in a 12-year old female with DIPG (subject SU-DIPG-V). Scale bars, 1 mm (B), 50 μm (C).
(D–E) DIPG cells isolated from tumor in the SVZ (SU-DIPG-XIII FL cells) recapitulate invasion of the forebrain when orthotopically xenografted in NSG mice as shown in bioluminescent IVIS imaging (D), as well as invasion of the SVZ as shown by histological analysis (E). Lateral ventricle outlined in dashed white lines. Scale bar, 40 μm.
(F) SU-DIPG-XIII FL cells (GFP+ HNA+) and neural precursor cells (Sox2+ GFAP+) in the SVZ stem cell niche in an NSG mouse orthotopically xenografted with DIPG cells. Scale bar, 20 μm.
(G) SU-DIPG-XIII FL cells invade widely throughout the brain over time, with 100% of mice exhibiting tumor in the SVZ by 16 weeks post-xenograft.
Secreted factors from NPCs promote glioma invasion
To test the invasion of glioma toward NPCs in vitro, we utilized a Boyden chamber Matrigel invasion assay, which allows for chemoattraction testing and mimics invasion through an extracellular matrix. A suspension of SVZ DIPG cells placed on top of the Matrigel layer was allowed to invade toward media conditioned by mouse NPCs (mNPC CM) isolated from the lateral ventricle subventricular zone (SVZ), third ventricular zone (3VZ), or fourth ventricular zone (4VZ), or toward unconditioned mNPC media for 72 hours. In this paradigm, SVZ DIPG cells showed the strongest preferential invasion toward SVZ mNPC CM, with less robust preferential invasion toward 3VZ or 4VZ mNPC CM, compared to unconditioned mNPC media (Figure 2A). When the paradigm was reversed (SVZ DIPG cells co-incubated with mNPC CM, and allowed to invade toward growth factor-deprived media), SVZ DIPG cells co-incubated with 4VZ mNPC CM showed a small increase in general invasion (Figure 2B). Exposure to media conditioned by any of the mNPC populations did not affect DIPG cell proliferation or viability (Figures S2A–B). These data suggest that SVZ DIPG cells, which are intrinsically invasive, can modestly increase general invasiveness upon direct exposure to molecules secreted by 4VZ mNPCs, and have strong preferential invasion toward chemoattractant molecules secreted by SVZ mNPCs. To assess the relative specificity of invasion toward NPCs and to control for the possible chemoattractant effects of molecules secreted by cells in general, we tested invasion toward factors secreted by cultured murine neurons and found only a minimal effect; SVZ mNPC CM promoted a substantially more robust increase in DIPG invasion compared to murine neuronal CM (Figure S2C). We next evaluated the CM from a culture of human fetal SVZ NPCs and found a similar chemoattractant effect on SVZ DIPG cells (Figure 2C). Expanding these observations, we found that 18 out of a panel of 24 patient-derived glioma cell cultures, including DIPG, pediatric spinal cord glioma, pediatric cortical GBM, adult GBM, and oligodendroglioma, demonstrated increased invasion toward human SVZ NPC CM compared to unconditioned hNPC media (Figure 2C and Table S1). These results indicate that a range of molecularly distinct classes of HGGs exhibit preferential invasion toward factors secreted by SVZ NPCs.
Figure 2. Factors secreted by NPCs promote high-grade glioma invasion.

See also Figure S2 and Table S1.
(A–B) Schematic and Matrigel invasion assay results of DIPG cells invading toward mNPC CM (A) or when co-incubated with mNPC CM (B). DIPG cells invade preferentially toward SVZ mNPC CM compared to other mNPC CM or unconditioned mNPC media. Direct exposure to 4VZ mNPC CM modestly increases general DIPG invasion. n = 3 replicates/wells in SU-DIPG-XIII FL cells and analyzed by one-way ANOVA with Tukey post hoc adjustment for multiple comparisons.
(C) 18 out of a panel of 24 patient-derived glioma cultures (see Table S1) invade preferentially toward SVZ hNPC CM compared to unconditioned hNPC media. n = 3 replicates/wells and analyzed by unpaired, two-tailed Student’s t-tests for comparison between unconditioned and conditioned hNPC media.
Data shown as mean ± SEM. *p < 0.05, **p < 0.01, ***p < 0.001.
NPC-derived secreted factors promoting glioma invasion are proteins
We performed several biochemical analyses to determine the nature of the NPC-secreted factors. Heat inactivation of SVZ hNPC CM abrogated its chemoattractant effect, whereas RNase and DNase treatment did not (Figure 3A). Size fractionation of the CM showed that DIPG cells exhibited strong invasion toward the >30 kDa fraction, but not toward the <30 kDa fraction (Figure 3B). Together, these data indicate that the SVZ hNPC-secreted chemoattractant(s) are protein(s) greater than 30 kDa in size. Similarly, the invasion-promoting factor(s) in the 4VZ mNPC CM also appear to be protein(s) greater than 30 kDa (Figures 3C–D). To identify the invasion-promoting proteins present in SVZ and 4VZ mNPC CM, we utilized 2D gel electrophoresis to separate the secreted proteins by size and charge, followed by mass spectrometry to identify the differentially secreted protein spots (Figure 3E). Spots differentially detected in SVZ mNPC CM compared to 4VZ mNPC CM by a factor of 1.5 were selected for further investigation. These analyses generated a list of candidate proteins that were differentially secreted by SVZ and 4VZ mNPCs (Figure 3F).
Figure 3. NPC-secreted factors promoting invasion are proteins.

(A and C) Boiling, but not RNase and/or DNase treatment, abrogates the invasion-promoting effects of SVZ hNPC CM (A) and 4VZ mNPC CM (C).
(B and D) Size fractionation of SVZ hNPC CM (B) and 4VZ mNPC CM (D) reveals that the invasion-promoting factor(s) are greater than 30 kDa in size.
All experiments performed with n = 3 replicates/wells in SU-DIPG-XIII FL cells and analyzed by unpaired, two-tailed Student’s t-tests for comparison between unconditioned and conditioned media (A, C) or by one-way ANOVA with Tukey post hoc adjustment for multiple comparisons (B, D). Data shown as mean ± SEM. **p < 0.01, ***p < 0.001.
(E) Two-dimensional gel electrophoresis separating proteins in SVZ mNPC CM (green) and 4VZ mNPC CM (red) by size (vertical axis) and charge (horizontal axis).
(F) List of candidate proteins of interest identified from proteomic analysis that were differentially expressed in SVZ mNPC CM compared to 4VZ mNPC CM by a factor of 1.5.
Pleiotrophin, in combination with required binding partners, promotes glioma invasion toward the SVZ
We subsequently tested the sufficiency of each of the eight candidate proteins to chemoattract DIPG cells. Using human recombinant proteins in the Matrigel invasion assay, we tested directed invasion of DIPG cells toward each candidate factor. No significant increase in invasion was observed for individual candidate proteins compared to unconditioned media (Figure 4A). We then tested DIPG invasion toward various combinations of the candidate proteins, and found the combination of four proteins: pleiotrophin (PTN), secreted protein acidic and rich in cysteine (SPARC), SPARC-like protein 1 (SPARCL1), and heat shock protein 90B (HSP90B), exhibits a chemoattractant effect most similar to that of the SVZ hNPC CM (Figure S3A). Testing combinations of two, three, or all four of these proteins demonstrated that only the combination of all four proteins was sufficient to recapitulate the full invasion-promoting effect of SVZ hNPC CM (Figure 4B). PTN is present in the highest concentration of the four proteins in SVZ hNPC CM as estimated by immunoblot (Figure S3B). The estimated concentrations of the four proteins in SVZ hNPC CM were confirmed to be sufficient for DIPG invasion (Figure S3C).
Figure 4. The combination of PTN and three required binding partners promotes DIPG invasion toward SVZ hNPC CM.

See also Figure S3 and Table S1.
(A) No single candidate recombinant protein significantly increased DIPG invasion compared to unconditioned hNPC media.
(B) The combination of four factors: PTN, SPARC, SPARCL1, and HSP90B, was sufficient for the full invasion-promoting effect toward SVZ hNPC CM. No combination of two or three factors was sufficient.
All experiments performed with n = 3 replicates/wells in SU-DIPG-XIII FL cells and analyzed by one-way ANOVA with Tukey post hoc adjustment for multiple comparisons (A) or Dunnett post hoc adjustment for multiple comparisons to either SVZ hNPC CM or the combination of all 4 factors (B).
(C) All four proteins coeluted at approximately the 212 kDa size expected for a complex of all four proteins by size exclusion chromatography.
(D) All four proteins copurified together in immunoprecipitation reactions for any one of the four proteins, more so than with a control IgG. Three control proteins also present in SVZ hNPC CM: GRP78, IGFBP2, and BCAN, did not copurify with any of the four proteins.
(E) 9 out of a panel of 9 patient-derived glioma cultures (see Table S1) invade preferentially toward the combination of four proteins similarly to toward human SVZ NPC CM, compared to unconditioned hNPC media. All experiments performed with n = 3 replicates/wells and analyzed by unpaired, two-tailed Student’s t-tests for comparison between unconditioned and conditioned hNPC media.
Data shown as mean ± SEM. *p < 0.05, **p < 0.01, ***p < 0.001.
In order to elucidate the nature of the interaction between the four proteins, we performed biochemical analyses to determine the size and binding interactions of the proteins of interest in SVZ hNPC CM. By size exclusion chromatography of concentrated SVZ hNPC CM and subsequent immunoblot analysis of the eluted fractions, we found that the four proteins of interest all coeluted at approximately the size that would be expected for a complex of all four proteins (Figure 4C). With the exception of SPARCL1, the four proteins had similar patterns of elution and fractionated mostly at the larger size of all four proteins combined rather than at the sizes of the single proteins. This suggests that the proteins exist primarily as part of a four-protein complex. Furthermore, in immunoprecipitation (IP) reactions, we found that by immunoprecipitating any one of the four proteins, all four proteins copurified and did not precipitate with a control IgG antibody (Figure 4D). To assess the specificity of the IP pull-down assay, three control proteins also present in SVZ hNPC CM: 78 kDa glucose-regulated protein (GRP78), insulin-like growth factor binding protein 2 (IGFBP2), and brevican (BCAN), were immunoprecipitated and were not found to copurify with any of the four proteins (Figure 4D). These results further demonstrate that the four proteins physically interact and specifically bind together as a single complex. Of the four identified proteins, PTN was of particular interest, as it has been demonstrated to promote adult GBM cell migration through autocrine/paracrine action (Lu et al., 2005; Ulbricht et al., 2003). The requirement of SPARC, SPARCL1, and HSP90B as binding partners for PTN in promoting glioma invasion is consistent with the role of SPARC and SPARCL1 as adapter proteins that act as connecting molecules (Lane and Sage, 1994), and the role of HSP90B as a chaperone protein facilitating the interactions of other proteins (Wiech et al., 1992). The binding of these three proteins may act to stabilize PTN, which has been shown to promote haptotactic glioma cell migration, i.e. migration toward immobilized PTN, as opposed to chemotactic migration toward free soluble PTN molecules (Lu et al., 2005; Ulbricht et al., 2003). Similar to the conserved invasive response toward SVZ hNPC CM, we found that 9 out of 9 patient-derived glioma cell cultures, including DIPG, pediatric spinal cord glioma, adult GBM, and anaplastic oligodendroglioma, invaded toward the combination of PTN and its three binding partners (Figure 4E). As an example of a cancer with known metastatic tropism for the brain, but that does not preferentially spread to the SVZ, we tested a melanoma cell line and found that it did not invade toward SVZ hNPC CM or toward the PTN complex (Figure S3D). Together, these results indicate that PTN and its three binding partners form a complex and signal as a unit in promoting the directional invasion of a range of HGGs.
Expression of pleiotrophin is strongly enriched in the mouse and human postnatal SVZ
Pleiotrophin has been found to promote neurite outgrowth and neuroblast migration during neurodevelopment (Li et al., 1990; Rauvala and Pihlaskari, 1987; Maeda and Noda, 1998), as well as migration of adult GBM cells through autocrine/paracrine mechanisms (Lu et al., 2005; Ulbricht et al., 2003). We found that PTN protein expression is enriched in the SVZ stem cell niche compared to other brain regions, with PTN expression strongest in the lateral ventricle SVZ, particularly in the lateral walls, and moderate expression in the third and fourth ventricular zone in the adult murine brain (Figure 5A). In the developing postnatal murine brain, we found that PTN protein is more broadly expressed in the brain at P0-5, and becomes largely restricted to the lateral ventricle SVZ by P10 (Figures 5B, S4A). PTN protein is also expressed in the pia mater, which is interesting to note as HGGs can also spread to the leptomeninges; in DIPG, leptomeningeal spread has been observed in 25–30% of cases at the time of autopsy (Caretti et al, 2014; Figures 5B, S4A). Of the four identified proteins, PTN is the most localized to the SVZ after early postnatal development in mice, whereas SPARC, SPARCL1, and HSP90B are more broadly expressed in the brain (Figure S4A). In the childhood and adult human SVZ, we found strong PTN expression specific to the first few millimeters subjacent to the ventricular epithelium and expression co-localized with Nestin+ NPCs as well as extracellularly (Figures 5C–D). NPCs isolated from the murine lateral ventricle SVZ at P14 exhibit higher gene and protein expression of PTN compared to NPCs isolated at the same age from the 3VZ, 4VZ, or hippocampal dentate gyrus (another neural stem cell niche; Figures 5E, G). Whole SVZ tissue isolated from P42 mice also exhibits higher gene and protein expression of PTN compared to cortical tissue (Figures 5F, H). These results demonstrate the specific enrichment of PTN in murine and human postnatal SVZ NPCs, suggesting that this molecule could mediate NPC:glioma chemoattraction and underlie the pattern of SVZ invasion observed clinically. Together, these results suggest that PTN is a primary factor responsible for the chemoattraction toward SVZ hNPC CM, and that the other three proteins act as accessory factors.
Figure 5. PTN expression is enriched in the postnatal SVZ.

See also Figure S4.
(A) PTN protein is highly localized to the SVZ and pia mater (white arrowhead) in the adult murine brain (left). PTN is expressed at lower levels in the 3VZ (left middle) and 4VZ (right), and is undetectable in the hippocampus (right middle). Scale bar, 1 mm. LV = lateral ventricle. 3V = third ventricle. 4V = fourth ventricle.
(B) PTN protein expression near the lateral ventricles and in the pia (white arrowheads) in the postnatal murine brain at P0, 5, and 10. Scale bar, 1 mm.
(C) PTN protein is highly expressed in the human SVZ of an 8-year-old female (left) and a 68-year-old male (right). PTN protein co-localizes with Nestin+ NPCs in the SVZ and is also present extracellularly. Scale bar, 1 mm.
(D) High magnification images of PTN expression co-localizing with Nestin+ NPCs in the SVZ of a 68-year-old male. Scale bar, 25 μm.
(E and G) Ptn gene (E) and PTN protein expression (G) are higher in SVZ mNPCs isolated from P14 WT mice, compared to 3VZ, 4VZ, or DG mNPCs isolated at the same age. Gene expression values shown are normalized to ACTB expression. qPCR experiments performed with n = 3 wells of cells and analyzed by one-way ANOVA with Tukey post hoc adjustment for multiple comparisons.
(F and H) Ptn gene (F) and PTN protein expression (H) are higher in the SVZ compared to cortex of P42 mice. Gene expression values shown are normalized to ACTB expression. qPCR experiments performed with n = 3 mice and analyzed by unpaired, two-tailed Student’s t-test.
Data shown as mean ± SEM. *p < 0.05, **p < 0.01.
PTN is necessary for glioma invasion toward the SVZ
To test the necessity of the PTN complex for DIPG invasion toward SVZ NPCs, we depleted each factor from SVZ hNPC CM by two different methods. Immunodepletion of any of the four proteins (with or without add back of the other three proteins) abrogated the chemoattractant effect of the CM (Figures 6A, S5A). shRNA-mediated knockdown of SVZ hNPC gene expression of any of the four genes decreased DIPG cell invasion toward CM from those NPCs (Figure 6B). These results indicate that each of the four proteins is necessary for DIPG invasion toward SVZ NPCs in vitro. We then tested the necessity of PTN for DIPG invasion of the SVZ in vivo. Stereotactic injection of lentivirus expressing shRNA targeting Ptn into the mouse SVZ achieved effective knockdown of pleiotrophin expression, compared to a non-targeting scrambled shRNA control (Figure 6C). Tumor engraftment in the two groups was equivalent (Figure S5B). At 16 weeks following pontine xenograft, we found that fewer DIPG cells invaded the SVZ in mice with shRNA-mediated knockdown of Ptn in the SVZ, compared to mice that received a scrambled shRNA control (Figures 6C, E). While the role of PTN in postnatal SVZ NPCs remains to be elucidated, we assessed the number of SVZ NPCs present following Ptn knockdown to confirm that the striking decrease in SVZ glioma invasion was not explained by a reduction in the NPC population. We found equivalent numbers of Sox2+ NPCs in mice injected with Ptn shRNA or scrambled shRNA control vectors (Figures 6D, F), confirming that the observed reduction in glioma invasion was not due to NPC loss but rather to decreased Ptn expression. Taken together, these data demonstrate that PTN is necessary for glioma invasion toward the SVZ NPC niche in vitro and in vivo.
Figure 6. PTN is necessary for glioma invasion toward the SVZ.

See also Figures S5–6.
(A) DIPG cells invade less toward SVZ hNPC CM after immunodepletion of any or a combination of the four proteins. Depletion of target proteins was confirmed by Western blot.
(B) DIPG cells invade less toward CM from SVZ hNPCs that had any or all of the four proteins knocked down by shRNA-expressing lentivirus, compared to CM from SVZ hNPCs expressing a scrambled shRNA control. Knockdown efficacy was confirmed by Western blot.
In vitro experiments performed with n = 3 replicates/wells in SU-DIPG-XIII FL cells and analyzed by one-way ANOVA with Tukey post hoc adjustment for multiple comparisons.
(C and E) Fewer orthotopically xenografted GFP+ HNA+ SU-DIPG-XIII FL cells invaded the SVZ, defined as a 200 μm-wide region adjacent to the lateral ventricles (outlined in dashed white lines), when lentivirus expressing sh-Ptn (right) was injected into the SVZ, compared to lentivirus expressing a scrambled shRNA control (left). Scale bar, 200 μm.
(D and F) The density of Sox2+ NPCs in the SVZ was equivalent in mice injected with lentivirus expressing sh-Ptn (right) or scrambled shRNA control (left). Scale bar, 50 μm.
In vivo experiments performed with n = 5 mice per group. Stereological cell counts at 16 weeks following xenograft analyzed by unpaired, two-tailed Student’s t-test. Each data point = one mouse (E–F).
Data shown as mean ± SEM. *p < 0.05, **p < 0.01, ***p < 0.001.
Pleiotrophin has several known receptors, and the one that has been implicated in glioma migration is protein tyrosine phosphatase receptor type ζ (PTPRZ; Lu et al., 2005; Müller et al., 2003; Ulbricht et al., 2003). DIPG primary tumor and cell culture samples exhibit expression of the protein tyrosine phosphatase receptor type ζ gene PTPRZ1 (Grasso et al., 2015; Nagaraja et al., 2017; Fig S5C). Robust shRNA-mediated knockdown of PTPRZ1 expression in DIPG cells (Figure S5D) substantially decreases baseline invasion (Figure S5E) and also mildly decreases cell viability (Figure S5F). Normalizing for these effects, we find that PTPRZ1 knockdown in DIPG cells confers a partial abrogation of invasion toward SVZ hNPC CM or the PTN complex in vitro (Figure S5G). This suggests that while PTPRZ is necessary for the full effect of the PTN complex, other receptors may also be involved. To further test the hypothesis that PTPRZ is a relevant PTN receptor to SVZ invasion, PTPRZ1 knockdown or scrambled control DIPG cells were xenografted to the pons. We found a dramatic effect on engraftment, with PTPRZ1 knockdown resulting in 10-fold lower bioluminescent signal on initial IVIS imaging (Figure S5H). From these different initial tumor sizes, the rate of growth was similar in mice xenografted with PTPRZ1 knockdown or control cells (Figure S5I). At 8 weeks, significantly fewer cells expressing PTPRZ1 shRNA reached the SVZ (Figure S5J), but interpretation of these results is complicated by the substantial effect of PTPRZ1 knockdown on DIPG xenograft engraftment.
HSP90 inhibition as a potential therapeutic strategy
Because HSP90 is a necessary component of the PTN complex, and HSP90 inhibitors have been developed for clinical use, we tested the possibility that HSP90 inhibition could be used as a strategy to reduce SVZ invasion. Evaluating an HSP90 inhibitor (tanespimycin, 17-AAG) that has been in advanced clinical trials, we found that 17-AAG decreases invasion toward SVZ hNPC CM in vitro, but only at concentrations above 1 μM (Figure S6A–B). At high concentrations, 17-AAG also decreased DIPG cell viability, as has been reported for other HSP90 inhibitors (Grasso et al, 2015). Brain penetration of 17-AAG has been measured at less than 1 μM in rodent models (Egorin et al., 2001), so we did not expect to find a therapeutic effect in vivo. Accordingly, we did not find a difference in SVZ invasion between mice that received 17-AAG following pontine xenograft compared to those receiving vehicle control (Figure S6C). Because HSP90 targeting with a more potent or brain penetrant antagonist may be a useful strategy, we sought proof of principle demonstration that HSP90 inhibition could decrease SVZ invasion. Stereotactic injection of shRNA-expressing lentivirus targeting the Hsp90b1 gene into the mouse SVZ resulted in fewer DIPG cells invading the SVZ at 16 weeks following pontine xenograft, with no effect on initial tumor engraftment or SVZ NPC density (Figures S6D–H). These results support the concept that HSP90B is necessary for DIPG invasion of the SVZ and that effective HSP90 inhibition could prove a useful strategy.
NPC-secreted factors activate the Rho/ROCK pathway
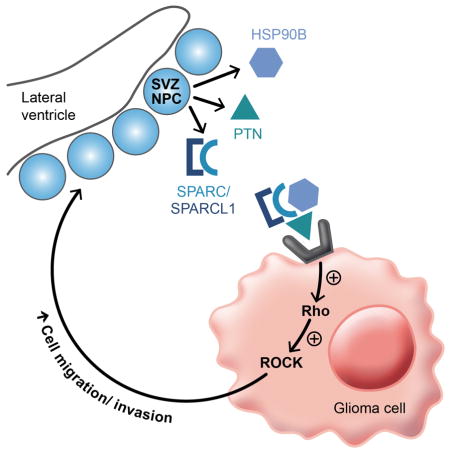
The Rho/Rho kinase (ROCK) pathway is linked to PTN-PTPRZ signaling (Niisato et al., 2005; Tamura et al., 2006) and to tumor invasion in general (for review, see Parri and Chiarugi, 2010). To test the involvement of this pathway in DIPG invasion of the SVZ, we exposed DIPG cells to unconditioned hNPC media or SVZ hNPC CM for a range of time points between 0.5–120 minutes, and subsequently measured RhoA and ROCK activation. Exposure to SVZ hNPC CM for 1–5 minutes resulted in an increase in RhoA activation compared to exposure to unconditioned hNPC media (Figure 7A). ROCK activation occurs at a later time point, after exposure to SVZ hNPC CM for 60–120 minutes (Figure 7B). Exposure to the PTN complex activated RhoA and ROCK at levels similar to exposure to SVZ hNPC CM (Figures 7C–D). DIPG cells with shRNA-mediated knockdown of PTPRZ1 exhibited abrogation of RhoA and ROCK activation when exposed to SVZ hNPC CM or the PTN complex, compared to scrambled control DIPG cells (Figure S7A), further supporting that PTN-PTPRZ signaling results in activation of the Rho/ROCK pathway. Exposure of DIPG cells to two different ROCK inhibitors decreased DIPG invasion toward SVZ hNPC CM (Figures 7E–F), without affecting cell viability (Figures S7B–C). These results implicate the involvement of the Rho/ROCK pathway in promoting DIPG invasion in response to the SVZ NPC-secreted PTN complex. Thus, DIPG cells originating in the pons invade widely throughout the brain, and when in proximity to SVZ NPCs, are drawn in to the SVZ by PTN and its three required binding partners (Figure 7G). NPC-secreted PTN and binding partners activate the Rho/ROCK pathway in DIPG cells, which promotes glioma cell migration and invasion (Figure 7H).
Figure 7. NPC-secreted factors activate the Rho/ROCK pathway.

See also Figure S7.
(A–B) Exposure of DIPG cells to SVZ hNPC CM activated RhoA after 1–5 minutes (A) and ROCK after 60–120 minutes (B), compared to unconditioned hNPC media.
(C–D) Exposure to PTN and the three binding partners in unconditioned hNPC media activated RhoA (C) and ROCK (D) similarly to SVZ hNPC CM.
(E–F) Treatment with ROCK inhibitors GSK 429286 or GSK 269962A decreased DIPG invasion toward SVZ hNPC CM in a dose-dependent manner.
All experiments performed with n = 3 replicates/wells in SU-DIPG-XIII FL cells and analyzed by unpaired two-tailed Student’s t-tests for comparison between unconditioned and conditioned hNPC media (A–B) or by one-way ANOVA with Tukey post hoc adjustment for multiple comparisons (C–F). Data shown as mean ± SEM. *p < 0.05, **p < 0.01, ***p < 0.001.
(G) Schematic illustrating the model of glioma cells originating in the pons invading generally in the ventral pons, and being drawn at short to medium range into the SVZ upon exposure to PTN and the three binding partners secreted by SVZ NPCs.
(H) Schematic illustrating the model of glioma chemoattraction toward NPC-secreted PTN and the three binding partners, subsequent activation of the Rho/ROCK pathway in glioma cells, and promotion of glioma cell migration and invasion.
Discussion
The present study demonstrates a pathogenic role for NPC:glioma interactions and defines glioma chemoattractants secreted by SVZ NPCs. While NPCs are known to migrate toward and track glioma cells (Aboody et al., 2000; Li et al., 2007) in response to glioma-secreted cytokines (Ehtesham et al., 2004; Imitola et al., 2004) and additional signals (An et al., 2009; Staflin et al., 2009), glioma migration/invasion towards NPC populations has been underrecognized. Pleiotrophin, along with three required binding partners, mediates chemoattraction toward the SVZ. Pleiotrophin, specifically enriched in the SVZ after early postnatal neurodevelopment and secreted by SVZ NPCs, interacts with three additional proteins secreted by NPCs that together mediate invasion of a range of molecularly and clinically distinct glioma types, and activates the Rho/ROCK pathway in glioma cells. Taken together, the findings presented here identify pleiotrophin and its binding partners as key chemoattractant proteins secreted by SVZ NPCs that are necessary and sufficient for glioma invasion of the SVZ niche.
Implications for glioma
The SVZ is a site of frequent spread in HGG, and glioma spread to the SVZ is associated with decreased survival (Chaichana et al., 2008; Jafri et al., 2013; Mistry et al., 2017a, 2017b) and increased tumor recurrence (Adeberg et al., 2014; Chen et al., 2015). Notably, decreased survival and increased early recurrence in adult GBM are associated specifically with glioma contact of the lateral ventricle SVZ (Mistry et al., 2017b), for reasons that have yet to be fully elucidated. Clinical studies have sought to improve outcomes by increasing the radiation dose to the SVZ in GBM patients, which in some cases has increased progression-free survival (Chen et al., 2013; Evers et al., 2010; Lee et al., 2013). In DIPG, mortality typically results from brainstem disease, but spread to the SVZ can result in increased morbidity and mortality. As more effective disease control is achieved in the pons for children with DIPG, regions of distant spread such as the SVZ may emerge as a larger clinical problem.
Understanding DIPG invasion of the SVZ informs not only the pathobiology of this important pediatric cancer, but also clarifies mechanisms of SVZ involvement that are conserved across HGG types. DIPG travels some distance between its origins in the pons and the lateral ventricle SVZ. The pattern of DIPG spread found at the time of autopsy is widespread and multidirectional (Caretti et al., 2014), consistent with an intrinsic invasiveness of DIPG cells (Nagaraja et al., 2017) that may be exacerbated by factors in the local microenvironment such as 4VZ NPCs as above. When DIPG cells invade the forebrain, the demonstrated chemoattractant effect of SVZ NPCs may then act at short to medium range to draw invading cells to the SVZ niche. Additional growth-promoting factors present in the SVZ stem cell niche may function to encourage blooming of substantial masses when glioma cells arrive there.
Pleiotrophin has pleiotrophic roles in development and cancer
Pleiotrophin (PTN), also known as heparin-binding growth-associated molecule, is a developmentally regulated, secreted growth factor with numerous and diverse roles in brain development, homeostasis, and regeneration. Pleiotrophin has several possible receptors, including protein tyrosine phosphatase receptor type ζ (PTPRZ), anaplastic lymphoma kinase (ALK), N-syndecan, neuroglycan, integrin αvβ3, and lipoprotein receptor-related protein (LRP) (González-Castillo et al., 2015), and as such, the functional effects of pleiotrophin binding are cell context-specific. Pleiotrophin was originally recognized to promote neurite outgrowth (Kinnunen et al., 1999; Li et al., 1990; Rauvala and Pihlaskari, 1987) and subsequently found to promote haptotactic neuroblast migration along radial glial processes from the subventricular germinal zone to the developing cortical plate during corticogenesis (Maeda and Noda, 1998). Additional functions of pleiotrophin range from supporting dendrite and axonal regeneration (Blondet et al., 2005; Mi et al., 2007) to modulation of synaptic plasticity (Lauri et al., 1998; Pavlov et al., 2002). Pleiotrophin and PTPRZ are both highly expressed in human white matter oligodendroglial precursor cells (OPCs), and PTN-PTPRZ signaling promotes adult OPC differentiation during developmental myelination and remyelination after injury (Harroch et al., 2002; Sim et al., 2006). In prenatal human OPCs, PTN-PTPRZ signaling promotes proliferation, population expansion, and self-renewal through downstream regulation of the Wnt pathway (McClain et al., 2012). Underscoring the broad roles for pleiotrophin in neurodevelopment, pleiotrophin knockout mice exhibit aberrant cognitive behavior as well as anomalies in corticogenesis (Hienola et al., 2004; Krellman et al., 2014).
Here we show that after development, pleiotrophin expression is highly enriched in the murine and human SVZ. The identification of pleiotrophin as a protein secreted by murine and human SVZ NPCs is consistent with reports identifying PTN in the secretomes of various neural stem cell populations (Furuta et al., 2004; Lee et al., 2012). While this suggests a role for pleiotrophin in the postnatal SVZ niche, the in vivo function of pleiotrophin and the reasons for its elevated expression in the SVZ compared to other neural stem cell niches remain to be fully elucidated.
In addition to its roles in normal neurodevelopment, plasticity, and regeneration, pleiotrophin also has many roles in cancer, including involvement in tumor growth (Tsirmoula et al., 2012; Wellstein et al., 1992) and invasion and metastasis (Czubayko et al., 1996; Wu et al., 2005). Pleiotrophin is expressed by HGG cells, and expression levels are inversely correlated with overall patient survival (Zhang et al., 2015). Autocrine/paracrine secretion of pleiotrophin promotes adult GBM migration via PTN-PTPRZ signaling (Lu et al., 2005; Ulbricht et al., 2003). Like neuroblasts during corticogenesis (Maeda and Noda, 1998), GBM cells exhibit robust haptotactic migration toward immobilized pleiotrophin, but only show weak chemotactic migration toward free soluble pleiotrophin (Lu et al., 2005; Ulbricht et al., 2003). The finding here that NPC-secreted pleiotrophin requires three binding partners may reflect a similar requirement for immobilization to encourage haptotactic migration into the SVZ.
The Rho/ROCK pathway in glioma migration and invasion
Rho/Rho kinase (ROCK) signaling is a well-established pathway in cell migration. It is a complex pathway, and its role in glioma migration and invasion may be context-specific. In normal cell migration, active ROCK promotes the LIM kinase/cofilin pathway, thereby promoting stabilization of actin filaments (Maekawa et al., 1999; Sumi et al., 2001). In a parallel pathway, active ROCK inhibits myosin light chain phosphatase, thus promoting actin and myosin crosslinking. This leads to contraction of the trailing edge and forward motion of the cell, and thereby increases cell migration (Mitchison and Cramer, 1996). Consistent with the potential pro-motility effects of modulating Rho/ROCK pathway activity in either direction, the role of Rho/ROCK in glioma migration and invasion is complex and seemingly contradictory. Some studies found that inhibition of ROCK decreased glioma migration (Lin et al., 2009; Oellers et al., 2009), while another study found that inhibition of ROCK increased glioma migration and invasion (Salhia et al., 2005). Here, we find that pleiotrophin and its binding partners activate the Rho/ROCK pathway in glioma cells, and treatment with ROCK inhibitors decreases their invasion toward factors secreted by SVZ NPCs, thus implicating this prominent migration pathway in glioma invasion of the SVZ.
Neurite outgrowth/axon guidance molecules in glioma invasion
An emerging theme in glioma pathobiology is malignant hijacking of neurodevelopmental mechanisms (for review, see Baker, Ellison, and Gutmann, 2015), including the re-purposing of traditional neurite outgrowth and axon guidance molecules to regulate glioma invasion. One major family of axon guidance molecules, the ephrins and Eph receptors, promote migration and invasion in adult GBM (Nakada et al., 2010; Sikkema et al., 2012) and in DIPG (Nagaraja et al., 2017). Netrins are another class of chemoattractant cues for pathfinding axons that promote GBM invasion (Shimizu et al., 2013). On the other hand, signals that are chemorepulsive to the axonal growth cone prove inhibitory to glioma invasion. SLIT/ROBO signaling, canonically involved in axon pathfinding as a chemorepulsive ligand-receptor system (Brose et al., 1999; Kidd et al., 1999), functions similarly as a chemorepellant in glioma (Mertsch et al., 2008). Semaphorins function chiefly as short-range inhibitory signals for developing axons, and HGGs express both semaphorins and the receptors plexins and neuropilins (Rieger et al., 2003); semaphorin signaling has been found to limit glioma motility (Li and Lee, 2010; Zhou et al., 2012).
As a molecule that promotes neurite outgrowth and neuroblast migration, pleiotrophin appears to similarly promote glioma tropism toward a preferred niche. Identification of pleiotrophin and its binding partners as chemoattractant factors secreted by NPCs begins to explain how and why glioma cells preferentially invade the SVZ. Targeting the pleiotrophin complex, including HSP90 inhibition, and downstream Rho/ROCK signaling emerge as therapeutic strategies to limit or prevent tumor invasion of the SVZ in high-grade gliomas.
STAR Methods
CONTACT FOR REAGENT AND RESOURCE SHARING
Further information and requests for resources and reagents should be directed to and will be fulfilled by the Lead Contact, Michelle Monje (mmonje@stanford.edu). SU cell cultures will be distributed through the Monje lab with a material transfer agreement (MTA) with Stanford University.
EXPERIMENTAL MODEL AND SUBJECT DETAILS
Mice and housing conditions
All animal procedures were approved by the Stanford University Administrative Panel on Laboratory Animal Care and performed in accordance with institutional and National Institutes of Health guidelines. All experiments were performed on NOD-SCID-IL2R gamma chain-deficient (NSG) or BL6/CD1 mice mice, with male and female animals used equally. Animals were housed according to standard guidelines with free access to food and water in a 12-hour light/dark cycle.
Patient-derived glioma cell culture
All human tissue studies were performed with informed consent and in accordance with Institutional Review Board (IRB)-approved protocols. Authenticity of all cultures was routinely monitored and validated using short tandem repeat (STR) DNA fingerprinting.
DIPG cell cultures were generated as tumor neurospheres from early post-mortem tissue as previously described (Caretti et al., 2014; Lin and Monje, 2017; Monje et al., 2011; Venkatesh et al., 2015). Briefly, tumor tissue was collected under sterile conditions, and transported in Hibernate-A (Thermo Scientific, Waltham, MA) on ice to the laboratory. The tissue was mechanically dissociated, followed by gentle rotation in enzymatic dissociation buffer (HEPES-HBSS with DNase I and liberase) at 37°C. Cells were then passed through a 100 μm cell strainer, and processed through a sucrose gradient to remove myelin. The resulting dissociated cells were treated with ACK lysis buffer (Thermo Scientific, Waltham, MA) to remove red blood cells, and plated in a serum-free medium designated “Tumor Stem Media (TSM),” consisting of: Neurobasal (-A) (Invitrogen, Carlsbad, CA), B27 (-A) (Invitrogen, Carlsbad, CA), heparin (2 μg/mL; Stem Cell Technologies, Vancouver, BC, Canada), human-EGF (20 ng/mL; Shenandoah Biotech, Warwick, PA), human-bFGF (20 ng/mL; Shenandoah Biotech, Warwick, PA), PDGF-AA (10 ng/mL; Shenandoah Biotech, Warwick, PA), and PDGF-BB (10 ng/mL; Shenandoah Biotech, Warwick, PA).
The pediatric and adult high grade gliomas used were obtained at the time of biopsy and cultured and validated in the same way as for DIPG tissue described above.
The oligodendroglioma cultures were obtained at the time of biopsy, and generated similarly to as described above and as previously described (Venkatesh et al., 2015). Briefly, the tissue was chopped finely, followed by gentle rotation in liberase at 37°C. Cells were triturated 8 times through a 10 mL serological pipette, followed by 8 times through a 1 mL pipette tip. The cells were then passed through a 100 μm cell strainer, a sucrose gradient, and treated with ACK lysis buffer as described above. Cells were cultured in flasks coated with Matrigel (BD Biosciences, San Jose, CA).
All glioma cells described above were cultured in “Tumor Stem Media (TSM),” a defined, serum-free medium described above.
Neural precursor cell culture and generation of conditioned media
Human subventricular zone neural precursor cells were a generous gift from Siddhartha Mitra and Samuel Cheshier. The cells were cultured from the subventricular zone of the lateral ventricles (SVZ) from a 19-week fetus. Cells were cultured as a monolayer in human neural precursor cell media (hNPC media), consisting of: Neurobasal (-A) (Invitrogen, Carlsbad, CA), B27 (-A) (Invitrogen, Carlsbad, CA), heparin (2 μg/mL; Stem Cell Technologies, Vancouver, BC, Canada), human-EGF (20 ng/mL; Shenandoah Biotech, Warwick, PA), human-bFGF (20 ng/mL; Shenandoah Biotech, Warwick, PA), and human-LIF (20 ng/mL; Millipore, Bedford, MA).
Mouse neural precursor cells were cultured from WT BL6/CD1 mice at P14 as described by Walker and Kempermann, 2014. The subventricular zone of the lateral ventricles, third ventricular zone, and fourth ventricular zone were microdissected. The tissue was minced and gently dissociated, passed through a 40 μm filter, and plated. Cells were cultured as a monolayer in mouse neural precursor cell media (mNPC media), consisting of: Neurobasal (-A) (Invitrogen, Carlsbad, CA), B27 (-A) (Invitrogen, Carlsbad, CA), heparin (2 μg/mL; Stem Cell Technologies, Vancouver, BC, Canada), mouse-EGF (20 ng/mL; Peprotech, Rocky Hill, NJ), and mouse-FGF-2 (20 ng/mL; Peprotech, Rocky Hill, NJ).
Conditioned media was collected from mouse and human neural precursor cells at passage 5–10. After passaging, cells were plated in fresh NPC media, and allowed to grow for 7 days, with addition of fresh media on day 3–4. On day 7, cells were spun down, and the conditioned media was collected and passed through a 0.22 μm filter. Conditioned media was either used immediately or frozen at −80°C for future experiments.
Neuron culture and generation of conditioned media
Mouse hippocampal neurons were cultured from WT BL6/CD1 mice at P0 as described by Beaudoin et al., 2012. The hippocampus was microdissected, minced, and gently dissociated. Cells were cultured in flasks coated with poly-L-lysine. Cells were plated initially in serum neuronal media, consisting of: Minimal Essential Medium with Earle’s salts (Invitrogen, Carlsbad, CA), glucose, and fetal bovine serum. All serum neuronal media was removed after the first 4 hours, and cells were subsequently cultured in serum-free neurobasal media, consisting of: Neurobasal (Invitrogen, Carlsbad, CA), B27 (Invitrogen, Carlsbad, CA), and Glutamax (Invitrogen, Carlsbad, CA). Serum-free neurobasal media was refreshed every 3–4 days.
Conditioned media was collected from mouse hippocampal neurons at 3 weeks after plating. At 2 weeks after plating, all media was replaced with fresh serum-free neurobasal media. Fresh media was added after 3–4 days, and on day 7, the conditioned media was collected and passed through a 0.22 μm filter. Conditioned media was either used immediately or frozen at −80°C for future experiments.
Culture of CHL-1 melanoma cells
CHL-1 melanoma cells (ATCC, Manassas, VA) were cultured in “Tumor Stem Media (TSM),” a defined, serum-free medium described above.
Orthotopic xenografting and lentiviral injections
NSG mice at age P34-36 were orthotopically xenografted with SU-DIPG-XIII frontal lobe CMV-GFP-luciferase cells, in a similar procedure to as previously described (Grasso et al., 2015; Venkatesh et al., 2015). Briefly, a single-cell suspension of SU-DIPG-XIII frontal lobe CMV-GFP-luciferase cells at passage 16–19 was prepared in sterile HBSS immediately before beginning the xenograft procedure. 600,000 cells in 3 μL were stereotactically injected into the pons of the left hemisphere of NSG mice, through a 31-gauge burr hole. Stereotactic coordinates used were: 1 mm lateral to midline, 0.8 mm posterior to lambda suture, and 5 mm deep. Cells were injected at a rate of 0.4 μL/min using a digital pump and a 31-gauge Hamilton syringe. After infusion of cells, the syringe needle was kept in place for 2 minutes, and then withdrawn manually at a rate of 0.875 mm/min to minimize the backflow of cells.
Mice used for shRNA lentivirus studies received shRNA-expressing lentivirus in the SVZ at P27-29 and DIPG cells in the left pons at P34-36. For lentiviral injections, 2 μL of shRNA-expressing lentivirus were stereotactically injected into the SVZ. Stereotactic coordinates used were: 1.3 mm lateral to midline, 0.1 mm posterior to bregma suture, and 2 mm deep. Virus was injected and the needle was withdrawn according to the same procedure as described above.
Human SVZ samples
All human tissue studies were performed with informed consent and in accordance with Institutional Review Board (IRB)-approved protocols. Human SVZ samples were obtained at autopsy from an 8-year-old female and a 68-year-old male.
METHOD DETAILS
Bioluminescent IVIS imaging
Mice were imaged using an IVIS Spectrum to ensure tumor engraftment and monitor tumor size. Mice were anesthesized under 1% isoflurane, intraperitoneally injected with luciferin (15 mg/kg), and imaged for bioluminescence every minute until the peak total flux was reached.
Drug treatment of mice
Orthotopically xenografted mice that were treated with 17-AAG or a vehicle control received treatment from 1 week after xenograft until sacrifice. 17-AAG was freshly formulated immediately before injections at 10 mg/mL in 5% DMSO/95% corn oil. Mice received 50 mg/kg 17-AAG 5 days per week (5 days on, 2 days off). Vehicle-treated control mice received 5 uL/g 5% DMSO/95% corn oil on the same dosing schedule. Mice were perfused 8 weeks after xenograft.
Perfusion and immunohistochemistry
Mice were intraperitoneally injected with Avertin (tribromoethanol) for anesthesia, and then transcardially perfused with 20 mL of ice-cold PBS. Brains were dissected out and fixed in 4% paraformaldehyde in PBS overnight at 4°C, and were then transferred to 30% sucrose in PBS for cryoprotection. Brains were embedded in Tissue-Tek O.C.T. (Sakura, Torrance, CA). Brains from mice older than P10 were sliced into 40 μm coronal or sagittal sections using a sliding microtome (Microm HM450; Thermo Scientific, Waltham, MA). Brains from mice age P0 to P10 were sliced into 25 μm coronal sections using a cryostat (Leica Biosystems CM3050 S; Wetzlar, Germany). For immunohistochemistry, a 1 in 6 series of 25 μm or 40 μm sections was incubated in blocking solution (3% normal donkey serum, 0.3% Triton X-100 in TBS) at room temperature for 1 hour. Sections were incubated in primary antibodies diluted in 1% blocking solution (1% normal donkey serum, 0.3% Triton X-100 in TBS) overnight at 4°C, rinsed in TBS the following day, and then incubated in secondary antibodies diluted in 1% blocking solution overnight at 4°C. The following day, sections were rinsed and mounted using ProLong Gold mounting medium with DAPI (Life Technologies, Carlsbad, CA).
Primary antibodies used were: mouse anti-human nuclei clone 235-1 (1:100; Millipore, Bedford, MA), goat anti-pleiotrophin (1:500; Santa Cruz Biotechnology, Santa Cruz, CA), goat anti-Sox2 (1:50; R&D Systems, Minneapolis, MN), rabbit glial fibrillary acidic protein (1:200; Stem Cell Technologies, Vancouver, Canada), and rat myelin basic protein (1:200; Abcam, Cambridge, MA).
Secondary antibodies used were: Alexa 594 donkey anti-goat IgG (1:500; Jackson ImmunoResearch, West Grove, PA), Alexa 405 donkey anti-mouse IgG (1:500; Jackson ImmunoResearch, West Grove, PA), Alexa 647 donkey-anti-rabbit IgG (1:500; Jackson ImmunoResearch, West Grove, PA), Alexa 647 donkey anti-mouse IgG (1:500; Life Technologies, Carlsbad, CA), and Alexa 647 donkey anti-rat IgG (1:500; Jackson ImmunoResearch, West Grove, PA).
Analysis of tumor spread over time
For analysis of DIPG spread in the mouse brain over time, 25 mice were orthotopically xenografted as described above. 8 mice were sacrificed at 4 weeks post-xenograft, 8 mice were sacrificed at 8 weeks post-xenograft, and 9 mice were sacrificed at 16 weeks post-xenograft. A 1:6 series of sagittal slices was stained and imaged, and the anatomical locations of GFP+ HNA+ cells throughout each mouse were noted and compared with the Allen Brain Atlas.
Matrigel invasion assay
To test for chemoattraction and invasion toward neural precursor cell conditioned media or another candidate chemoattractant, a single-cell suspension of 100,000 DIPG cells in Tumor Stem Media (TSM) base (with B27 (-A) and heparin, without growth factors) was seeded in the top inserts of BioCoat growth factor reduced Matrigel invasion chambers (Corning, Bedford, MA), after rehydration of the inserts. Chemoattractant media was added to the bottom of the chamber. All conditions were plated in triplicate. After 72 hours, media was aspirated, and the non-invading cells on top of the layer of Matrigel were scrubbed off. The invading cells were fixed in 4% paraformaldehyde and then stained with 0.1% crystal violet in 10% methanol in distilled water. The number of invading cells was quantified by the intensity of the crystal violet dye on the invading side of the Matrigel. The dye was collected in 10% acetic acid, and absorbance was measured at 595 nm.
To test for phenotypic change induced by direct exposure to neural precursor cell conditioned media, 100,000 DIPG cells were seeded in the top inserts of the Matrigel invasion assay in conditioned media, and TSM base (with B27 (-A) and heparin) was plated in the bottom chambers. The rest of the procedure was performed as described above.
To test the ROCK or HSP90 inhibitors in the Matrigel invasion assay, the inhibitors were added to the suspension of glioma cells in TSM base (with B27 (-A) and heparin) seeded in the top inserts at the appropriate concentrations, and neural precursor cell conditioned media was plated in the bottom chambers. The rest of the procedure was performed as described above.
Biochemical assays
For protein denaturation, media samples were boiled for 7 min at 100°C. For RNA and DNA degradation, media samples were treated with RNase and/or DNase at 2 μg/mL for one hour. For size fractionation, media samples were spun in 30 kDa Amicon ultracentrifugal filters (Millipore, Bedford, MA), and volumes were normalized by addition of fresh unconditioned NPC media. All experiments were performed in triplicate.
Two-dimensional gel electrophoresis
Two-dimensional gel electrophoresis (2-D DIGE) and the subsequent protein identification processes were performed by Applied Biomics, Inc (Hayward, CA), as previously described (Venkatesh et al., 2015). The procedure is summarized in brief below.
Sample preparation and CyDye labeling
Protein sample buffer was exchanged into 2-D cell lysis buffer (30 nM Tris-HCl, pH 8.8, containing 7 M urea, 2 M thiourea, and 4% CHAPS), and protein concentration was measured by the Bio-Rad protein assay method (Hercules, CA). Proteins were labeled with CyDye, and the labeled samples were mixed together. The 2x 2-D sample buffer (8 M urea, 4% CHAPS, 20 mg/mL DTT, 2% pharmalytes, and trace amount of bromophenol blue), 100 μL destreak solution and rehydration buffer (7 M urea, 2 M thiourea, 4% CHAPS, 20 mg/mL DTT, 1% pharmalytes, and trace amount of bromophenol blue) were added to the labeling mix.
IEF and SDS-PAGE
After loading the labeled samples, IEF (pH 3–10) was run according to the GE Healthcare protocol. The IPG strips were incubated in fresh equilibration buffer-1 (50 mM Tris-HCl, pH 8.8, containing 6 M urea, 30% glycerol, 2% SDS, trace amount of bromophenol blue and 10mg/mL DTT), and subsequently rinsed in fresh equilibration buffer-2 (50 mM Tris-HCl, pH 8.8, containing 6 M urea, 30% glycerol, 2% SDS, trace amount of bromophenol blue, and 45 mg/mL lodoacetamide) and SDS-gel running buffer. The strips were transferred into 12% SDS-gels, which were run at 15°C until the dye front ran out of the gels.
Image Scan and Analysis
Immediately after SDS-PAGE, gel images were scanned using Typhoon TRIO (GE Healthcare, Waukesha, WI). The images were analyzed by Image Quant software (version 6.0, GE Healthcare, Waukesha, WI), and quantitation analysis was done with DeCyder software (version 6.5, GE Healthcare, Waukesha, WI). In-gel DeCyder analysis was used to obtain the fold change of protein expression levels.
Protein identification by mass spectrometry
Spot picking and trypsin digestion
Based on the in-gel analysis and spot picking design by DeCyder software, spots of interest were picked up by Ettan Spot Picker (Amersham BioSciences, Piscataway, NJ). The gel spots were washed and digested with modified porcine trypsin protease (Trypsin Gold, Promega, Madison, WI). The digested tryptic peptides were desalted using Zip-tip C18 (Millipore, Bedford, MA), and the peptides were eluted using matrix solution (α-cyano-4-hydroxycinnamic acid 5 mg/mL in 50% acetonitrile, 0.1% trifluoroacetic acid, 25 mM ammonium bicarbonate) and spotted on the AB SCIEX MALDI plate (Opti-TOF 384 Well Insert, AB SCIEX, Framingham, MA).
Mass spectrometry
MALDI-TOF MS and TOF/TOF tandem MS/MS were performed using an AB SCIEX TOF/TOF 5800 System (AB SCIEX, Framingham, MA). In reflectron positive ion mode, MALDI-TOF mass spectra were acquired, with an average of 4000 laser shots per spectrum. For each sample, TOF/TOF tandem MS fragmentation spectra were acquired, with an average of 4000 laser shots per fragmentation spectrum on each of the 10 most abundant ions in each sample (excluding known background ions such as trypsin autolytic peptides).
Database search
The resulting peptide mass and associated fragmentation spectra were submitted to search the Swiss-Prot database via a GPS Explorer workstation equipped with MASCOT search engine (Matrix Science, Boston, MA). Searches were performed with no constraining protein molecular weight or isoelectric point, with variable oxidation of methionine and carbamidomethylation of cysteine residues, and with one missed cleavage allowed. Candidates with either ion C.I.% or protein score C.I.% greater than 95 were considered significant.
Recombinant proteins used
BCAN, PTN, SPARC, SPARCL1 (R&D Systems, Minneapolis, MN), GRP78 (Abcam, Cambridge, MA), HSP90B (Sigma-Aldrich, St. Louis, MO), IGFBP2, and IGFBP4 (PeproTech, Rocky Hill, NJ).
Size exclusion chromatography
Human SVZ neural precursor cell conditioned media was concentrated to 5 mg/mL using 15 kDa Amicon ultracentrifugal filters (Millipore, Bedford, MA), and subsequently centrifuged at 21,000 × g for 10 min. 500 uL of conditioned media was fractionated on a Superose 6 10/300 GL column (GE Healthcare, Waukesha, WI) via elution with 1.5 column volumes of gel filtration buffer (25 mM HEPES [pH 7.5], 150 mM NaCl, 1 mM DTT) at a flow rate of 0.25 mL/min and collecting 250 uL fractions. Each fraction was then analyzed by immunoblotting. The approximate molecular weights of the eluted proteins were determined by comparing with proteins of known molecular weight (Gel Filtration Calibration Kit; GE Healthcare, Waukesha, WI).
Immunoprecipitation
Immunoprecipitation reactions were conducted using the Pierce Crosslink Magnetic IP/Co-IP Kit (Thermo Scientific, Waltham, MA). 25 μL of Pierce Protein A/G Magnetic Beads per reaction were rinsed and incubated with 5 μg of antibody on a rotating platform for 15 minutes at room temperature. Antibodies used were: mouse anti-pleiotrophin (Santa Cruz Biotechnology, Santa Cruz, CA), rabbit anti-SPARC (Santa Cruz Biotechnology, Santa Cruz, CA), mouse anti-SPARCL1 (Santa Cruz Biotechnology, Santa Cruz, CA), rabbit anti-HSP90B (GeneTex, Irvine, CA), rabbit normal IgG (Santa Cruz Biotechnology, Santa Cruz, CA), and mouse normal IgG (Santa Cruz Biotechnology, Santa Cruz, CA). Beads were rinsed, and subsequently crosslinked to the antibodies using 0.02 mM DSS for 30 minutes at room temperature. Beads were washed and then incubated with a mixed combination of 250 μL neural precursor cell conditioned media and 250 μL IP lysis/wash buffer overnight at 4°C. The following morning, beads were washed, resuspended in Laemmli loading buffer, and boiled at 100°C for 5 minutes to release the bound antigens from the beads. Samples were loaded immediately onto Western blots for analysis of the bound antigens, or stored at −20°C for future analysis. For Western blot analysis, 2% of the input conditioned media was loaded, and 5% of the IP bound antigen samples were loaded.
For immunodepletion reactions, 100 μL of beads and 20 μg of antibody were used per reaction. Beads were incubated overnight with pure conditioned media, and subsequently, the beads as well as the unbound sample (the depleted conditioned media) were collected. The depleted conditioned media was used immediately in the Matrigel invasion assay, with an aliquot set aside for confirmation of depletion by Western blot. The rest of the procedure was performed as described above.
Western blot analysis
Conditioned media samples were mixed with Laemmli loading buffer (1:4) and boiled for 5 minutes at 100°C. Cells or tissue samples were lysed in RIPA buffer and protease inhibitors, incubated on ice for 30 minutes, and centrifuged for 15 minutes at 15,000 rpm at 4°C. Protein concentration in the lysates was determined using the BCA protein assay (Thermo Scientific, Waltham, MA). The protein concentration of the samples was normalized, and samples were mixed with Laemmli loading buffer (1:4) and boiled for 5 minutes at 100°C.
Samples were run on Bio-Rad Mini-Protean TGX precast gels (Bio-Rad, Hercules, CA), and the protein was transferred onto polyvinylidene fluoride (PVDF) membranes. Membranes were blocked with 5% bovine serum albumin (BSA) in TBST for 1 hour, and incubated in primary antibodies diluted in 1% BSA/TBST overnight at 4°C. Primary antibodies used were: mouse anti-pleiotrophin (1:100; Santa Cruz Biotechnology, Santa Cruz, CA), goat anti-SPARC (1:100; R&D Systems, Minneapolis, MN), goat anti-SPARCL1 (1:000; R&D Systems, Minneapolis, MN), rabbit anti-HSP90B (GeneTex, Irvine, CA), rabbit anti-GRP78 (1:500, Abcam, Cambridge, MA), rabbit anti-PTPRZ (Thermo Fisher, Waltham, MA), and rabbit beta-actin (1:2000; Cell Signaling, Danvers, MA). Secondary antibodies conjugated to horseradish peroxidase (HRP) were added for 1 hour at room temperature. Secondary antibodies used were: goat anti-rabbit IgG-HRP (Cell Signaling, Danvers, MA), horse anti-mouse IgG-HRP (Cell Signaling, Danvers, MA), and donkey anti-goat IgG-HRP (Santa Cruz Biotechnology, Santa Cruz, CA). Proteins were visualized using Clarity Western ECL Substrate (Bio-Rad, Hercules, CA).
Dissection of mouse SVZ and cortex
The SVZ and cortex were microdissected from P42 WT Bl6/CD1 mice. The SVZ was microdissected as described in Walker and Kempermann, 2014, and a piece of lateral cortex was taken far from the SVZ. Tissue samples were immediately homogenized in TRIzol Reagent for RNA extraction or in RIPA buffer for protein extraction.
qPCR
Cells or tissue were lysed and homogenized in TRIzol Reagent (Life Technologies, Carlsbad, CA) and RNA was extracted according to reagent protocol. RNA was treated with dsDNase, and cDNA was synthesized using Thermo Scientific Maxima First Strand cDNA Synthesis Kit for RT-qPCR with dsDNase (Thermo Fisher Scientific K1671). RT-PCR was performed on Eppendorf Mastercycler Realplex2 using Universal SYBR Green Supermix (BioRad, Hercules, CA). Differential expression was determined using the deltaCt method. Primers used were as follows:
Mouse Ptn forward: 5′ CTCTGCACAATGCTGACTGTC 3′; mouse Ptn reverse 5′ CTTTGACTCCGCTTGAGGCTT 3′; mouse Actb forward: 5′ GGCTGTATTCCCCTCCATCG
3′; mouse Actb reverse: 5′ CCAGTTGGTAACAATGCCATGT 3′; human PTPRZ1 forward: 5′ GCTTTGATGCGGACCGATTTT 3′; human PTPRZ1 reverse: 5′ ACGACTAACACTTTCGACTCCA 3′; human ACTB forward: 5′ 3′; human ACTB reverse: 5′ 3′.
shRNA-expressing lentivirus preparation and infection
shRNA constructs against human and mouse PTN, human SPARC, human SPARCL1, human and mouse HSP90B1, and human PTPRZ1 from the RNAi consortium human collection were purchased from Sigma (St. Louis, MO). 293T cells were co-transfected with the shRNA constructs and packaging plasmids (pDelta 8.92 + VSV-G) to generate lentiviral particles. Lentiviral particles were concentrated using the polyethylene glycol (PEG) precipitation method, resuspended in PBS, and stored at −80°C.
For lentiviral infection, DIPG cells or neural precursor cells were exposed to shRNA-expressing lentivirus for 48 hours. Puromycin was added 48 hours after infection to select for virally infected cells. After removal of puromycin, shRNA-treated neural precursor cells were grown for 7 days (with addition of media on day 3–4) for generation of conditioned media. After removal of puromycin, shRNA-treated DIPG cells were grown for at least one passage before experimental use.
RhoA and ROCK activation assays
SU-DIPG-XIII frontal lobe cells were starved in TSM base (without B27 (-A) supplement, heparin, or growth factors) for 48 hours prior to treatment. After treatment, cells were lysed in the RhoA activation assay kit cell lysis buffer (Cytoskeleton, Denver, CO). Lysates were incubated on ice for 1 minute, clarified by centrifugation at 10,000 × g, 4°C for 1 minute, and the supernatants were snap-frozen and stored immediately at −80°C. Protein concentrations were measured by the BCA protein assay (Thermo Scientific, Waltham, MA), and samples were diluted to 0.5 mg/mL by the addition of cell lysis buffer.
RhoA activation assays were performed using the G-LISA RhoA absorbance-based activation assay (Cytoskeleton, Denver, CO). Lysate samples were incubated in a 96-well plate with pre-linked Rho GTP-binding protein for 30 minutes at 4°C shaking at 400 rpm. Wells were incubated in anti-RhoA primary antibody (1:250) at room temperature for 45 minutes shaking at 400 rpm. Secondary HRP-labeled antibody (1:62.5) was added at room temperature for 45 minutes shaking at 400 rpm. Results were visualized by addition of HRP detection reagents for 12 minutes at 37°C, and the absorbance was read at 490 nm. All assays were performed in triplicate.
ROCK activation assays were performed using the Rho-associated kinase (ROCK) activity assay (Millipore, Bedford, MA). Cell lysates were incubated in wells of a myosin phosphatase target subunit 1 (MYPT1) pre-coated 96-well plate, for 30 minutes at 30°C with moderate shaking. Wells were incubated in anti-phospho-MYPT1(Thr696) primary antibody (1:1000) for 1 hour with moderate shaking. Goat anti-rabbit IgG HRP secondary antibody (1:2000) was added for 1 hour with moderate shaking. Results were visualized with TMB/E substrate, incubating in the dark for 10 minutes, and absorbance was read at 450 nm. All assays were performed in triplicate.
Pharmacologic inhibition
DIPG cells were treated with a dose curve of GSK 429286 (Tocris, Bristol, United Kingdom), GSK 269962A (a kind gift from Craig Thomas, National Center for Advancing Translational Sciences), or 17-AAG (SelleckChem, Houston, TX). All experiments using pharmacologic inhibitors used vehicle DMSO as a control.
Whole exome sequencing
Samples underwent sequencing on an Illumina HiSeq 2500 using Agilent’s v6 SureSelect whole exome capture set. Short read sequences from whole exome or whole genome sequencing were aligned to the hg19 assembly of the human genome using bwa. Following duplicate removal with Picard tools variants were called using the Genome Analysis toolkit according to standard Best Practices (Broad) including local re-alignment around Indels, downsampling and variant calling with the Unified Genotyper. Variants were annotated with the variant Effect predictor v74 from Ensembl tools and ANNOVAR to include annotations for variant allele frequency in 1000 genomes dbSNP v 132 and the ExAc database as well as functional annotation tools SIFT and Polyphen.
Coverage of aligned reads was binned into known exons with BEDTools and log2 ratios of median coverage in tumor and normal sequences were processed with in-house scripts. CBS binary segmentation was applied to each dataset to provide smoothed log2 ratios. Genes within common CNVs in normal individuals were excluded from further analysis with reference to the CNV map of the human genome. Exon-level median log ratios and smoothed values were thresholded to call gains and losses above and below log2 ratios of ±0.3 with a contig of ~1MB and amplifications and deletions above and below a threshold of ±1.5 with a minimum of 3 contiguous exons.
The accession number for whole exome sequencing data deposited in The European Genome-phenome Archive (EGA) database is EGAS00001002326.
RNA sequencing
RNA sequencing was performed as previously described (Nagaraja et al., 2017). Cells were lysed in TRIzol Reagent (Life Technologies, Carlsbad, CA) and RNA was extracted according to reagent protocol. 2 μg of total RNA was used for poly(A)+ purification using Dynabeads mRNA Purification Kit (Thermo Fisher Scientific 61006). mRNA was fragmented using RNA Fragmentation Reagent (Ambion AM8740) and purified using ethanol precipitation. First strand synthesis was performed with SuperScript II (Invitrogen 18064-014) followed by second strand synthesis using DNA Polymerase I (Invitrogen 18010-025) and RNaseH (Invitrogen 18021-014). cDNA was purified using MinElute PCR Purification Kit (Qiagen 28606).
Purified cDNA was end-repaired using T4 polymerase, Klenow fragment, and T4 PNK and then A-tailed using (exo-) Klenow. NEBNext Multiplex Oligo adaptors (New England BioLabs, E7335S) were ligated using Quick Ligation Kit (New England Biolabs, M2200L) overnight at RT. Adaptors were cut using USER Enzyme and adaptor-ligated libraries were purified by agarose gel electrophoresis. Libraries were amplified using NEBNext Multiplex Oligo primers and final libraries were purified using Ampure XP beads. Sequencing was performed on an Illumina NextSeq by Stanford Functional Genomics Facility.
Reads were aligned to the hg19 genome using tophat2 (Kim et al., 2013). Transcript abundance was calculated using featureCounts against a RefSeq gene annotation (Liao et al., 2014). Differential testing was done using DESeq2 with default median normalization (Love et al., 2014). Gene Ontology on upregulated genes was performed using Gene Ontology Consortium (Ashburner et al., 2000). Volcano plot was made in R.
RNA sequencing data are deposited in the GEO database: accession number GSE99812.
CellTiter-Glo assay
To assess cell viability, 5,000 DIPG cells per well were seeded in base media or conditioned media in a 96-well plate. Inhibitors were added at the appropriate concentrations. After 72 hours, CellTiter-Glo reagent 2.0 was added at a 1:1 ratio, and cells were lysed. Luminescence was measured after stabilization of signal for 10 minutes at room temperature.
QUANTIFICATION AND STATISTICAL ANALYSIS
Stereological cell counting
For quantification of DIPG invasion of the SVZ after knock down of targets in the SVZ, 5 NSG mice per group were injected with shRNA-expressing lentivirus in bilateral SVZs and orthotopically xenografted with SU-DIPG-XIII FL in the left pons. Mice were perfused for analysis 16 weeks after xenograft. A 1:6 series of coronal slices from each mouse brain was immunostained and imaged, and the number of GFP+ HNA+ glioma cells within 200 μm of the lateral ventricles in all slices containing lateral ventricles was manually counted.
For quantification of DIPG invasion of the SVZ in mice xenografted with PTPRZ1 knockdown DIPG cells or scrambled shRNA control cells, or in mice treated with 17-AAG or vehicle control, 8 NSG mice per group were orthotopically xenografted in the left pons. Mice were perfused for analysis 8 weeks after xenograft. A 1:6 series of coronal slices from each mouse brain was immunostained and imaged, and the number of GFP+ HNA+ glioma cells within 200 μm of the lateral ventricles in all slices containing lateral ventricles was manually counted.
For quantification of neural precursor cells in the SVZ after knock down of PTN in the SVZ, a 1:6 series of coronal slices from each mouse was immunostained and imaged, and the number of Sox2+ neural precursor cells in a 20x Z-stack was manually counted. The density of Sox2+ cells was calculated as cells/mm3.
Statistical analyses
All statistical analyses were performed using GraphPad Prism. The Shapiro-Wilk normality test was used to confirm Gaussian distribution for parametric analyses. For parametric datasets, unpaired two-tailed Student’s t-tests were used for comparisons between two samples, and group mean differences between more than two samples were assessed using one-way analysis of variance (one-way ANOVA) with Tukey or Dunnett post hoc tests to adjust for multiple comparisons. For nonparametric datasets, unpaired two-tailed Mann-Whitney tests were used for comparison between two samples. A level of p < 0.05 was used to determine significant differences.
DATA AND SOFTWARE AVAILABILITY
Patient-derived cell cultures
All patient-derived glioma cell cultures can be obtained through the Monje Lab with a materials transfer agreement with Stanford University. Contact Michelle Monje (mmonje@stanford.edu).
Sequencing data
All DNA and RNA sequence data are available through The European Genome-phenome Archive (EGA) database (EGAS00001002326) and GEO (GSE99812).
Raw data and statistics
Raw data and statistics for all non-sequencing data are available through Mendeley Data: https://data.mendeley.com/datasets/pbbsb6nx5f/draft?preview=1
ADDITIONAL RESOURCES
Not applicable
Supplementary Material
(A–B) Copy number plots of whole exome sequencing of DIPG cells isolated from the pons (A) and from an SVZ site of spread (B) from the same individual (SU-DIPG-XIII).
(C) Volcano plot of RNA sequencing comparing DIPG cells isolated from the pons and from an SVZ site of spread from SU-DIPG-XIII. X-axis represents log2(fold change) of frontal lobe over pons; y-axis shows -log10(Benjamini-Hochberg adjusted p-value) from differential testing. Points in red represent those with adjusted p-values less than 0.1.
(D) GO biological processes significantly overexpressed in the frontal lobe compared to the pontine culture of SU-DIPG-XIII. P-values shown are Bonferroni adjusted.
(E–H) H&E of tumor in the lateral wall of the lateral ventricle SVZ in SU-DIPG-XVII (E), SU-DIPG-III (F), and SU-DIPG-VI (G–H). Low magnification images are shown in the left panels: scale bar, 1 mm. High magnification images are shown in the right panels: scale bar, 50 μm.
(I) Pontine DIPG cells are found primarily in the hindbrain in orthotopic xenografts by bioluminescent IVIS imaging, compared to SVZ DIPG cells, which are found in the forebrain and hindbrain.
(A) DIPG cells invade differentially toward various combinations of the eight candidate recombinant proteins. The combination of PTN, SPARC, SPARCL1, and HSP90B most closely replicates the invasion-promoting effect toward SVZ hNPC CM.
(B) Estimation of the concentration of PTN, SPARC, SPARCL1, and HSP90B in SVZ hNPC CM by Western blot and ImageJ.
(C) The combination of PTN, SPARC, SPARCL1, and HSP90B is sufficient for DIPG invasion at 100nM as well as with each factor at its estimated concentration in the conditioned media.
(D) CHL-1 melanoma cells invade similarly toward unconditioned hNPC media, SVZ hNPC CM, and the combination of PTN, SPARC, SPARCL1, and HSP90B.
Experiments performed with n = 3 replicates/wells in SU-DIPG-XIII FL cells (A, C) or in CHL- 1 melanoma cells (D) and analyzed by one-way ANOVA with Tukey post hoc adjustment for multiple comparisons. Data shown as mean ± SEM. *p < 0.05, **p < 0.01.
(A) Expression of PTN, SPARC, SPARCL1, and HSP90B around the lateral ventricles in postnatal mice ages P0, 2, 5, 10, 14, and 21. PTN is more broadly expressed in the forebrain in P0-P5 mice, and becomes more restricted to the SVZ by P10. PTN is also expressed in the pia mater. SPARC, SPARCL1, and HSP90B are more broadly expressed in the brain.
(A) DIPG cells invade less toward SVZ hNPC CM after immunodepletion of any one of the four proteins, with or without add back of the other three proteins. Depletion of target proteins was confirmed by Western blot (see Figure 6A). n = 3 replicates/wells in SU-DIPG-XIII FL cells and analyzed by one-way ANOVA with Tukey post hoc adjustment for multiple comparisons.
(B) Tumor engraftment was equivalent in mice that received injections of shRNA lentivirus targeting Ptn into the SVZ, compared to a scrambled shRNA control. In vivo experiments were performed with n = 5 mice per group. Bioluminescent flux measurements were analyzed by unpaired, two-tailed Mann-Whitney test. Each data point = one mouse.
(C) Gene expression of the PTN receptor PTPRZ1 in DIPG primary tissue and cultures from published RNA-seq datasets and the present RNA-seq data from SU-DIPG-XIII (Grasso et al., 2015; Nagaraja et al., 2017). RNA-seq of the primary tissue was performed with one replicate. RNA-seq of the cell cultures were performed with two replicates.
(D) Exposure of DIPG cells to shRNA lentivirus targeting PTPRZ1 achieved effective knock down of PTPRZ1 gene expression as measured by qPCR, and of PTPRZ protein levels as measured by Western blot, compared to a scrambled shRNA control or no shRNA exposure. qPCR experiments performed with n = 3 wells of cells and analyzed by one-way ANOVA with Tukey post hoc adjustment for multiple comparisons.
(E) Knockdown of the PTN receptor PTPRZ1 in SU-DIPG-XIII FL cells resulted in a decrease in baseline DIPG invasion toward unconditioned hNPC media. n = 3 replicates/wells in SU-DIPG-XIII FL cells expressing PTPRZ1 or scrambled shRNA and analyzed by unpaired, two-tailed Student’s t-test.
(F) DIPG cells with knockdown of PTPRZ1 had a mild decrease in cell viability by the CellTiter-Glo assay compared to a scrambled control or no shRNA exposure. Cell viability was measured in base media without growth factors. n = 4 replicates/wells in SU-DIPG-XIII FL cells expressing PTPRZ1, scrambled, or no shRNA and analyzed by one-way ANOVA with Tukey post hoc adjustment for multiple comparisons.
(G) Knockdown of PTPRZ1 partially abrogates DIPG invasion toward SVZ hNPC CM or the PTN complex, compared to a scrambled control. n = 3 replicates/wells in SU-DIPG-XIII FL cells expressing PTPRZ1 or scrambled shRNA and analyzed by unpaired, two-tailed Student’s t-tests for comparison between PTPRZ1 knockdown cells or scrambled shRNA control cells.
(H–I) DIPG cells with knockdown of PTPRZ1 exhibited 10-fold decreased total tumor size indicating decreased engraftment (H), but similar tumor growth over time compared to scrambled shRNA control cells when orthotopically xenografted into mice (I).
(J) Fewer DIPG cells with knockdown of PTPRZ1 invaded the SVZ when orthotopically xenografted into mice, compared to scrambled shRNA control cells.
In vivo experiments were performed with n = 8 mice per group. Bioluminescent flux measurements were analyzed by unpaired, two-tailed Mann-Whitney test for engraftment (H) or unpaired, two-tailed Student’s t-test for growth (I). Stereological cell counts at 8 weeks following xenograft were analyzed by unpaired, two-tailed Mann-Whitney test (J). Each data point = one mouse.
Data shown as mean ± SEM. *p < 0.05, **p < 0.01, ***p < 0.001.
(A) Treatment of DIPG cells with an HSP90 inhibitor, 17-AAG, resulted in decreased invasion toward SVZ hNPC CM at high doses.
(B) Cell viability of DIPG cells treated with increasing doses of 17-AAG, by the CellTiter-Glo assay.
In vitro experiments performed with n = 3 replicates/wells (A) or n = 4 replicates/wells (B) in SU-DIPG-XIII FL cells and analyzed by one-way ANOVA with Tukey post hoc adjustment for multiple comparisons.
(C) Orthotopically xenografted mice that were treated with 17-AAG had no difference in the number of DIPG cells invading the SVZ compared to a vehicle treatment control. In vivo experiments were performed with n = 8 mice per group. Stereological cell counts at 8 weeks following xenograft were analyzed by unpaired, two-tailed Student’s t-test. Each data point = one mouse.
(D) Tumor engraftment was equivalent in mice that received injections of shRNA lentivirus targeting Hsp90b1 into the SVZ, compared to a scrambled shRNA control.
(E and G) Fewer orthotopically xenografted GFP+ HNA+ SU-DIPG-XIII FL cells invaded the SVZ, defined as a 200 μm-wide region adjacent to the lateral ventricles (outlined in dashed white lines), when sh-Hsp90b1 lentivirus (right), compared to a scrambled shRNA control (left), was injected into the SVZ. White filled arrowheads denote areas of strong HSP90B expression in the SVZ (left); open arrowheads denote similar regions with low HSP90B expression after knockdown (right). Scale bar, 200 μm. Control data are from the same mice as in Figures 6C, E; these knockdown experiments were run in parallel with a common control.
(F and H) The density of Sox2+ NPCs in the SVZ was equivalent in mice injected with lentivirus expressing sh-Hsp90b1 (right) or scrambled shRNA control (left). Scale bar, 50 μm. Control data are from the same mice as in Figures 6C, E; these knockdown experiments were run in parallel with a common control.
In vivo experiments (D–H) were performed with n = 5 mice per group. Bioluminescent flux measurements were analyzed by unpaired, two-tailed Mann-Whitney test (D). Stereological cell counts at 16 weeks following xenograft were analyzed by unpaired, two-tailed Student’s t-test. Each data point = one mouse (G–H).
Data shown as mean ± SEM. **p < 0.01, ***p < 0.001.
(A) shRNA-mediated knock down of PTPRZ1 in DIPG cells resulted in decreased activation of RhoA and ROCK upon exposure of DIPG cells to SVZ hNPC CM or to the PTN complex, compared to a scrambled shRNA control. n = 3 replicates/wells in SU-DIPG-XIII FL cells expressing PTPRZ1 or scrambled shRNA and analyzed by unpaired, two-tailed Student’s t-tests for comparison between PTPRZ1 knockdown cells or scrambled shRNA control cells.
(B–C) Treatment of DIPG cells with two ROCK inhibitors: GSK 429286 (B) or GSK 269962A (C) do not affect cell viability at sub-μM concentrations. All experiments performed with n = 4 replicates/wells in SU-DIPG-XIII FL cells and analyzed by one-way ANOVA with Tukey post hoc adjustment for multiple comparisons.
Data shown as mean ± SEM. *p < 0.05, **p < 0.01, ***p < 0.001.
(A) Cell proliferation of DIPG cells (fraction of Ki67+ cells) when exposed to unconditioned or conditioned mNPC media.
(B) Cell viability of DIPG cells by the CellTiter-Glo assay when exposed to unconditioned or conditioned mNPC media.
(C) DIPG cells invade less toward murine neuron conditioned media compared to SVZ mNPC CM.
All experiments performed with n = 3 replicates/wells (A, C) or n = 4 replicates/wells (B) in SU-DIPG-XIII FL cells and analyzed by one-way ANOVA with Tukey post hoc adjustment for multiple comparisons. Data shown as mean ± SEM. ***p < 0.001.
Highlights.
Glioma invasion into the SVZ depends on signals from neural precursor cells (NPCs)
Pleiotrophin (PTN) expression is highly enriched in the human and mouse SVZ
NPCs secrete PTN, HSP90, and SPARC/SPARCL1, which form a chemoattractant complex
The PTN complex activates RhoA/ROCK signaling in glioma cells, promoting invasion
Acknowledgments
The authors gratefully acknowledge support from the Childhood Brain Tumor Foundation, Lyla Nsouli Foundation, Unravel Pediatric Cancer, National Institute of Neurological Disorders and Stroke (R01NS092597), Liwei Wang Research Fund, Department of Defense (W81XWH-151-0131), McKenna Claire Foundation, Alex’s Lemonade Stand Foundation, The Cure Starts Now Foundation and DIPG Collaborative, N8 Foundation, California Institute for Regenerative Medicine (RN3-06510), V Foundation, Joey Fabus Childhood Cancer Foundation, Wayland Villars DIPG Foundation, Connor Johnson, Zoey Ganesh, and Declan Gloster Memorial Funds, Virginia and D.K. Ludwig Fund for Cancer Research, Child Health Research Institute at Stanford Anne T. and Robert M. Bass Endowed Faculty Scholarship in Pediatric Cancer and Blood Diseases, Cancer Research UK (C13468/A13982 and C13468/A23536).
Footnotes
Author contributions
Conceptualization, E.Y.Q. and M.M.; Methodology, E.Y.Q., P.K.J., and M.M.; Investigation, E.Y.Q., D.D.C., K.L.A., J.L., S.N., A.M., and H.V.; Writing – Original Draft, E.Y.Q. and M.M.; Writing – Review & Editing, E.Y.Q., J.L., S.N., P.K.J., and M.M.; Funding Acquisition, M.M.; Supervision, P.K.J. and M.M.
Publisher's Disclaimer: This is a PDF file of an unedited manuscript that has been accepted for publication. As a service to our customers we are providing this early version of the manuscript. The manuscript will undergo copyediting, typesetting, and review of the resulting proof before it is published in its final citable form. Please note that during the production process errors may be discovered which could affect the content, and all legal disclaimers that apply to the journal pertain.
References
- Aboody KS, Brown A, Rainov NG, Bower KA, Liu S, Yang W, Small JE, Herrlinger U, Ourednik V, Black PM, et al. Neural stem cells display extensive tropism for pathology in adult brain: Evidence from intracranial gliomas. Proc Natl Acad Sci. 2000;97:12846–12851. doi: 10.1073/pnas.97.23.12846. [DOI] [PMC free article] [PubMed] [Google Scholar]
- Adeberg S, König L, Bostel T, Harrabi S, Welzel T, Debus J, Combs SE. Glioblastoma recurrence patterns after radiation therapy with regard to the subventricular zone. Int J Radiat Oncol Biol Phys. 2014;90:886–893. doi: 10.1016/j.ijrobp.2014.07.027. [DOI] [PubMed] [Google Scholar]
- An JH, Lee SY, Jeon JY, Cho KG, Kim SU, Lee MA. Identification of Gliotropic Factors That Induce Human Stem Cell Migration to Malignant Tumor. J Proteome Res. 2009;8:2873–2881. doi: 10.1021/pr900020q. [DOI] [PubMed] [Google Scholar]
- Ashburner M, Ball CA, Blake JA, Botstein D, Butler H, Cherry JM, Davis AP, Dolinski K, Dwight SS, Eppig JT, et al. Gene Ontology: tool for the unification of biology. Nat Genet. 2000;25:25–29. doi: 10.1038/75556. [DOI] [PMC free article] [PubMed] [Google Scholar]
- Baker SJ, Ellison DW, Gutmann DH. Pediatric Gliomas as Neurodevelopmental Disorders. Glia. 2015:1–17. doi: 10.1002/glia.22945. [DOI] [PMC free article] [PubMed] [Google Scholar]
- Beaudoin GMJ, Lee SH, Singh D, Yuan Y, Ng YG, Reichardt LF, Arikkath J. Culturing pyramidal neurons from the early postnatal mouse hippocampus and cortex. Nat Protoc. 2012;7:1741–1754. doi: 10.1038/nprot.2012.099. [DOI] [PubMed] [Google Scholar]
- Blondet B, Carpentier G, Lafdil F, Courty J. Pleiotrophin Cellular Localization in Nerve Regeneration after Peripheral Nerve Injury. J Histochem Cytochem. 2005;53:971–977. doi: 10.1369/jhc.4A6574.2005. [DOI] [PubMed] [Google Scholar]
- Brose K, Bland KS, Wang KH, Arnott D, Henzel W, Goodman CS, Tessier-Lavigne M, Kidd T. Slit proteins bind Robo receptors and have an evolutionarily conserved role in repulsive axon guidance. Cell. 1999;96:795–806. doi: 10.1016/s0092-8674(00)80590-5. [DOI] [PubMed] [Google Scholar]
- Caretti V, Bugiani M, Freret M, Schellen P, Jansen M, van Vuurden D, Kaspers G, Fisher PG, Hulleman E, Wesseling P, et al. Subventricular spread of diffuse intrinsic pontine glioma. Acta Neuropathol. 2014;128:605–607. doi: 10.1007/s00401-014-1307-x. [DOI] [PMC free article] [PubMed] [Google Scholar]
- Chaichana KL, McGirt MJ, Frazier J, Attenello F, Guerrero-Cazares H, Quinones-Hinojosa A. Relationship of glioblastoma multiforme to the lateral ventricles predicts survival following tumor resection. J Neurooncol. 2008;89:219–224. doi: 10.1007/s11060-008-9609-2. [DOI] [PubMed] [Google Scholar]
- Chen L, Guerrero-Cazares H, Ye X, Ford E, McNutt T, Kleinberg L, Lim M, Chaichana K, Quinones-Hinojosa A, Redmond K. Increased Subventricular Zone Radiation Dose Correlates With Survival in Glioblastoma Patients After Gross Total Resection. Int J Radiat Oncol. 2013;86:616–622. doi: 10.1016/j.ijrobp.2013.02.014. [DOI] [PMC free article] [PubMed] [Google Scholar]
- Chen L, Chaichana KL, Kleinberg L, Ye X, Quinones-Hinojosa A, Redmond K. Glioblastoma recurrence patterns near neural stem cell regions. Radiother Oncol. 2015;116:294–300. doi: 10.1016/j.radonc.2015.07.032. [DOI] [PMC free article] [PubMed] [Google Scholar]
- Czubayko F, Schulte AM, Berchem GJ, Wellstein A. Melanoma angiogenesis and metastasis modulated by ribozyme targeting of the secreted growth factor pleiotrophin. Proc Natl Acad Sci U S A. 1996;93:14753–14758. doi: 10.1073/pnas.93.25.14753. [DOI] [PMC free article] [PubMed] [Google Scholar]
- Egorin MJ, Zuhowski EG, Rosen DM, Sentz DL, Covey JM, Eiseman JL. Plasma pharmacokinetics and tissue distribution of 17-(allylamino)-17-demethoxygeldanamycin (NSC 330507) in CD2F1 mice1. Cancer Chemother Pharmacol. 2001;47:291–302. doi: 10.1007/s002800000242. [DOI] [PubMed] [Google Scholar]
- Ehtesham M, Yuan X, Kabos P, Chung NHCC, Liu G, Akasaki Y, Black KL, Yu JS. Glioma Tropic Neural Stem Cells Consist of Astrocytic Precursors and Their Migratory Capacity Is Mediated by CXCR4. 2004;6:287–293. doi: 10.1593/neo.3427. [DOI] [PMC free article] [PubMed] [Google Scholar]
- Evers P, Lee PP, DeMarco J, Agazaryan N, Sayre JW, Selch M, Pajonk F. Irradiation of the potential cancer stem cell niches in the adult brain improves progression-free survival of patients with malignant glioma. BMC Cancer. 2010;10:384. doi: 10.1186/1471-2407-10-384. [DOI] [PMC free article] [PubMed] [Google Scholar]
- Furuta M, Shiraishi T, Okamoto H, Mineta T, Tabuchi K, Shiwa M. Identification of pleiotrophin in conditioned medium secreted from neural stem cells by SELDI-TOF and SELDI-tandem mass spectrometry. Dev Brain Res. 2004;152:189–197. doi: 10.1016/j.devbrainres.2004.06.014. [DOI] [PubMed] [Google Scholar]
- González-Castillo C, Ortuño-Sahagún D, Guzmán-Brambila C, Pallàs M, Rojas-Mayorquín AE. Pleiotrophin as a central nervous system neuromodulator, evidences from the hippocampus. Front Cell Neurosci. 2015;8:443. doi: 10.3389/fncel.2014.00443. [DOI] [PMC free article] [PubMed] [Google Scholar]
- Grasso CS, Tang Y, Truffaux N, Berlow NE, Liu L, Debily MA, Quist MJ, Davis LE, Huang EC, Woo PJ, et al. Functionally defined therapeutic targets in diffuse intrinsic pontine glioma. Nat Med. 2015;21:555–559. doi: 10.1038/nm.3855. [DOI] [PMC free article] [PubMed] [Google Scholar]
- Harroch S, Furtado GC, Brueck W, Rosenbluth J, Lafaille J, Chao M, Buxbaum JD, Schlessinger J. A critical role for the protein tyrosine phosphatase receptor type Z in functional recovery from demyelinating lesions. Nat Genet. 2002;32:411–414. doi: 10.1038/ng1004. [DOI] [PubMed] [Google Scholar]
- Hienola A, Pekkanen M, Raulo E, Vanttola P, Rauvala H. HB-GAM inhibits proliferation and enhances differentiation of neural stem cells. Mol Cell Neurosci. 2004;26:75–88. doi: 10.1016/j.mcn.2004.01.018. [DOI] [PubMed] [Google Scholar]
- Imitola J, Raddassi K, Park KI, Mueller FJFJ, Nieto M, Teng YD, Frenkel D, Li J, Sidman RL, Walsh CA, et al. Directed migration of neural stem cells to sites of CNS injury by the stromal cell-derived factor 1alpha/CXC chemokine receptor 4 pathway. Proc Natl Acad Sci U S A. 2004;101:18117–18122. doi: 10.1073/pnas.0408258102. [DOI] [PMC free article] [PubMed] [Google Scholar]
- Jafri NF, Clarke JL, Weinberg V, Barani IJ, Cha S. Relationship of glioblastoma multiforme to the subventricular zone is associated with survival. Neuro Oncol. 2013;15:91–96. doi: 10.1093/neuonc/nos268. [DOI] [PMC free article] [PubMed] [Google Scholar]
- Kidd T, Bland KS, Goodman CS. Slit is the midline repellent for the robo receptor in Drosophila. Cell. 1999;96:785–794. doi: 10.1016/s0092-8674(00)80589-9. [DOI] [PubMed] [Google Scholar]
- Kim D, Pertea G, Trapnell C, Pimentel H, Kelley R, Salzberg SL. TopHat2: accurate alignment of transcriptomes in the presence of insertions, deletions and gene fusions. Genome Biol. 2013;14:R36. doi: 10.1186/gb-2013-14-4-r36. [DOI] [PMC free article] [PubMed] [Google Scholar]
- Kinnunen A, Niemi M, Kinnunen T, Kaksonen M, Nolo R, Rauvala H. Heparan sulphate and HB-GAM (heparin-binding growth-associated molecule) in the development of the thalamocortical pathway of rat brain. Eur J Neurosci. 1999;11:491–502. doi: 10.1046/j.1460-9568.1999.00457.x. [DOI] [PubMed] [Google Scholar]
- Krellman JW, Ruiz HH, Marciano VA, Mondrow B, Croll SD. Behavioral and Neuroanatomical Abnormalities in Pleiotrophin Knockout Mice. PLoS One. 2014;9:e100597. doi: 10.1371/journal.pone.0100597. [DOI] [PMC free article] [PubMed] [Google Scholar]
- Lane TF, Sage EH. The biology of SPARC, a protein that modulates cell-matrix interactions. FASEB J. 1994;8:163–173. [PubMed] [Google Scholar]
- Lauri SE, Rauvala H, Kaila K, Taira T. Effect of heparin-binding growth-associated molecule (HB-GAM) on synaptic transmission and early LTP in rat hippocampal slices. Eur J Neurosci. 1998;10:188–194. doi: 10.1046/j.1460-9568.1998.00039.x. [DOI] [PubMed] [Google Scholar]
- Lee C, Hu J, Ralls S, Kitamura T, Loh YP, Yang Y, Mukouyama Y, Ahn S, Kriegstein A, Alvarez-Buylla A, et al. The Molecular Profiles of Neural Stem Cell Niche in the Adult Subventricular Zone. PLoS One. 2012;7:e50501. doi: 10.1371/journal.pone.0050501. [DOI] [PMC free article] [PubMed] [Google Scholar]
- Lee P, Eppinga W, Lagerwaard F, Cloughesy T, Slotman B, Nghiemphu PL, Wang PC, Kupelian P, Agazaryan N, Demarco J, et al. Evaluation of High Ipsilateral Subventricular Zone Radiation Therapy Dose in Glioblastoma: A Pooled Analysis. Int J Radiat Oncol. 2013;86:609–615. doi: 10.1016/j.ijrobp.2013.01.009. [DOI] [PubMed] [Google Scholar]
- Li X, Lee AYW. Semaphorin 5A and Plexin-B3 Inhibit Human Glioma Cell Motility through RhoGDI -mediated Inactivation of Rac1 GTPase. J Biol Chem. 2010;285:32436–32445. doi: 10.1074/jbc.M110.120451. [DOI] [PMC free article] [PubMed] [Google Scholar]
- Li S, Gao Y, Tokuyama T, Yamamoto J, Yokota N, Yamamoto S, Terakawa S, Kitagawa M, Namba H. Genetically engineered neural stem cells migrate and suppress glioma cell growth at distant intracranial sites. Cancer Lett. 2007;251:220–227. doi: 10.1016/j.canlet.2006.11.024. [DOI] [PubMed] [Google Scholar]
- Li YS, Milner PG, Chauhan AK, Watson MA, Hoffman RM, Kodner CM, Milbrandt J, Deuel TF. Cloning and expression of a developmentally regulated protein that induces mitogenic and neurite outgrowth activity. Science. 1990;250:1690–1694. doi: 10.1126/science.2270483. [DOI] [PubMed] [Google Scholar]
- Liao Y, Smyth GK, Shi W. featureCounts: an efficient general purpose program for assigning sequence reads to genomic features. 2014;30:923–930. doi: 10.1093/bioinformatics/btt656. [DOI] [PubMed] [Google Scholar]
- Lin GL, Monje M. A Protocol for Rapid Post-mortem Cell Culture of Diffuse Intrinsic Pontine Glioma (DIPG) J Vis Exp. 2017:e55360–e55360. doi: 10.3791/55360. [DOI] [PMC free article] [PubMed] [Google Scholar]
- Lin CC, Chen JT, Yang JS, Lu HF, Hsu SC, Tan TW, Lin YT, Ma YS, Ip SW, Wu JJ, et al. Danthron inhibits the migration and invasion of human brain glioblastoma multiforme cells through the inhibition of mRNA expression of focal adhesion kinase, Rho kinases-1 and metalloproteinase-9. Oncol Rep. 2009;22:1033–1037. doi: 10.3892/or_00000532. [DOI] [PubMed] [Google Scholar]
- Louis DN, Perry A, Reifenberger G, von Deimling A, Figarella-Branger D, Cavenee WK, Ohgaki H, Wiestler OD, Kleihues P, Ellison DW. The 2016 World Health Organization Classification of Tumors of the Central Nervous System: a summary. Acta Neuropathol. 2016;131:803–820. doi: 10.1007/s00401-016-1545-1. [DOI] [PubMed] [Google Scholar]
- Love MI, Huber W, Anders S. Moderated estimation of fold change and dispersion for RNA-seq data with DESeq2. Genome Biol. 2014;15:550. doi: 10.1186/s13059-014-0550-8. [DOI] [PMC free article] [PubMed] [Google Scholar]
- Lu KV, Jong KA, Kim GY, Singh J, Dia EQ, Yoshimoto K, Wang MY, Cloughesy TF, Nelson SF, Mischel PS. Differential Induction of Glioblastoma Migration and Growth by Two Forms of Pleiotrophin. J Biol Chem. 2005;280:26953–26964. doi: 10.1074/jbc.M502614200. [DOI] [PubMed] [Google Scholar]
- Maekawa M, Ishizaki T, Boku S, Watanabe N, Fujita A, Iwamatsu A, Obinata T, Ohashi K, Mizuno K, Narumiya S. Signaling from Rho to the actin cytoskeleton through protein kinases ROCK and LIM-kinase. Science. 1999;285:895–898. doi: 10.1126/science.285.5429.895. [DOI] [PubMed] [Google Scholar]
- McClain CR, Sim FJ, Goldman SA. Pleiotrophin Suppression of Receptor Protein Tyrosine Phosphatase-/Maintains the Self-Renewal Competence of Fetal Human Oligodendrocyte Progenitor Cells. J Neurosci. 2012;32:15066–15075. doi: 10.1523/JNEUROSCI.1320-12.2012. [DOI] [PMC free article] [PubMed] [Google Scholar]
- Mertsch S, Schmitz N, Jeibmann A, Geng JG, Paulus W, Senner V. Slit2 involvement in glioma cell migration is mediated by Robo1 receptor. J Neurooncol. 2008;87:1–7. doi: 10.1007/s11060-007-9484-2. [DOI] [PubMed] [Google Scholar]
- Mi R, Chen W, Hoke A. Pleiotrophin is a neurotrophic factor for spinal motor neurons. Proc Natl Acad Sci. 2007;104:4664–4669. doi: 10.1073/pnas.0603243104. [DOI] [PMC free article] [PubMed] [Google Scholar]
- Mistry AM, Hale AT, Chambless LB, Weaver KD, Thompson RC, Ihrie RA. Influence of glioblastoma contact with the lateral ventricle on survival: a meta-analysis. J Neurooncol. 2017a;131:125–133. doi: 10.1007/s11060-016-2278-7. [DOI] [PMC free article] [PubMed] [Google Scholar]
- Mistry AM, Dewan MC, White-Dzuro GA, Brinson PR, Weaver KD, Thompson RC, Ihrie RA, Chambless LB. Decreased survival in glioblastomas is specific to contact with the ventricular-subventricular zone, not subgranular zone or corpus callosum. J Neurooncol. 2017b doi: 10.1007/s11060-017-2374-3. [DOI] [PMC free article] [PubMed] [Google Scholar]
- Mitchison TJ, Cramer LP. Actin-based cell motility and cell locomotion. Cell. 1996;84:371–379. doi: 10.1016/s0092-8674(00)81281-7. [DOI] [PubMed] [Google Scholar]
- Monje M, Mitra SS, Freret ME, Raveh TB, Kim J, Masek M, Attema JL, Li G, Haddix T, Edwards MSB, et al. Hedgehog-responsive candidate cell of origin for diffuse intrinsic pontine glioma. Proc Natl Acad Sci U S A. 2011;108:4453–4458. doi: 10.1073/pnas.1101657108. [DOI] [PMC free article] [PubMed] [Google Scholar]
- Müller S, Kunkel P, Lamszus K, Ulbricht U, Lorente GA, Nelson AM, von Schack D, Chin DJ, Lohr SC, Westphal M, et al. A role for receptor tyrosine phosphataseξin glioma cell migration. Oncogene. 2003;22:6661–6668. doi: 10.1038/sj.onc.1206763. [DOI] [PubMed] [Google Scholar]
- Nagaraja S, Vitanza NA, Woo PJ, Taylor KR, Liu F, Zhang L, Li M, Meng W, Ponnuswami A, Sun W, et al. Transcriptional Dependencies in Diffuse Intrinsic Pontine Glioma. Cancer Cell. 2017;31:635–652. e6. doi: 10.1016/j.ccell.2017.03.011. [DOI] [PMC free article] [PubMed] [Google Scholar]
- Nakada M, Anderson EM, Demuth T, Nakada S, Reavie LB, Drake KL, Hoelzinger DB, Berens ME. The phosphorylation of ephrin-B2 ligand promotes glioma cell migration and invasion. Int J Cancer. 2010;126:1155–1165. doi: 10.1002/ijc.24849. [DOI] [PMC free article] [PubMed] [Google Scholar]
- Niisato K, Fujikawa A, Komai S, Shintani T, Watanabe E, Sakaguchi G, Katsuura G, Manabe T, Noda M. Age-Dependent Enhancement of Hippocampal Long-Term Potentiation and Impairment of Spatial Learning through the Rho-Associated Kinase Pathway in Protein Tyrosine Phosphatase Receptor Type Z-Deficient Mice. J Neurosci. 2005;25:1081–1088. doi: 10.1523/JNEUROSCI.2565.04.2005. [DOI] [PMC free article] [PubMed] [Google Scholar]
- Oellers P, Schröer U, Senner V, Paulus W, Thanos S. ROCKs are expressed in brain tumors and are required for glioma-cell migration on myelinated axons. Glia. 2009;57:499–509. doi: 10.1002/glia.20777. [DOI] [PubMed] [Google Scholar]
- Parri M, Chiarugi P. Rac and Rho GTPases in cancer cell motility control. Cell Commun Signal. 2010:8–23. doi: 10.1186/1478-811X-8-23. [DOI] [PMC free article] [PubMed] [Google Scholar]
- Pavlov I, Võikar V, Kaksonen M, Lauri SE, Hienola A, Taira T, Rauvala H. Role of heparin-binding growth-associated molecule (HB-GAM) in hippocampal LTP and spatial learning revealed by studies on overexpressing and knockout mice. Mol Cell Neurosci. 2002;20:330–342. doi: 10.1006/mcne.2002.1104. [DOI] [PubMed] [Google Scholar]
- Rauvala H, Pihlaskari R. Isolation and some characteristics of an adhesive factor of brain that enhances neurite outgrowth in central neurons. J Biol Chem. 1987;262:16625–16635. [PubMed] [Google Scholar]
- Rieger J, Wick W, Weller M. Human malignant glioma cells express semaphorins and their receptors, neuropilins and plexins. Glia. 2003;42:379–389. doi: 10.1002/glia.10210. [DOI] [PubMed] [Google Scholar]
- Salhia B, Rutten F, Nakada M, Beaudry C, Berens M, Kwan A, Rutka JT. Inhibition of Rho-kinase affects astrocytoma morphology, motility, and invasion through activation of Rac1. Cancer Res. 2005;65:8792–8800. doi: 10.1158/0008-5472.CAN-05-0160. [DOI] [PubMed] [Google Scholar]
- Sanai N, Tramontin AD, Quiñones-Hinojosa A, MBN, Gupta N, Kunwar S, Lawton MT, McDermott MW, Parsa AT, Garcia-Verdugo JM, et al. Unique astrocyte ribbon in adult human brain contains neural stem cells but lacks chain migration. Nat Lett. 2004;427:740–744. doi: 10.1038/nature02301. [DOI] [PubMed] [Google Scholar]
- Shimizu A, Nakayama H, Wang P, König C, Akino T, Sandlund J, Coma S, Italiano JE, Mammoto A, Bielenberg DR, et al. Netrin-1 promotes glioblastoma cell invasiveness and angiogenesis by multiple pathways including activation of RhoA, cathepsin B, and cAMP-response element-binding protein. J Biol Chem. 2013;288:2210–2222. doi: 10.1074/jbc.M112.397398. [DOI] [PMC free article] [PubMed] [Google Scholar]
- Sikkema AH, den Dunnen WFA, Hulleman E, van Vuurden DG, Garcia-Manero G, Yang H, Scherpen FJG, Kampen KR, Hoving EW, Kamps WA, et al. EphB2 activity plays a pivotal role in pediatric medulloblastoma cell adhesion and invasion. Neuro Oncol. 2012;14:1125–1135. doi: 10.1093/neuonc/nos130. [DOI] [PMC free article] [PubMed] [Google Scholar]
- Sim FJ, Lang JK, Waldau B, Roy NS, Schwartz TE, Pilcher WH, Chandross KJ, Natesan S, Merrill JE, Goldmanm SA, et al. Complementary patterns of gene expression by human oligodendrocyte progenitors and their environment predict determinants of progenitor maintenance and differentiation. Ann Neurol. 2006;59:763–779. doi: 10.1002/ana.20812. [DOI] [PubMed] [Google Scholar]
- Staflin K, Zuchner T, Honeth G, Darabi A, Lundberg C. Identification of proteins involved in neural progenitor cell targeting of gliomas. BMC Cancer. 2009;9:206. doi: 10.1186/1471-2407-9-206. [DOI] [PMC free article] [PubMed] [Google Scholar]
- Sumi T, Matsumoto K, Shibuya A, Nakamura T. Activation of LIM Kinases by Myotonic Dystrophy Kinase-related Cdc42-binding Kinase. J Biol Chem. 2001;276:23092–23096. doi: 10.1074/jbc.C100196200. [DOI] [PubMed] [Google Scholar]
- Tamura H, Fukada M, Fujikawa A, Noda M. Protein tyrosine phosphatase receptor type Z is involved in hippocampus-dependent memory formation through dephosphorylation at Y1105 on p190 RhoGAP. Neurosci Lett. 2006;399:33–38. doi: 10.1016/j.neulet.2006.01.045. [DOI] [PubMed] [Google Scholar]
- Tsirmoula S, Dimas K, Hatziapostolou M, Lamprou M, Ravazoula P, Papadimitriou E. Implications of pleiotrophin in human PC3 prostate cancer cell growth in vivo. Cancer Sci. 2012;103:1826–1832. doi: 10.1111/j.1349-7006.2012.02383.x. [DOI] [PMC free article] [PubMed] [Google Scholar]
- Ulbricht U, Brockmann MA, Aigner A, Eckerich C, Müller S, Fillbrandt R, Westphal M, Lamszus K, Muller S, Fillbrandt R, et al. Expression and function of the receptor protein tyrosine phosphatase zeta and its ligand pleiotrophin in human astrocytomas. J Neuropathol Exp Neurol. 2003;62:1265–1275. doi: 10.1093/jnen/62.12.1265. [DOI] [PubMed] [Google Scholar]
- Venkatesh HS, Johung TB, Caretti V, Noll A, Tang Y, Nagaraja S, Gibson EM, Mount CW, Polepalli J, Mitra SS, et al. Neuronal Activity Promotes Glioma Growth through Neuroligin-3 Secretion. Cell. 2015;161:803–816. doi: 10.1016/j.cell.2015.04.012. [DOI] [PMC free article] [PubMed] [Google Scholar]
- Walker TL, Kempermann G. One Mouse, Two Cultures: Isolation and Culture of Adult Neural Stem Cells from the Two Neurogenic Zones of Individual Mice. J Vis Exp. 2014:e51225–e51225. doi: 10.3791/51225. [DOI] [PMC free article] [PubMed] [Google Scholar]
- Wellstein A, Fang WJ, Khatri A, Lu Y, Swain SS, Dickson RB, Sasse J, Riegel AT, Lippman ME. A heparin-binding growth factor secreted from breast cancer cells homologous to a developmentally regulated cytokine. J Biol Chem. 1992;267:2582–2587. [PubMed] [Google Scholar]
- Wiech H, Buchner J, Zimmermann R, Jakob U. Hsp90 chaperones protein folding in vitro. Nature. 1992;358:169–170. doi: 10.1038/358169a0. [DOI] [PubMed] [Google Scholar]
- Wu H, Barusevicius A, Babb J, Klein-Szanto A, Godwin A, Elenitsas R, Gelfand JM, Lessin S, Seykora JT. Pleiotrophin expression correlates with melanocytic tumor progression and metastatic potential. J Cutan Pathol. 2005;32:125–130. doi: 10.1111/j.0303-6987.2005.00282.x. [DOI] [PubMed] [Google Scholar]
- Zhang L, Kundu S, Feenstra T, Li X, Jin C, Laaniste L, El Hassan TEA, Ohlin KE, Yu D, Olofsson T, et al. Pleiotrophin promotes vascular abnormalization in gliomas and correlates with poor survival in patients with astrocytomas. Sci Signal. 2015;8:ra125–ra125. doi: 10.1126/scisignal.aaa1690. [DOI] [PubMed] [Google Scholar]
- Zhou X, Ma L, Li J, Gu J, Shi Q, Yu R. Effects of SEMA3G on migration and invasion of glioma cells. Oncol Rep. 2012;28:269–275. doi: 10.3892/or.2012.1796. [DOI] [PubMed] [Google Scholar]
Associated Data
This section collects any data citations, data availability statements, or supplementary materials included in this article.
Supplementary Materials
(A–B) Copy number plots of whole exome sequencing of DIPG cells isolated from the pons (A) and from an SVZ site of spread (B) from the same individual (SU-DIPG-XIII).
(C) Volcano plot of RNA sequencing comparing DIPG cells isolated from the pons and from an SVZ site of spread from SU-DIPG-XIII. X-axis represents log2(fold change) of frontal lobe over pons; y-axis shows -log10(Benjamini-Hochberg adjusted p-value) from differential testing. Points in red represent those with adjusted p-values less than 0.1.
(D) GO biological processes significantly overexpressed in the frontal lobe compared to the pontine culture of SU-DIPG-XIII. P-values shown are Bonferroni adjusted.
(E–H) H&E of tumor in the lateral wall of the lateral ventricle SVZ in SU-DIPG-XVII (E), SU-DIPG-III (F), and SU-DIPG-VI (G–H). Low magnification images are shown in the left panels: scale bar, 1 mm. High magnification images are shown in the right panels: scale bar, 50 μm.
(I) Pontine DIPG cells are found primarily in the hindbrain in orthotopic xenografts by bioluminescent IVIS imaging, compared to SVZ DIPG cells, which are found in the forebrain and hindbrain.
(A) DIPG cells invade differentially toward various combinations of the eight candidate recombinant proteins. The combination of PTN, SPARC, SPARCL1, and HSP90B most closely replicates the invasion-promoting effect toward SVZ hNPC CM.
(B) Estimation of the concentration of PTN, SPARC, SPARCL1, and HSP90B in SVZ hNPC CM by Western blot and ImageJ.
(C) The combination of PTN, SPARC, SPARCL1, and HSP90B is sufficient for DIPG invasion at 100nM as well as with each factor at its estimated concentration in the conditioned media.
(D) CHL-1 melanoma cells invade similarly toward unconditioned hNPC media, SVZ hNPC CM, and the combination of PTN, SPARC, SPARCL1, and HSP90B.
Experiments performed with n = 3 replicates/wells in SU-DIPG-XIII FL cells (A, C) or in CHL- 1 melanoma cells (D) and analyzed by one-way ANOVA with Tukey post hoc adjustment for multiple comparisons. Data shown as mean ± SEM. *p < 0.05, **p < 0.01.
(A) Expression of PTN, SPARC, SPARCL1, and HSP90B around the lateral ventricles in postnatal mice ages P0, 2, 5, 10, 14, and 21. PTN is more broadly expressed in the forebrain in P0-P5 mice, and becomes more restricted to the SVZ by P10. PTN is also expressed in the pia mater. SPARC, SPARCL1, and HSP90B are more broadly expressed in the brain.
(A) DIPG cells invade less toward SVZ hNPC CM after immunodepletion of any one of the four proteins, with or without add back of the other three proteins. Depletion of target proteins was confirmed by Western blot (see Figure 6A). n = 3 replicates/wells in SU-DIPG-XIII FL cells and analyzed by one-way ANOVA with Tukey post hoc adjustment for multiple comparisons.
(B) Tumor engraftment was equivalent in mice that received injections of shRNA lentivirus targeting Ptn into the SVZ, compared to a scrambled shRNA control. In vivo experiments were performed with n = 5 mice per group. Bioluminescent flux measurements were analyzed by unpaired, two-tailed Mann-Whitney test. Each data point = one mouse.
(C) Gene expression of the PTN receptor PTPRZ1 in DIPG primary tissue and cultures from published RNA-seq datasets and the present RNA-seq data from SU-DIPG-XIII (Grasso et al., 2015; Nagaraja et al., 2017). RNA-seq of the primary tissue was performed with one replicate. RNA-seq of the cell cultures were performed with two replicates.
(D) Exposure of DIPG cells to shRNA lentivirus targeting PTPRZ1 achieved effective knock down of PTPRZ1 gene expression as measured by qPCR, and of PTPRZ protein levels as measured by Western blot, compared to a scrambled shRNA control or no shRNA exposure. qPCR experiments performed with n = 3 wells of cells and analyzed by one-way ANOVA with Tukey post hoc adjustment for multiple comparisons.
(E) Knockdown of the PTN receptor PTPRZ1 in SU-DIPG-XIII FL cells resulted in a decrease in baseline DIPG invasion toward unconditioned hNPC media. n = 3 replicates/wells in SU-DIPG-XIII FL cells expressing PTPRZ1 or scrambled shRNA and analyzed by unpaired, two-tailed Student’s t-test.
(F) DIPG cells with knockdown of PTPRZ1 had a mild decrease in cell viability by the CellTiter-Glo assay compared to a scrambled control or no shRNA exposure. Cell viability was measured in base media without growth factors. n = 4 replicates/wells in SU-DIPG-XIII FL cells expressing PTPRZ1, scrambled, or no shRNA and analyzed by one-way ANOVA with Tukey post hoc adjustment for multiple comparisons.
(G) Knockdown of PTPRZ1 partially abrogates DIPG invasion toward SVZ hNPC CM or the PTN complex, compared to a scrambled control. n = 3 replicates/wells in SU-DIPG-XIII FL cells expressing PTPRZ1 or scrambled shRNA and analyzed by unpaired, two-tailed Student’s t-tests for comparison between PTPRZ1 knockdown cells or scrambled shRNA control cells.
(H–I) DIPG cells with knockdown of PTPRZ1 exhibited 10-fold decreased total tumor size indicating decreased engraftment (H), but similar tumor growth over time compared to scrambled shRNA control cells when orthotopically xenografted into mice (I).
(J) Fewer DIPG cells with knockdown of PTPRZ1 invaded the SVZ when orthotopically xenografted into mice, compared to scrambled shRNA control cells.
In vivo experiments were performed with n = 8 mice per group. Bioluminescent flux measurements were analyzed by unpaired, two-tailed Mann-Whitney test for engraftment (H) or unpaired, two-tailed Student’s t-test for growth (I). Stereological cell counts at 8 weeks following xenograft were analyzed by unpaired, two-tailed Mann-Whitney test (J). Each data point = one mouse.
Data shown as mean ± SEM. *p < 0.05, **p < 0.01, ***p < 0.001.
(A) Treatment of DIPG cells with an HSP90 inhibitor, 17-AAG, resulted in decreased invasion toward SVZ hNPC CM at high doses.
(B) Cell viability of DIPG cells treated with increasing doses of 17-AAG, by the CellTiter-Glo assay.
In vitro experiments performed with n = 3 replicates/wells (A) or n = 4 replicates/wells (B) in SU-DIPG-XIII FL cells and analyzed by one-way ANOVA with Tukey post hoc adjustment for multiple comparisons.
(C) Orthotopically xenografted mice that were treated with 17-AAG had no difference in the number of DIPG cells invading the SVZ compared to a vehicle treatment control. In vivo experiments were performed with n = 8 mice per group. Stereological cell counts at 8 weeks following xenograft were analyzed by unpaired, two-tailed Student’s t-test. Each data point = one mouse.
(D) Tumor engraftment was equivalent in mice that received injections of shRNA lentivirus targeting Hsp90b1 into the SVZ, compared to a scrambled shRNA control.
(E and G) Fewer orthotopically xenografted GFP+ HNA+ SU-DIPG-XIII FL cells invaded the SVZ, defined as a 200 μm-wide region adjacent to the lateral ventricles (outlined in dashed white lines), when sh-Hsp90b1 lentivirus (right), compared to a scrambled shRNA control (left), was injected into the SVZ. White filled arrowheads denote areas of strong HSP90B expression in the SVZ (left); open arrowheads denote similar regions with low HSP90B expression after knockdown (right). Scale bar, 200 μm. Control data are from the same mice as in Figures 6C, E; these knockdown experiments were run in parallel with a common control.
(F and H) The density of Sox2+ NPCs in the SVZ was equivalent in mice injected with lentivirus expressing sh-Hsp90b1 (right) or scrambled shRNA control (left). Scale bar, 50 μm. Control data are from the same mice as in Figures 6C, E; these knockdown experiments were run in parallel with a common control.
In vivo experiments (D–H) were performed with n = 5 mice per group. Bioluminescent flux measurements were analyzed by unpaired, two-tailed Mann-Whitney test (D). Stereological cell counts at 16 weeks following xenograft were analyzed by unpaired, two-tailed Student’s t-test. Each data point = one mouse (G–H).
Data shown as mean ± SEM. **p < 0.01, ***p < 0.001.
(A) shRNA-mediated knock down of PTPRZ1 in DIPG cells resulted in decreased activation of RhoA and ROCK upon exposure of DIPG cells to SVZ hNPC CM or to the PTN complex, compared to a scrambled shRNA control. n = 3 replicates/wells in SU-DIPG-XIII FL cells expressing PTPRZ1 or scrambled shRNA and analyzed by unpaired, two-tailed Student’s t-tests for comparison between PTPRZ1 knockdown cells or scrambled shRNA control cells.
(B–C) Treatment of DIPG cells with two ROCK inhibitors: GSK 429286 (B) or GSK 269962A (C) do not affect cell viability at sub-μM concentrations. All experiments performed with n = 4 replicates/wells in SU-DIPG-XIII FL cells and analyzed by one-way ANOVA with Tukey post hoc adjustment for multiple comparisons.
Data shown as mean ± SEM. *p < 0.05, **p < 0.01, ***p < 0.001.
(A) Cell proliferation of DIPG cells (fraction of Ki67+ cells) when exposed to unconditioned or conditioned mNPC media.
(B) Cell viability of DIPG cells by the CellTiter-Glo assay when exposed to unconditioned or conditioned mNPC media.
(C) DIPG cells invade less toward murine neuron conditioned media compared to SVZ mNPC CM.
All experiments performed with n = 3 replicates/wells (A, C) or n = 4 replicates/wells (B) in SU-DIPG-XIII FL cells and analyzed by one-way ANOVA with Tukey post hoc adjustment for multiple comparisons. Data shown as mean ± SEM. ***p < 0.001.