

Abstract
Treatment of Syrian hamsters on the day of birth with the prototypical endocrine disruptor and synthetic estrogen, diethylstilbestrol (DES), leads to 100% occurrence of uterine hyperplasia/dysplasia in adulthood; a large proportion of which progress to neoplasia (endometrial adenocarcinoma). Consistent with our prior gene expression analyses at the mRNA and protein levels, we now report (based on microarray, real-time polymerase chain reaction, and in situ hybridization analyses) that progression of the neonatal DES-induced dysplasia/neoplasia phenomenon in the hamster uterus also includes a spectrum of microRNA expression alterations (at both the whole-organ and cell-specific level) that differ during the initiation (up-regulated miR-21, 200a, 200b, 200c, 29a, 29b, 429, 141; down-regulated miR-181a) and promotion (down-regulated miR-133a) stages of the phenomenon. The biological processes targeted by those differentially expressed miRNAs include Pathways in Cancer, Adherens Junctions; plus regulation of the cell cycle, apoptosis, and miRNA functions; all of which are consistent with our model system phenotype. These findings underscore the need for continued efforts to identify and assess both the classical genetic and the more recently recognized epigenetic mechanisms that truly drive this and other endocrine disruption phenomena.
Keywords: Diethylstilbestrol, Endocrine Disruption, Female Reproductive System, microRNA, Neoplasia, Uterus
1. INTRODUCTION
Diethylstilbestrol (DES), a potent synthetic estrogen and the prototypical endocrine disruptor, was prescribed to pregnant women beginning in the 1940’s in the mistaken belief that it would prevent miscarriages in both high-risk and normal pregnancies (Palmlund, 1996). It was withdrawn from the clinical scene in the 1970’s after the first published evidence of vaginal clear cell adenocarcinoma in a group of young women who were exposed to DES in utero (Herbst et al., 1971). Subsequently, numerous clinical and laboratory studies established that inappropriate exposure to DES and other endocrine-disrupting chemicals during the prenatal/neonatal period causes disruption of normal reproductive tract development and neoplasia (Ma, 2009, Marselos and Tomatis, 1992, Marselos and Tomatis, 1993, Reed and Fenton, 2013).
Our lab developed a model system based on the Syrian golden hamster, Mesocricetus auratus, to study endocrine disruption induced by neonatal exposure to DES and other agents (Hendry et al., 2002). Since the gestation period in hamsters is very predictable and short (16 days) compared to other rodents (18 to 21 days), treating them as neonates still targets the very early stages of reproductive tract development (Hendry et al., 1999). The Syrian hamster uterus is also particularly susceptible to the development of hyperplastic, dysplastic, and neoplastic lesions as a result of perinatal or neonatal DES-exposure (Rustia and Shubik, 1979). Indeed, we determined that such lesions are due to the fact that neonatal DES exposure directly and permanently disrupts early development of the hamster uterus (Initiation Stage) such that it responds abnormally later in life (Promotion Stage) to estrogenic stimulation (Alwis et al., 2011, Hendry et al., 1999, Hendry and Leavitt, 1993, Hendry et al., 2002, Hendry et al., 1997, Leavitt et al., 1982).
To probe the molecular elements involved in that teratogenic/neoplastic phenomenon, we first profiled the differential expression of genes at the mRNA and protein levels (Hendry et al., 2014). As expected, we detected differences in gene expression patterns at both the mRNA and protein levels that were distinct in the early initiation and later promotion stages of the neonatal DES-induced uterine disruption phenomenon. However, we also detected a large number of gene expression alterations at both stages that were not consistent between the mRNA and protein levels. The latter observation led us to hypothesize that alterations in micro RNA (miRNA) expression might be part of the process by which neonatal DES exposure induces estrogen-dependent dysplasia/neoplasia in the hamster uterus. Indeed, the results of our analyses here at both the whole-organ and tissue/cell-specific level do indicate that a range of miRNA genes are differentially expressed at both the initiation and promotion stages of this phenomenon.
2. MATERIALS AND METHODS
2.1. General Animal Information
Animals were maintained and treated in an Association for Assessment and Accreditation of Laboratory Animal Care (AAALAC)-accredited facility as authorized by the Wichita State University Institutional Animal Care and Use Committee (IACUC). All procedures including neonatal treatment, anesthesia, ovariectomy, chronic estrogen stimulation, sacrificing, and tissue collections followed IACUC-approved and established protocols (Alwis et al., 2011, Hendry et al., 2004, Hendry et al., 2014, Hendry et al., 2002). In all cases, tissue collections were performed at mid-day.
2.2. Neonatal Animal Treatment
Timed pregnant Syrian golden hamsters (Mesocricetus auratus) from Charles River Breeding Laboratories (Wilmington, MA) or Harlan Sprague Dawley, Inc. (Indianapolis, IN) were caged singly under a 14 h light:10 h dark photoperiod at 23–25° C with laboratory chow and water provided ad libitum. The chow was a 2:1 mixture of #5001 rodent diet and #5015 mouse diet from LabDiet (PMI Nutrition Int., Brentwood, MO). Within 6 h of birth (day 0), litter size was adjusted to eight neonates/litter by eliminating males and all animals in the litter were treated with a single s.c. injection of 50 μl corn oil vehicle either alone (control, CON) or containing 100 μg of DES. As acknowledged previously (Hendry et al., 2002), that dose level is high but not unreasonable considering that DES ingestion levels by women were as much as 150 mg daily and 18.2 g total during their pregnancy (Herbst et al., 1979); with the median total dose being 10.7 g (Anderson, 2004). It is also the dose level we previously used to establish, assess, and compare neonatal DES-induced disruption at the morphological and molecular levels in various regions of both the hamster female and male reproductive tracts (Alwis et al., 2011, Hendry et al., 2004, Hendry et al., 2014, Hendry et al., 2002, Hendry et al., 2006, Karri et al., 2004).
2.3. Prepubertal Procedures
On day 21 of life (~7 days prior to puberty), groups of control and neonatally DES-treated animals were bilaterally ovariectomized and began chronic estrogen stimulation by the s.c. insertion (between the shoulder blades) of a plugged Silastic (Dow Corning Corp., Midland, MI) tube (open lumen length, 1.0 cm; inner diameter, 1.57 mm; outer diameter, 2.41 mm) filled with crystalline estradiol-17β (E2). As established in previous studies (Alwis et al., 2011, Hendry et al., 2002), that protocol maintains serum E2 levels at ~200pg/ml out to at least 5 months of age.
2.4. Observational Staging
For the initiation stage (IS) samples, uteri were harvested from 5-day old intact animals. For the promotion stage (PS) samples, uteri were harvested from 2-month old animals that underwent the prepubertal ovariectomy and estrogen replacement procedure (OVEX+E2) described above. Regarding these time-point and treatment conditions: 1) They are based on extensive analyses of how neonatal DES-induced disruption progresses throughout the female hamster reproductive tract; and 2) They proved that the neonatal DES treatment protocol directly and permanently alters the developing hamster uterus (initiating event) such that it responds abnormally later in life (promoting event) to estrogen stimulation (Alwis et al., 2011, Hendry et al., 1999, Hendry et al., 2014, Hendry et al., 2002, Hendry et al., 1997).
2.5. Tissue Harvesting and Processing
To harvest tissues for both IS and PS samples, animals were anesthetized/asphyxiated with CO2, killed by decapitation, and excised horns were carefully trimmed under a dissecting microscope. Note that the treatment (CON, DES) and stage (IS, PS) groups stipulated above and below each consisted of uterine tissue samples harvested from non-litter-mate animals. For preparation of total RNA extracts (see below for further details), pools of whole uteri from IS animals and individual mid-uterine-horn segments from PS animals were immediately snap frozen on dry ice and cryostored at −80°C. For histological processing, mid-uterine-horn segments from both IS and PS groups of animals (derived from different individuals but from the same litter treatment groups used for the preparation of total RNA extracts) were immediately placed in fixative (4% paraformaldehyde in Dulbecco phosphate-buffered saline [PBS], pH 7.2) followed by two changes (24 hr each) of fresh fixative, stored in 70% ethanol, and ultimately embedded in paraffin (the block for IS samples contained 5 control and 5 DES-exposed uterine segments and the block for PS samples contained 5 control and 3 DES-exposed tissues) so as to generate transverse (cross) sections.
2.6. Total Tissue RNA Isolation
Total RNA populations from the IS and PS groups of uterine tissue samples were isolated using the Qiagen miRNeasy Mini kit (Qiagen Sample and Assay Technologies, Valencia, CA) that recommends a total input per preparation of ~50 mg tissue mass. Thus, because we consistently observe in 5-day old animals that total tissue mass of the hypertrophic uteri from DES-exposed animals are ~3× that of those from CON animals, the IS groups of tissue samples consisted of three pools of whole uteri that each contained 7 uteri from CON animals (34–43 mg tissue/pool) and 3 uteri from DES-exposed animals (45–52 mg tissue/pool). Also consistent with the kit input recommendation, the PS groups of tissue samples consisted of individual mid-uterine-horn segments (26–35 mg) from 3 CON and 3 DES-exposed animals.
Those groups of triplicate total uterine RNA populations were used for the Global miRNA Profiling and the Real-Time Polymerase Chain Reaction Assays described below. Quality control criteria for the isolated RNA samples included assessing the presence of 28S and 18S bands in a 1% agarose gel and a A260/280 ratio between 1.9–2.1 as recommended in the miRNeasy kit protocol. Integrity of the RNA samples was also analyzed using an Agilent Bioanalyzer 2100 (Agilent Technologies, Santa Clara, CA). The RNA integrity number (RIN) for the total RNA samples used in the current study ranged from 7.2 to 10.0 as required in the microarray protocol.
2.7. Global miRNA Profiling
Consistent with other studies that evaluated miRNA expression levels in cancer vs. normal cells (Lu et al., 2005, Lee et al., 2007, Volinia et al., 2006, Murakami et al., 2006, Yang et al., 2008), we used a high-throughput microarray analysis platform and analysis system (Thermo Scientific Dharmacon RNAi Discovery and Therapeutic Services) to screen global miRNA expression levels. The profiling consisted of two-color, high-density, 8-plex chips with probes able to capture all human, mouse, and rat mature miRNAs in the Sanger database. The resulting data then underwent the following statistical analysis. As noted above, each treatment factor analysis relied on triplicate total RNA samples prepared from Control (C) and DES (D)-exposed uterine tissues from both the IS and PS groups of animals. The relative intensity data was measured and statistically filtered. This resulted in detecting 645 miRNAs in the IS set and 635 miRNAs in the PS set. This data was annotated, normalized, and the log (2) ratio between the C and D groups was determined. Differential expression analysis was performed using textbook analysis of variance (ANOVA) with false discovery rate (FDR) multiple test correction which reports P* values. The result was formatted into linear transformed values that show changes with a P* value cut-off of 0.05.
2.8. Real-Time Quantitative Polymerase Chain Reaction Assays
We conducted TaqMan real-time quantitative polymerase chain reaction (RT-qPCR) miRNA assays (Applied Biosystems, Foster City, CA) to validate those miRNAs with fold changes ≥ 2 and statistically significant (p<0.05) differential expression in uterine RNA from neonatally DES-treated animals compared to control animals in both the IS and PS groups of samples, respectively. The procedure utilized a StepOne Plus Real Time PCR machine (Applied Biosystems, Foster City, CA). TaqMan miRNA assays were performed by following the manufacturer’s protocol.
Triplicate reactions were performed for each cDNA sample prepared from a total RNA preparation extracted from the control or DES-exposed uteri harvested from either the IS or PS groups of animals. As described above, each treatment group has three biological replicates. The PCR reaction was performed with an initial heating at 95° C for 10 min followed by 40 cycles of 95° C for 15 seconds and 60° C for 1 minute to obtain the amplification curve and CT value. The fluorescent threshold was automatically set by the StepOne software and the comparative CT (ΔΔCT) method was used to determine fold-change in gene expression levels. Each assay generated a CT value for the miRNA of interest that was normalized to the endogenous control, small nucleolar (sno)-RNA 202 (chosen based on consultation with Applied Biosystems tehnical representatives and their relevant application note [https://www3.appliedbiosystems.com/cms/groups/mcb_marketing/documents/generaldocuments/cms_044972.pdf ]), to calculate Δ CT values. Subsequently, ΔΔCT was calculated by subtracting Δ CT values of control from Δ CT values of DES-treated samples. The relative expression of each gene was analyzed by using the formula RQ = 2−ΔΔCT where the RQ of the calibrator was set to 1. Statistical significance was measured using Student t-test with a cut-off limit of p<0.05.
2.9. Histology and In Situ Hybridization
Uterine tube cross sections (4.5 μm) were deparaffinized in xylene and then rehydrated. For histology, sections underwent standard hematoxylin and eosin (H&E) staining. For in situ hybridization (ISH), sections were analyzed according to a protocol developed and optimized using a commercial kit (Exiqon miRCURY LNA microRNA ISH Optimization FFPE kit). It utilized double digoxigenin (DIG)-labeled locked nucleic acid (LNA) probes at 100 nm for the hybridization step. Detection of specific hybridization signals used an anti-DIG:alkaline phosphatase/4-nitro blue tetrazolium and 5-bromo-4-chloro-3′-indolephosphate (NBT-BCIP) system that deposits a dark blue reaction product. Note that the precise capillary gap provided by the ProbeOn Plus™ (Fisher Scientific, Waltham, MA) microscope slides used allowed us to simultaneously conduct all the above probing and detection steps on a face-to-face pair of slides (one with all the IS stage tissue sections [5 control and 5 DES-exposed] and the other one with all the PS stage tissue sections [5 control and 3 DES-exposed]) for a given anti-miRNA probe. Then, prior to adding coverslips, the pair of slides/sections received fast red nuclear counterstain that generates a light pink-colored product. All photomicrographs were captured using a Nikon Eclipse E800 microscope fitted with CFI Plan Apochromat objectives and a Nikon Digital/DSFi1 color camera linked to a NIS-Elements image analysis system. For all the results presented in Figs. 3–12, photomicrographs were taken at 20× magnification and scale bars represent 100 μm. Note that, for all the ISH results presented in Figs. 4–12, staining patterns were consistent among all the sections included for a given treatment (CON and DES) and stage (IS and PS) group.
Fig 3. Effects of neonatal DES exposure on histomorphology of the hamster uterus.

Shown are representative H&E-stained cross sections of control (CON, left panels) and neonatally DES-exposed (right panels) uteri from both Initiation Stage (IS; upper two panels) and Promotion Stage (PS: lower two panels) animals (also note that the same panel labeling system is used for Figs. 4–12). Indicated are the endometrial epithelial (E), stromal (S), and myometrial (M) tissue compartments plus glandular cysts (Cy). In IS animals, DES-exposed uteri are considerably larger, their luminal epithelium is more folded but does not yet form true glands, and their luminal epithelial cells are much taller (hypertrophy) compared to CON uteri. In PS animals, cystic glandular structures develop in all uteri (shown here only in the CON/PS uterus) but the DES-exposed uteri remain much larger (not shown here) and they are more hypertrophic and exhibit more severely disrupted histomorphology compared to control uteri. Specifically, the luminal and glandular epithelium in DES-exposed PS uteri are markedly hyperplastic to dysplastic because the cells are extremely tall, disorganized, overcrowded, and poorly demarcated from the underlying stroma. Furthermore, that epithelium appears “foamy” because it is riddled with infiltrating leukocytes and cavities that contain degenerating, apoptotic cells (some examples indicated by *) Scale bars in each panel here and in the following micrographs for Figs. 4 – 12 represent 100 μm.
Fig 12. miR-133a ISH.

Shown is mostly nuclear staining in both epithelial and stromal cell compartments. That staining is stronger in stromal cells but less strong in epithelial cells of the DES-exposed than the CON uterus from IS animals. However, it is less strong in both cell compartments of the DES-exposed than the CON uterus from PS animals.
Fig 4. SC (negative control) ISH.
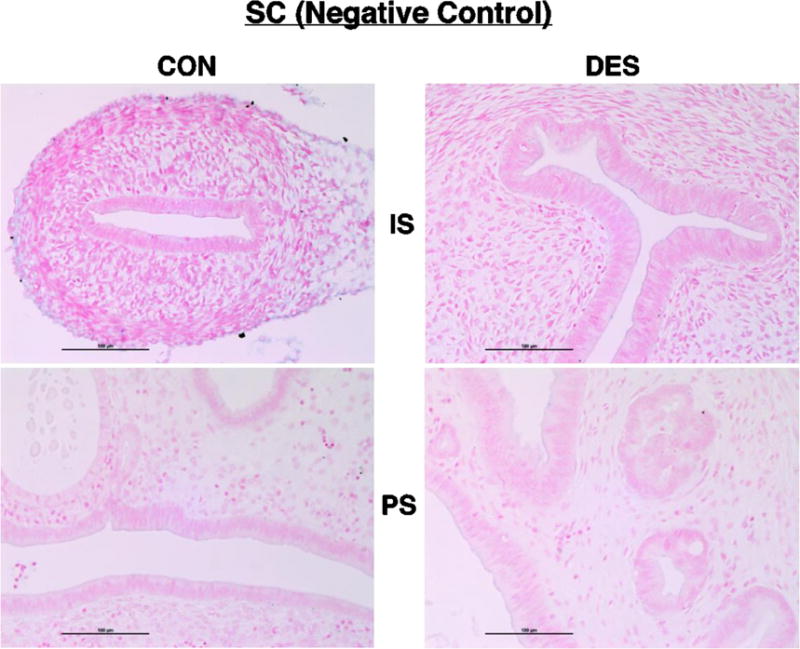
Shown here and in the following micrographs (Figs. 5 – 12) are representative results for cross sections of control (CON) or neonatally DES-exposed uteri from IS and PS animals following ISH processing with the indicated RNA probe and then staining with fast red nuclear counterstain. After incubation with the scrambled negative control probe (SC), note here the uniformly pink-counterstained nuclei and lack of blue reaction product in all four tissue sections.
2.9. Bioinformatics Methods
The list of up-regulated miRNA initiation stage genes was uploaded into the online Diana Tools MirPath v.3 tool. The human TarBase database was chosen and the pathways union option was used with default settings. The heatmap was selected and downloaded from there. GO analysis was done using the Gene Ontology Consortium web page tool. The union of all the TarBase gene targets from the up-regulated miRNA initiation stage genes was downloaded, copied, and pasted into the Gene Ontology Consortium web page with human biological processes chosen. On the list of GO-terms generated from that search, we focused on those with greater than three-fold enrichment.
3. RESULTS
3.1 MiRNA Profiling and Statistical Analysis
Good quality total RNA preparations from triplicate groups of control and neonatally DES-exposed uteri from both IS and PS animals were used for global miRNA profiling conducted by Thermo Scientific Dharmacon RDTS as described above. Analysis of that microarray profiling data (Supplementary Tables 1 and 2) indicated that, in the IS samples, the expression of eight miRNAs (miR-21, miR-200a, miR-200b, miR-200c, miR-29a, miR-29b, miR-429, and miR-141) was changed more than two-fold and significantly up-regulated while only one miRNA (miR-181a) had a significantly down-regulated fold change greater than 2 in the samples from DES-exposed compared to control uteri. In the PS samples, we found only one miRNA (miR-133a) with a significantly down-regulated fold change greater than 2 in the samples from DES-exposed compared to control uteri. Consistent with the approach introduced above, descriptions of results for the following analyses will refer to up-regulated (UR) or down-regulated (DR) effects in DES-exposed (D or DES) vs. control (C or CON) groups.
3.2. Validation by TaqMan RT-qPCR Assay
TaqMan RT-qPCR was used to validate the above differentially-expressed miRNAs that showed at least a 2-fold change in gene expression (Fig. 1). The TaqMan assays did confirm the direction of differential expression for all ten miRNAs but the degree of differential expression for three of them (29a, 29b, 181a) did vary considerably in the microarray vs. TaqMan assay results (Fig. 2). However, for all three of those miRNAs, the TaqMan assays indicated more dramatic expression differences than indicated by the microarray assays.
Fig 1. Relative expression of miRNAs detected using the TaqMan assay.

The X axis represents miRNAs that had 2-fold differential expression in control (CON) compared to neonatally DES-exposed (DES) uteri from initiation (I) or promotion (P) stage animals. For this analysis and that described for Fig. 2, each group had three biological replicates. The Y axis represents RQ values that were based on RQ = 2−ΔΔCT. The error bar represents standard error.
Fig 2. Comparison of microarray and TaqMan assays to show the fold-change differences in miRNA expression detected by those two methods.

The X axis represents the differentially expressed miRNAs in uteri from initiation (I) or promotion (P) stage animals. The Y axis represents the fold-change detected by microarray or TaqMan assay.
3.3. Histology and miRNA In Situ Hybridization
Representative histomorphology of the uteri used for this study is presented in Fig. 3 and the stage-specific morphological disruption effects shown there and in the following ISH analyses figures are consistent with those defined previously (Alwis et al., 2011, Hendry et al., 1999, Hendry et al., 2014, Hendry et al., 2002, Hendry et al., 1997). The results of most of our ISH analyses confirmed the patterns of altered miRNA expression detected at the whole organ extract level (Figs. 1 and 2). Those distinctive patterns at the tissue and cell-specific level are summarized below.
We observed uniformly pink-counterstained nuclei and a lack of blue reaction product in all tissue sections (Fig. 4) incubated with the scrambled negative control probe (SC). In contrast, the U6 small nuclear RNA positive control probe (Fig. 5) generated the expected strong and nuclear-specific reaction product (blue) in all tissue sections.
Fig 5. U6 (positive control) ISH.

Note here the strong, nuclear-specific staining (blue reaction product) in all four tissue sections.
For miR-21 (Fig. 6), 200b (Fig. 7), and 429 (Fig.8), we observed cytoplasmic and mostly epithelial cell staining localization that was UR in IS but not PS uteri. Also note that the staining pattern shown for miR-200b in Fig. 7 was similarly observed for another two family members (miR-200a, c; not shown).
Fig 6. miR-21 ISH.

Shown is cytoplasmic staining of epithelial cells that is stronger in the DES-exposed than the CON uterus from IS animals but not in those from PS animals.
Fig 7. miR-200b ISH.

Shown is cytoplasmic staining of epithelial cells that is stronger in the DES-exposed than the CON uterus from IS animals but not in those from PS animals.
Fig 8. miR-429 ISH.

Shown is cytoplasmic staining of epithelial cells that is stronger in the DES-exposed than CON uterus from IS animals but not in those from PS animals.
We observed distinct nuclear staining that was similarly UR in both epithelial and stromal cell compartments of IS uteri for miR-29a (Fig. 9). However, in PS uteri, overall nuclear staining levels were similar in both CON and DES-exposed groups but appeared less uniform in the stromal cell compartment of the DES-exposed than the CON group.
Fig 9. miR-29a ISH.

Shown is nuclear staining of both epithelial and stromal cells that is stronger in the DES-exposed than the CON uterus from IS animals but not in those from PS animals. Also, staining is less uniform in the stromal cell compartment of DES-exposed than CON uteri of PS animals.
For miR-141 (Fig. 10), another miR-200 family member (Feng et al., 2014, Korpal and Kang, 2008), we observed distinct nuclear staining of equivalent intensity in both epithelial and stromal cell compartments. Furthermore, overall intensity of that nuclear-specific staining pattern was UR in IS but not PS uteri.
Fig 10. miR-141 ISH.

Shown is nuclear staining of both epithelial and stromal cells that is stronger in the DES-exposed than the CON uterus from IS animals but not in those from PS animals.
For miR-181a (Fig. 11), we observed cytoplasmic staining in both epithelial and stromal cell compartments. Also, overall intensity of that cytoplasmic-specific staining pattern was DR in IS but not PS uteri.
Fig 11. miR-181a ISH.
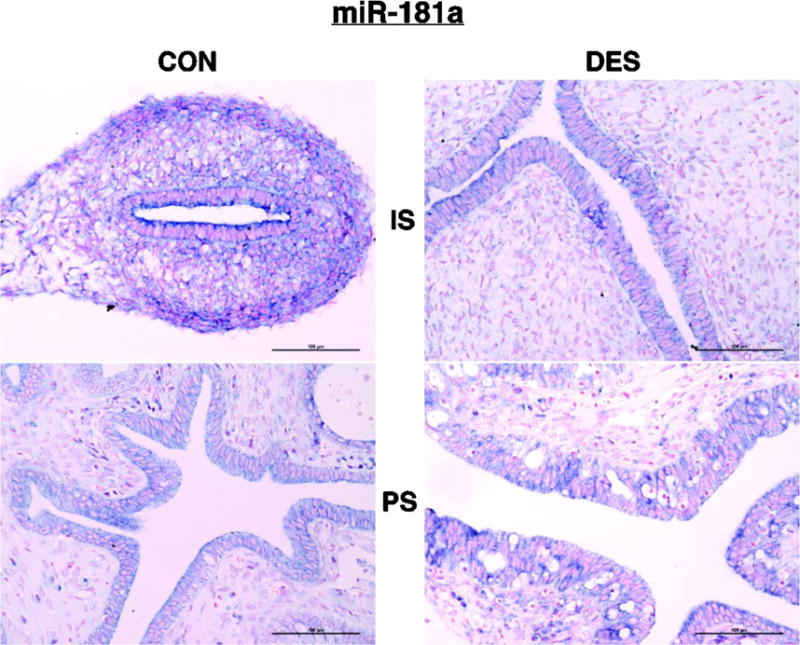
Shown is cytoplasmic staining of both epithelial and stromal cells that is less strong in the DES-exposed than the CON uterus from IS animals but not in those from PS animals.
For miR-133a (Fig. 12), the distinctive cell and tissue-specific staining pattern consisted of mostly nuclear signal that was: 1) DR in the epithelial cell compartment but UR in the stromal cell compartment of IS uteri; and 2) DR in both the epithelial and stromal cell compartments of PS uteri. Consequently, the overall signal levels matched that analyzed at the whole organ level (DR only in PS uteri). Lastly, the miR-29b probe did not generate a positive signal in any tissue section (not shown). This is likely due to the fact that the absolute expression levels of miR-29b according to TaqMan assays were very low in both the CON and DES-exposed groups of IS uteri.
3.4 Diana Tools MirPath v.3
We investigated the collective pathways of the differentially expressed miRNA’s targets using DianaTools MirPath v.3 with the Tarbase list of validated gene targets and the Gene Ontology (GO) Consortium enrichment tool. As shown in the heatmap (Fig. 13), the IS/UR miRNAs’ target genes function in the Kyoto encyclopedia of genes and genomes (KEGG) pathways that are involved in signaling and cancer. The two pathways in common with all those miRNAs are Pathways in Cancer and Adherens Junction; both of which are highly relevant to the uterine hypertrophy and cancer predisposition phenotype of our model system. We investigated the most enriched GO terms of the Tarbase-validated targets (Supplementary Table 3). Those GO terms primarily involve regulation of the cell cycle, apoptosis, and miRNA function; all of which are consistent with both the KEGG pathways noted above and our model system phenotype. The validated gene targets of the IS/DR miRNA (miR-181a) also include signaling and cancer pathways as well as miRNA regulation GO Terms. It is important to note that those targets/pathways are highly conserved between rodents and humans. Lastly, targets of the PS differentially expressed miRNA (miR-133a) did not include any enriched pathways in MirPath3. However, consistent with our finding that miR-133a was DR in PS uteri, another study implicated it as a tumor suppressor in endometrial cancer (Yamamoto et al., 2015).
Fig 13. MirPath 3 Heatmap.

The dendrogram to the left demonstrates similarities between miRNAs by enriched pathways generated from Tarbase targets. The darker the shade of red the more significantly enriched the pathway is for targets of the miRNA. The top dendrogram orders pathways based on the shared number of genes defining those pathways.
4. DISCUSSION
Using specific and sensitive miRNA microarray, TaqMan, and ISH assays, the current study complements our previous assessments (Hendry et al., 1999, Hendry et al., 2014, Hendry et al., 2006, Karri et al., 2004, Zheng and Hendry, 1997, Alwis et al., 2011) of mRNA and protein expression showing that neonatal exposure to the synthetic estrogen DES involves a spectrum of gene expression alterations at multiple levels. For instance, the number of miRNAs found to be differentially expressed at the two stages was quite different. Furthermore, our TaqMan assays validated the microarray results and they are considered more sensitive and more specific than microarray analyses because microarrays tend to produce greater background fluorescence intensity levels and they exhibit detection limits at both the upper and lower range levels for a given target sequence (Schmittgen et al., 2008, Schmittgen et al., 2004).
Importantly, our ISH analyses further confirmed most of those microarray and TaqMan assay results. They also revealed some distinctive target localization patterns at the tissue and cell-specific levels. However, interpretation of those patterns is difficult because localization information regarding many miRNAs is currently limited. For instance, our literature search failed to uncover any reports regarding the intracellular localization of miR-429 or miR-29a. For miR-21 that we found to be cytoplasmically localized, one study also reported its localization as cytoplasmic in lung cancer cells (Stenvold et al., 2014) but another one reported it as predominantly nuclear in pancreatic cancer cells (Dillhoff et al., 2008). For all three miR-200a, b, c family members that we also found to be cytoplasmically localized, another study reported them as nuclear localized in ovarian cancer cells (Cao et al., 2014). For miR-141 that we found to be nuclear localized, another study reported its localization in both the cytoplasm and nucleus of hepatocellular cancer and adjacent noncancerous cells (Liu et al., 2014). For miR-181a that we found to be cytoplasmically localized, another study reported the same intracellular localization pattern in colon cancer cells (Ji et al., 2014). For miR-133a, our detection of nuclear localization contrasts with other studies that reported its cytoplasmic localization in breast cancer (Wu et al., 2012) and bladder epithelial cells (Jia et al., 2013). Indeed, these observations buttress the emerging view that the localization and thus actions of specific miRNAs vary at multiple levels (cell/tissue type and intra/extracellular) (Leung, 2015).
Of the 43 elements found significantly UR in IS uteri, the difference for 8 of them: miR-21, miR-200 family (miR-141, miR-200a, miR-200b, miR-200c, and miR-429), miR-29a, and miR-29b, was more than two-fold. Of the 32 elements found significantly DR in IS uteri, only for miR-181a was the difference more than two-fold. Though 29 miRNAs were significantly UR in PS uteri, none of them reached the two-fold difference level and only miR-133a was 2-fold DR. This was unexpected based on the extensive degree of histopathology plus the spectrum of mRNA and protein expression alterations we observed in PS uteri (Alwis et al., 2011, Hendry et al., 2014, Hendry et al., 2002). However, the role(s) of individual miRNAs at all levels/aspects of carcinogenesis (basic biology, diagnosis, prognosis, therapy) resist(s) simple generalizations (Svoronos et al., 2016). That is exemplified by the following considerations of those miRNAs found differentially expressed in our experimental uterine dysplasia/neoplasia system.
The miR-21 gene is a multifaceted miRNA that acts as an oncogene by inhibiting various mRNAs that code for tumor suppressor proteins and it is UR in many cancers (Krichevsky and Gabriely, 2009). Expression profiling of 540 human samples representing 363 solid tumors and 177 normal samples confirmed that miR-21 expression is UR in all types of analyzed cancers including breast, lung, pancreas, colon, and stomach (Volinia et al., 2006). Mir-21 targets the programmed cell death tumor suppressor protein 4 (Pdcd4) and thereby induces proliferation, invasion, and metastasis in colorectal cancer (Asangani et al., 2008) and in renal cell carcinoma (Li et al., 2014). It also targets the phosphatase and tensin homolog (PTEN) tumor suppressor in non-small cell lung cancer (NSCLC) (Zhang et al., 2010), tropomyosin 1 (TPM-1) in MCF-7 breast cancer cells (Zhu et al., 2007), and both PTEN and Pdcd4 in human cholangiocarcinoma (Liu et al., 2012b). The UR of miR-21 by more than two-fold at the initiation stage strongly supports its role in the DES-induced dysplasia/neoplasia phenomenon.
The miR-29 family has diverse roles in cancer (Jiang et al., 2014) and two members, miR-29a and miR-29b, were UR in our model system. For the miR-29a gene, there is a report that it negatively regulates tristetraprolin (TTP), a protein that degrades mRNAs with AU-rich 3′-untranslated regions (UTRs), and that its over expression led to increased epithelial-mesenchymal transition (EMT) and metastasis (Gebeshuber et al., 2009). However, it is not clear how that finding relates to the observations reported here regarding overall miR-29a expression levels and its mostly nuclear localization in our experimental system.
The miR-200 family includes miR-200a/b/c, miR-429, and miR-141 that are located in two gene clusters (Korpal and Kang, 2008). These family members are deregulated in several cancers (Feng et al., 2014) and, because they are UR in some (Snowdon et al., 2011, Yu et al., 2010, Cao et al., 2014) and DR in others (Paterson et al., 2013, Cong et al., 2013, Saydam et al., 2009), their role in tumorigenesis appears to be pleiotropic. The expression of miR-200 family members is directly correlated with the ability of tumor cells to metastasize by regulating expression of the transcription factors zinc finger E-box binding homeobox (ZEB)1 and ZEB2 (the latter was DR at the mRNA level in IS uteri (Hendry et al., 2014)) that are involved in EMT (Peter, 2009, Cano and Nieto, 2008). Also relevant to this topic, they are generally thought to maintain E-cadherin expression in epithelial cells (Burk et al., 2008, Korpal and Kang, 2008, Park et al., 2008) and thereby counter epithelial cancer invasion and metastasis (Acloque et al., 2009, Thiery et al., 2009) in general and endometrial carcinosarcoma in particular (Castilla et al., 2011). However, altered expression of E-cadherin, both UR and DR, is linked to various stages of carcinogenesis (Rodriguez et al., 2012). Indeed, we detected UR of all five miR-200 family members only in IS uteri plus we detected UR of E-cadherin expression at the protein level only in PS uteri (Hendry et al., 2014). Furthermore, in both IS and PS uteri, we detected no change in expression of vimentin (Hendry et al., 2014), a recognized mesenchymal cell/tissue marker protein (Rodriguez et al., 2012). Lastly, the observed localization pattern in both IS and PS uteri differed among the miRNA family members (cytoplasmic in epithelial cells for miR-200a, b, c and miR-429; but nuclear in epithelial and stromal cells for miR-141). Clearly then, the mechanistic linkage between miR-200 family expression and EMT dynamics in our experimental system deserves further investigation.
Deregulated expression of miR-181a is found in many cancers (Wei et al., 2014, Pichler et al., 2014). However, like other miRNAs, its role remains unclear because it is inconsistently regulated in different cancer types. For instance, it has a tumor-suppressive effect in oral squamous cell carcinoma by inhibiting the K-ras oncogene (Shin et al., 2011). On the other hand, it acts as an oncogenic miRNA by negatively regulating the tumor suppressor PTEN and increasing lactate production and cell proliferation in human colon cancer (Wei et al., 2014). It also contributes to ovarian cancer progression by inducing invasiveness via EMT (Parikh et al., 2014). A recent study on the role of miR-181a in endometrial carcinogenesis showed that it directly targets progesterone receptor (PR) expression (Panda et al., 2012). Our findings regarding altered expression of PR (Hendry et al., 2014) and miR-181a (present study) during progression of the neonatal DES-induced dysplasia/neoplasia phenomenon in the hamster uterus do not fit simply with that study. More specifically, in IS uteri, we did detect UR of PR (Hendry et al., 2014) and DR of miR-181a expression (present study) but, in PS uteri, we detected DR of PR (Hendry et al., 2014) without a significant change in miR-181a expression (present study). It is also noteworthy that, while the tissue-specific PR immunostaining pattern differed among the uterine groups (consistently nuclear but present: 1) only in epithelial cells of CON/IS uteri, 2) in both epithelial and stromal cells of DES/IS and CON/PS uteri, and 3) only in stromal cells of DES/PS uteri) (Hendry et al., 2014), the tissue-specific miR-181a ISH staining pattern did not differ (cytoplasmic in both epithelial and stromal cells of all four uterine groups [present study]). Thus, the mechanistic linkage between PR and miR-181a expression in our experimental system is neither clear nor simple. Also contributing to the complexity of endocrine:miRNA dynamics is the evidence that: 1) PR and estrogen receptor α (ERα) play reciprocal roles in the regulation of miRNA expression in cancers (Cochrane et al., 2011); and 2) estradiol, ERα, and progesterone regulate miRNA biogenesis by both inducing and repressing various intermediate stages of the miRNA transcript maturation process (Faggad et al., 2010, Cheng et al., 2009, Grelier et al., 2009, Nothnick et al., 2010).
MiR-133a is a tumor suppressor miRNA that targets a number of factors in various cancer types including the epidermal growth factor receptor (EGFR)/Akt pathway in breast cancer (Cui et al., 2013), insulin-like growth factor 1 receptor (IGF1R) in ovarian cancer (Guo et al., 2014), and Fascin-1 in colorectal (Zheng et al., 2015) and pancreatic cancer (Qin et al., 2013). It also influences metastasis and cell proliferation in colorectal cancer by targeting the LIM and SH3 protein 1 (LASP1) proteins and it suppresses the phosphorylation of proteins in the mitogen-activated protein kinase (MAPK) pathway (Wang et al., 2013). While our observation of DR miR-133a expression in PS uteri is consistent with the above reports, our observation of miRNA-localization in the hamster uterus (nuclear) contrasts with that reported in other tissues (cytoplasmic) (Jia et al., 2013, Wu et al., 2012). Thus, this is another case where the full mechanistic roles and consequences of our current findings deserve further investigation. Indeed, the role of miRNAs in endometrial cancer is receiving enhanced attention at both the experimental and clinical level but a consensus expression signature is not yet available (Li et al., 2015).
As indicated above in Section 3.4 and acknowledged elsewhere, several methods are available to predict and validate the specific interactions between a given miRNA and its corresponding mRNA target (Thomson et al., 2011, Vlachos and Hatzigeorgiou, 2013). However, they can produce very different outcomes because the relevant algorithms differ in sensitivity and precision (Alexiou et al., 2009, Liu et al., 2012a, Peterson et al., 2014). Also, the fact that a single miRNA can target hundreds of specific mRNAs (Lewis et al., 2003, Kim and Nam, 2006) vastly complicates the determination of their function at the in vivo level (Vidigal and Ventura, 2015). For all these reasons, the exact mechanistic implications of the observations reported here are not yet clear. Fortunately, novel and improved means to identify and validate miRNA targets are now emerging (Imig et al., 2015, Xie et al., 2015).
5. SUMMARY AND CONCLUSIONS
Consistent with our prior results from gene expression analyses at the mRNA and protein levels (Hendry et al., 2014, Hendry et al., 2002), progression of the neonatal DES-induced dysplasia/neoplasia phenomenon in the hamster uterus also includes a spectrum of miRNA expression alterations that differ during the initiation (UR of miR-21, 200a, 200b, 200c, 29a, 29b, 429, 141; DR of miR-181a) vs. promotion (DR of miR-133a) stages of the phenomenon. Not surprisingly, the cellular/molecular processes that are most consistently linked with that disruption phenomenon include EMT dynamics, cell cycle control, and apoptosis. It is also important to note that those linkages among fundamental regulatory pathways strengthen the value of network biology-based study approaches to improve cancer diagnosis, prognosis, and therapy (Bracken et al., 2016). As such, all these findings underscore the need for continued efforts to unravel both the classical genetic and the more recently recognized epigenetic mechanisms that truly drive this and other endocrine disruption phenomena. Also along those lines, an emerging paradigm involves the presence of tumor-derived miRNAs in the blood that were recently discovered and proposed as promising new diagnostic and prognostic markers for human cancers (Aleckovic and Kang, 2015, Braicu et al., 2015, D’Angelo et al., 2016, Mitchell et al., 2008). In addition, circulation-based mechanisms of transgenerational epigenetic inheritance are now receiving much attention (Sharma, 2015). In our experimental system, we are now developing strategies to follow up the organ-based assessment of altered miRNA expression with assessments conducted in serum samples from hamsters at various ages following neonatal DES treatment. We feel that such information will provide key new insights into the roles played by these small nucleic acids in the neonatally DES-induced uterine dysplasia/neoplasia phenomenon.
Supplementary Material
Acknowledgments
We express our sincere thanks to the microarray facility, University of Kansas Medical Center, Kansas City, Kansas for assessing the quality of the total RNA samples. We also thank Thermo Scientific Dharmacon RDTS for their technical support and effective profiling services.
Grant support: This work was supported by the Flossie E. West Foundation, by the KIDDRC grant NICHD HD 002528, and by Grants #P20 RR016475 from the National Center for Research Resources and #P20 GM103418 from the National Institute of General Medical Sciences. The latter two programs supported a host of undergraduate research scholars (Vinh Vu, Catherine Wall, Elka Garcia, Justin Sullivan, and Ariel Fluharty) that contributed to the in situ hybridization analysis component of this report. Portions of this work also appeared in the thesis submitted by Ramesh Padmanabhan in partial fulfillment of the MS degree in Biological Sciences at Wichita State University.
Abbreviations
- AAALAC
Association for Assessment and Accreditation of Laboratory Animal Care
- ANOVA
analysis of variance
- C and CON
control
- D
DES
- DES
diethylstilbestrol
- DIG
digoxigenin
- DR
down-regulated
- E2
estradiol-17β
- EGFR
epidermal growth factor receptor
- EMT
epithelial-mesenchymal transition
- ERα
estrogen receptor α
- FDR
false discovery rate
- GO
gene ontology
- H&E
hematoxylin and eosin, IACUC, Institutional Animal Care and Use Committee
- IGF1R
insulin-like growth factor 1 receptor
- IS
initiation stage
- ISH
in situ hybridization
- KEGG
Kyoto encyclopedia of genes and genomes
- LASP1
LIM and SH3 protein 1
- LNA
locked nucleic acid
- MAPK
mitogen-activated protein kinase
- miRNA
microRNA
- NBT-BCIP
4-nitro blue tetrazolium and 5-bromo-4-chloro-3′-indolephosphate
- NSCLC
non-small cell lung cancer
- OVEX+E2
ovariectomy and estrogen replacement
- PBS
phosphate-buffered saline
- Pdcd4
programmed cell death protein 4
- PR
progesterone receptor
- PS
promotion stage
- PTEN
phosphatase and tensin homolog
- RIN
RNA integrity number
- RT-qPCR
real-time quantitative polymerase chain reaction
- SC
scrambled negative control probe
- sno
small nucleolar
- TPM-1
tropomyosin 1
- TTP
tristetraproline
- UR
up-regulated
- UTRs
untranslated regions
- ZEB
zinc finger E-box binding homeobox
Footnotes
Conference presentation: Presented in part at the 42nd (2009; Abst. #101) and 46th (2013; Abst. #359) Annual Meetings of the Society for the Study of Reproduction.
References
- ACLOQUE H, ADAMS MS, FISHWICK K, BRONNER-FRASER M, NIETO MA. Epithelial-mesenchymal transitions: the importance of changing cell state in development and disease. J Clin Invest. 2009;119:1438–49. doi: 10.1172/JCI38019. [DOI] [PMC free article] [PubMed] [Google Scholar]
- ALECKOVIC M, KANG Y. Regulation of cancer metastasis by cell-free miRNAs. Biochim Biophys Acta. 2015;1855:24–42. doi: 10.1016/j.bbcan.2014.10.005. [DOI] [PMC free article] [PubMed] [Google Scholar]
- ALEXIOU P, MARAGKAKIS M, PAPADOPOULOS GL, RECZKO M, HATZIGEORGIOU AG. Lost in translation: an assessment and perspective for computational microRNA target identification. Bioinformatics. 2009;25:3049–55. doi: 10.1093/bioinformatics/btp565. [DOI] [PubMed] [Google Scholar]
- ALWIS ID, MARONI DM, HENDRY IR, ROY SK, MAY JV, LEAVITT WW, HENDRY WJ. Neonatal diethylstilbestrol exposure disrupts female reproductive tract structure/function via both direct and indirect mechanisms in the hamster. Reprod Toxicol. 2011;32:472–83. doi: 10.1016/j.reprotox.2011.09.006. [DOI] [PMC free article] [PubMed] [Google Scholar]
- ANDERSON LM. Predictive values of traditional animal bioassay studies for human perinatal carcinogenesis risk determination. Toxicol Appl Pharmacol. 2004;199:162–74. doi: 10.1016/j.taap.2004.02.008. [DOI] [PubMed] [Google Scholar]
- ASANGANI IA, RASHEED SA, NIKOLOVA DA, LEUPOLD JH, COLBURN NH, POST S, ALLGAYER H. MicroRNA-21 (miR-21) post-transcriptionally downregulates tumor suppressor Pdcd4 and stimulates invasion, intravasation and metastasis in colorectal cancer. Oncogene. 2008;27:2128–36. doi: 10.1038/sj.onc.1210856. [DOI] [PubMed] [Google Scholar]
- BRACKEN CP, SCOTT HS, GOODALL GJ. A network-biology perspective of microRNA function and dysfunction in cancer. Nat Rev Genet. 2016;17:719–732. doi: 10.1038/nrg.2016.134. [DOI] [PubMed] [Google Scholar]
- BRAICU C, TOMULEASA C, MONROIG P, CUCUIANU A, BERINDAN-NEAGOE I, CALIN GA. Exosomes as divine messengers: are they the Hermes of modern molecular oncology? Cell Death Differ. 2015;22:34–45. doi: 10.1038/cdd.2014.130. [DOI] [PMC free article] [PubMed] [Google Scholar]
- BURK U, SCHUBERT J, WELLNER U, SCHMALHOFER O, VINCAN E, SPADERNA S, BRABLETZ T. A reciprocal repression between ZEB1 and members of the miR-200 family promotes EMT and invasion in cancer cells. EMBO Rep. 2008;9:582–9. doi: 10.1038/embor.2008.74. [DOI] [PMC free article] [PubMed] [Google Scholar]
- CANO A, NIETO MA. Non-coding RNAs take centre stage in epithelial-to-mesenchymal transition. Trends Cell Biol. 2008;18:357–9. doi: 10.1016/j.tcb.2008.05.005. [DOI] [PubMed] [Google Scholar]
- CAO Q, LU K, DAI S, HU Y, FAN W. Clinicopathological and prognostic implications of the miR-200 family in patients with epithelial ovarian cancer. Int J Clin Exp Pathol. 2014;7:2392–401. [PMC free article] [PubMed] [Google Scholar]
- CASTILLA MA, MORENO-BUENO G, ROMERO-PEREZ L, VAN DE VIJVER K, BISCUOLA M, LOPEZ-GARCIA MA, PRAT J, MATIAS-GUIU X, CANO A, OLIVA E, PALACIOS J. Micro-RNA signature of the epithelial-mesenchymal transition in endometrial carcinosarcoma. J Pathol. 2011;223:72–80. doi: 10.1002/path.2802. [DOI] [PubMed] [Google Scholar]
- CHENG C, FU X, ALVES P, GERSTEIN M. mRNA expression profiles show differential regulatory effects of microRNAs between estrogen receptor-positive and estrogen receptor-negative breast cancer. Genome Biol. 2009;10:R90. doi: 10.1186/gb-2009-10-9-r90. [DOI] [PMC free article] [PubMed] [Google Scholar]
- COCHRANE DR, CITTELLY DM, RICHER JK. Steroid receptors and microRNAs: relationships revealed. Steroids. 2011;76:1–10. doi: 10.1016/j.steroids.2010.11.003. [DOI] [PubMed] [Google Scholar]
- CONG N, DU P, ZHANG A, SHEN F, SU J, PU P, WANG T, ZJANG J, KANG C, ZHANG Q. Downregulated microRNA-200a promotes EMT and tumor growth through the wnt/beta-catenin pathway by targeting the E-cadherin repressors ZEB1/ZEB2 in gastric adenocarcinoma. Oncol Rep. 2013;29:1579–87. doi: 10.3892/or.2013.2267. [DOI] [PubMed] [Google Scholar]
- CUI W, ZHANG S, SHAN C, ZHOU L, ZHOU Z. microRNA-133a regulates the cell cycle and proliferation of breast cancer cells by targeting epidermal growth factor receptor through the EGFR/Akt signaling pathway. FEBS J. 2013;280:3962–74. doi: 10.1111/febs.12398. [DOI] [PubMed] [Google Scholar]
- D’ANGELO B, BENEDETTI E, CIMINI A, GIORDANO A. MicroRNAs: A Puzzling Tool in Cancer Diagnostics and Therapy. Anticancer Res. 2016;36:5571–5575. doi: 10.21873/anticanres.11142. [DOI] [PubMed] [Google Scholar]
- DILLHOFF M, LIU J, FRANKEL W, CROCE C, BLOOMSTON M. MicroRNA-21 is overexpressed in pancreatic cancer and a potential predictor of survival. J Gastrointest Surg. 2008;12:2171–6. doi: 10.1007/s11605-008-0584-x. [DOI] [PMC free article] [PubMed] [Google Scholar]
- FAGGAD A, BUDCZIES J, TCHERNITSA O, DARB-ESFAHANI S, SEHOULI J, MULLER BM, WIRTZ R, CHEKEROV R, WEICHERT W, SINN B, MUCHA C, ELWALI NE, SCHAFER R, DIETEL M, DENKERT C. Prognostic significance of Dicer expression in ovarian cancer-link to global microRNA changes and oestrogen receptor expression. J Pathol. 2010;220:382–91. doi: 10.1002/path.2658. [DOI] [PubMed] [Google Scholar]
- FENG X, WANG Z, FILLMORE R, XI Y. MiR-200, a new star miRNA in human cancer. Cancer Lett. 2014;344:166–73. doi: 10.1016/j.canlet.2013.11.004. [DOI] [PMC free article] [PubMed] [Google Scholar]
- GEBESHUBER CA, ZATLOUKAL K, MARTINEZ J. miR-29a suppresses tristetraprolin, which is a regulator of epithelial polarity and metastasis. EMBO Rep. 2009;10:400–5. doi: 10.1038/embor.2009.9. [DOI] [PMC free article] [PubMed] [Google Scholar]
- GRELIER G, VOIRIN N, AY AS, COX DG, CHABAUD S, TREILLEUX I, LEON-GODDARD S, RIMOKH R, MIKAELIAN I, VENOUX C, PUISIEUX A, LASSET C, MOYRET-LALLE C. Prognostic value of Dicer expression in human breast cancers and association with the mesenchymal phenotype. Br J Cancer. 2009;101:673–83. doi: 10.1038/sj.bjc.6605193. [DOI] [PMC free article] [PubMed] [Google Scholar]
- GUO J, XIA B, MENG F, LOU G. miR-133a suppresses ovarian cancer cell proliferation by directly targeting insulin-like growth factor 1 receptor. Tumour Biol. 2014;35:1557–64. doi: 10.1007/s13277-013-1215-z. [DOI] [PubMed] [Google Scholar]
- HENDRY WJ, 3RD, BRANHAM WS, SHEEHAN DM. Diethylstilbestrol versus estradiol as neonatal disruptors of the hamster (Mesocricetus auratus) cervix. Biol Reprod. 2004;70:1306–16. doi: 10.1095/biolreprod.103.024992. [DOI] [PubMed] [Google Scholar]
- HENDRY WJ, 3RD, DEBROT BL, ZHENG X, BRANHAM WS, SHEEHAN DM. Differential activity of diethylstilbestrol versus estradiol as neonatal endocrine disruptors in the female hamster (Mesocricetus auratus) reproductive tract. Biol Reprod. 1999;61:91–100. doi: 10.1095/biolreprod61.1.91. [DOI] [PubMed] [Google Scholar]
- HENDRY WJ, 3RD, LEAVITT WW. Altered morphogenesis of the immature hamster uterus following neonatal exposure to diethylstilbestrol. Differentiation. 1993;52:221–7. doi: 10.1111/j.1432-0436.1993.tb00634.x. [DOI] [PubMed] [Google Scholar]
- HENDRY WJ, 3RD, SHEEHAN DM, KHAN SA, MAY JV. Developing a laboratory animal model for perinatal endocrine disruption: the hamster chronicles. Exp Biol Med. 2002;227:709–23. doi: 10.1177/153537020222700904. [DOI] [PubMed] [Google Scholar]
- HENDRY WJ, 3RD, WEAVER BP, NACCARATO TR, KHAN SA. Differential progression of neonatal diethylstilbestrol-induced disruption of the hamster testis and seminal vesicle. Reprod Toxicol. 2006;21:225–40. doi: 10.1016/j.reprotox.2005.09.014. [DOI] [PubMed] [Google Scholar]
- HENDRY WJ, 3RD, ZHENG X, LEAVITT WW, BRANHAM WS, SHEEHAN DM. Endometrial hyperplasia and apoptosis following neonatal diethylstilbestrol exposure and subsequent estrogen stimulation in both host and transplanted hamster uteri. Cancer Res. 1997;57:1903–8. [PubMed] [Google Scholar]
- HENDRY WJ, HARIRI HY, ALWIS ID, GUNEWARDENA SS, HENDRY IR. Altered Gene Expression Patterns During the Initiation and Promotion Stages of Neonatally Diethylstilbestrol-Induced Hyperplasia/Dysplasia/Neoplasia in the Hamster Uterus. Reprod Toxicol. 2014;50:68–56. doi: 10.1016/j.reprotox.2014.09.002. [DOI] [PMC free article] [PubMed] [Google Scholar]
- HERBST AL, SCULLY RE, ROBBOY SJ. Prenatal diethylstilbestrol exposure and human genital tract abnormalities. Natl Cancer Inst Monogr. 1979:25–35. [PubMed] [Google Scholar]
- HERBST AL, ULFELDER H, POSKANZER DC. Adenocarcinoma of the vagina. Association of maternal stilbestrol therapy with tumor appearance in young women. N Engl J Med. 1971;284:878–81. doi: 10.1056/NEJM197104222841604. [DOI] [PubMed] [Google Scholar]
- IMIG J, BRUNSCHWEIGER A, BRUMMER A, GUENNEWIG B, MITTAL N, KISHORE S, TSIKRIKA P, GERBER AP, ZAVOLAN M, HALL J. miR-CLIP capture of a miRNA targetome uncovers a lincRNA H19-miR-106a interaction. Nat Chem Biol. 2015;11:107–14. doi: 10.1038/nchembio.1713. [DOI] [PubMed] [Google Scholar]
- JI D, CHEN Z, LI M, ZHAN T, YAO Y, ZHANG Z, XI J, YAN L, GU J. MicroRNA-181a promotes tumor growth and liver metastasis in colorectal cancer by targeting the tumor suppressor WIF-1. Mol Cancer. 2014;13:86. doi: 10.1186/1476-4598-13-86. [DOI] [PMC free article] [PubMed] [Google Scholar]
- JIA AY, CASTILLO-MARTIN M, DOMINGO-DOMENECH J, BONAL DM, SANCHEZ-CARBAYO M, SILVA JM, CORDON-CARDO C. A common MicroRNA signature consisting of miR-133a, miR-139-3p, and miR-142-3p clusters bladder carcinoma in situ with normal umbrella cells. Am J Pathol. 2013;182:1171–9. doi: 10.1016/j.ajpath.2013.01.006. [DOI] [PMC free article] [PubMed] [Google Scholar]
- JIANG H, ZHANG G, WU JH, JIANG CP. Diverse roles of miR-29 in cancer (review) Oncol Rep. 2014;31:1509–16. doi: 10.3892/or.2014.3036. [DOI] [PubMed] [Google Scholar]
- KARRI S, JOHNSON H, HENDRY WJ, 3RD, WILLIAMS SC, KHAN SA. Neonatal exposure to diethylstilbestrol leads to impaired action of androgens in adult male hamsters. Reprod Toxicol. 2004;19:53–63. doi: 10.1016/j.reprotox.2004.06.011. [DOI] [PubMed] [Google Scholar]
- KIM VN, NAM JW. Genomics of microRNA. Trends Genet. 2006;22:165–73. doi: 10.1016/j.tig.2006.01.003. [DOI] [PubMed] [Google Scholar]
- KORPAL M, KANG Y. The emerging role of miR-200 family of microRNAs in epithelial-mesenchymal transition and cancer metastasis. RNA Biol. 2008;5:115–9. doi: 10.4161/rna.5.3.6558. [DOI] [PMC free article] [PubMed] [Google Scholar]
- KRICHEVSKY AM, GABRIELY G. miR-21: a small multi-faceted RNA. J Cell Mol Med. 2009;13:39–53. doi: 10.1111/j.1582-4934.2008.00556.x. [DOI] [PMC free article] [PubMed] [Google Scholar]
- LEAVITT WW, EVANS RW, HENDRY WJ., 3RD Etiology of DES-induced uterine tumors in the Syrian hamster. Adv Exp Med Biol. 1982;138:63–86. doi: 10.1007/978-1-4615-7192-6_4. [DOI] [PubMed] [Google Scholar]
- LEE EJ, GUSEV Y, JIANG J, NUOVO GJ, LERNER MR, FRANKEL WL, MORGAN DL, POSTIER RG, BRACKETT DJ, SCHMITTGEN TD. Expression profiling identifies microRNA signature in pancreatic cancer. Int J Cancer. 2007;120:1046–54. doi: 10.1002/ijc.22394. [DOI] [PMC free article] [PubMed] [Google Scholar]
- LEUNG AK. The Whereabouts of microRNA Actions: Cytoplasm and Beyond. Trends Cell Biol. 2015;25:601–10. doi: 10.1016/j.tcb.2015.07.005. [DOI] [PMC free article] [PubMed] [Google Scholar]
- LEWIS BP, SHIH IH, JONES-RHOADES MW, BARTEL DP, BURGE CB. Prediction of mammalian microRNA targets. Cell. 2003;115:787–98. doi: 10.1016/s0092-8674(03)01018-3. [DOI] [PubMed] [Google Scholar]
- LI S, ZHANG J, WAN X. Role of miRNAs in endometrial cancer. Histol Histopathol. 2015;30:539–48. doi: 10.14670/HH-30.539. [DOI] [PubMed] [Google Scholar]
- LI X, XIN S, HE Z, CHE X, WANG J, XIAO X, CHEN J, SONG X. MicroRNA-21 (miR-21) post-transcriptionally downregulates tumor suppressor PDCD4 and promotes cell transformation, proliferation, and metastasis in renal cell carcinoma. Cell Physiol Biochem. 2014;33:1631–42. doi: 10.1159/000362946. [DOI] [PubMed] [Google Scholar]
- LIU B, LI J, CAIRNS MJ. Identifying miRNAs, targets and functions. Brief Bioinform. 2012a;15:1–19. doi: 10.1093/bib/bbs075. [DOI] [PMC free article] [PubMed] [Google Scholar]
- LIU CZ, LIU W, ZHENG Y, SU JM, LI JJ, YU L, HE XD, CHEN SS. PTEN and PDCD4 are bona fide targets of microRNA-21 in human cholangiocarcinoma. Chin Med Sci J. 2012b;27:65–72. [PubMed] [Google Scholar]
- LIU Y, DING Y, HUANG J, WANG S, NI W, GUAN J, LI Q, ZHANG Y, CHEN B, CHEN L. MiR-141 suppresses the migration and invasion of HCC cells by targeting Tiam1. PLoS One. 2014;9:e88393. doi: 10.1371/journal.pone.0088393. [DOI] [PMC free article] [PubMed] [Google Scholar]
- LU J, GETZ G, MISKA EA, ALVAREZ-SAAVEDRA E, LAMB J, PECK D, SWEET-CORDERO A, EBERT BL, MAK RH, FERRANDO AA, DOWNING JR, JACKS T, HORVITZ HR, GOLUB TR. MicroRNA expression profiles classify human cancers. Nature. 2005;435:834–8. doi: 10.1038/nature03702. [DOI] [PubMed] [Google Scholar]
- MA L. Endocrine disruptors in female reproductive tract development and carcinogenesis. Trends Endocrinol Metab. 2009;20:357–63. doi: 10.1016/j.tem.2009.03.009. [DOI] [PMC free article] [PubMed] [Google Scholar]
- MARSELOS M, TOMATIS L. Diethylstilbestrol: I, Pharmacology, toxicology and carcinogenicity in humans. European Journal of Cancer. 1992;28A:1182–1189. doi: 10.1016/0959-8049(92)90482-h. [DOI] [PubMed] [Google Scholar]
- MARSELOS M, TOMATIS L. Diethylstilbestrol: II, Pharmacology, toxicology and carcinogenicity in experimental animals. European Journal of Cancer. 1993;29A:149–155. doi: 10.1016/0959-8049(93)90597-9. [DOI] [PubMed] [Google Scholar]
- MITCHELL PS, PARKIN RK, KROH EM, FRITZ BR, WYMAN SK, POGOSOVA-AGADJANYAN EL, PETERSON A, NOTEBOOM J, O’BRIANT KC, ALLEN A, LIN DW, URBAN N, DRESCHER CW, KNUDSEN BS, STIREWALT DL, GENTLEMAN R, VESSELLA RL, NELSON PS, MARTIN DB, TEWARI M. Circulating microRNAs as stable blood-based markers for cancer detection. Proc Natl Acad Sci U S A. 2008;105:10513–8. doi: 10.1073/pnas.0804549105. [DOI] [PMC free article] [PubMed] [Google Scholar]
- MURAKAMI Y, YASUDA T, SAIGO K, URASHIMA T, TOYODA H, OKANOUE T, SHIMOTOHNO K. Comprehensive analysis of microRNA expression patterns in hepatocellular carcinoma and non-tumorous tissues. Oncogene. 2006;25:2537–45. doi: 10.1038/sj.onc.1209283. [DOI] [PubMed] [Google Scholar]
- NOTHNICK WB, HEALY C, HONG X. Steroidal regulation of uterine miRNAs is associated with modulation of the miRNA biogenesis components Exportin-5 and Dicer1. Endocrine. 2010;37:265–73. doi: 10.1007/s12020-009-9293-9. [DOI] [PMC free article] [PubMed] [Google Scholar]
- PALMLUND I. Exposure to a xenoestrogen before birth: the diethylstilbestrol experience. J Psychosom Obstet Gynaecol. 1996;17:71–84. doi: 10.3109/01674829609025667. [DOI] [PubMed] [Google Scholar]
- PANDA H, CHUANG TD, LUO X, CHEGINI N. Endometrial miR-181a and miR-98 expression is altered during transition from normal into cancerous state and target PGR, PGRMC1, CYP19A1, DDX3X, and TIMP3. J Clin Endocrinol Metab. 2012;97:E1316–26. doi: 10.1210/jc.2012-1018. [DOI] [PMC free article] [PubMed] [Google Scholar]
- PARIKH A, LEE C, JOSEPH P, MARCHINI S, BACCARINI A, KOLEV V, ROMUALDI C, FRUSCIO R, SHAH H, WANG F, MULLOKANDOV G, FISHMAN D, D’INCALCI M, RAHAMAN J, KALIR T, REDLINE RW, BROWN BD, NARLA G, DIFEO A. microRNA-181a has a critical role in ovarian cancer progression through the regulation of the epithelial-mesenchymal transition. Nat Commun. 2014;5:2977. doi: 10.1038/ncomms3977. [DOI] [PMC free article] [PubMed] [Google Scholar]
- PARK SM, GAUR AB, LENGYEL E, PETER ME. The miR-200 family determines the epithelial phenotype of cancer cells by targeting the E-cadherin repressors ZEB1 and ZEB2. Genes Dev. 2008;22:894–907. doi: 10.1101/gad.1640608. [DOI] [PMC free article] [PubMed] [Google Scholar]
- PATERSON EL, KAZENWADEL J, BERT AG, KHEW-GOODALL Y, RUSZKIEWICZ A, GOODALL GJ. Down-regulation of the miRNA-200 family at the invasive front of colorectal cancers with degraded basement membrane indicates EMT is involved in cancer progression. Neoplasia. 2013;15:180–91. doi: 10.1593/neo.121828. [DOI] [PMC free article] [PubMed] [Google Scholar]
- PETER ME. Let-7 and miR-200 microRNAs: guardians against pluripotency and cancer progression. Cell Cycle. 2009;8:843–52. doi: 10.4161/cc.8.6.7907. [DOI] [PMC free article] [PubMed] [Google Scholar]
- PETERSON SM, THOMPSON JA, UFKIN ML, SATHYANARAYANA P, LIAW L, CONGDON CB. Common features of microRNA target prediction tools. Front Genet. 2014;5:23. doi: 10.3389/fgene.2014.00023. [DOI] [PMC free article] [PubMed] [Google Scholar]
- PICHLER M, WINTER E, RESS AL, BAUERNHOFER T, GERGER A, KIESSLICH T, LAX S, SAMONIGG H, HOEFLER G. miR-181a is associated with poor clinical outcome in patients with colorectal cancer treated with EGFR inhibitor. J Clin Pathol. 2014;67:198–203. doi: 10.1136/jclinpath-2013-201904. [DOI] [PubMed] [Google Scholar]
- QIN Y, DANG X, LI W, MA Q. miR-133a functions as a tumor suppressor and directly targets FSCN1 in pancreatic cancer. Oncol Res. 2013;21:353–63. doi: 10.3727/096504014X14024160459122. [DOI] [PubMed] [Google Scholar]
- REED CE, FENTON SE. Exposure to diethylstilbestrol during sensitive life stages: a legacy of heritable health effects. Birth Defects Res C Embryo Today. 2013;99:134–46. doi: 10.1002/bdrc.21035. [DOI] [PMC free article] [PubMed] [Google Scholar]
- RODRIGUEZ FJ, LEWIS-TUFFIN LJ, ANASTASIADIS PZ. E-cadherin’s dark side: possible role in tumor progression. Biochim Biophys Acta. 2012;1826:23–31. doi: 10.1016/j.bbcan.2012.03.002. [DOI] [PMC free article] [PubMed] [Google Scholar]
- RUSTIA M, SHUBIK P. Effects of transplacental exposure to diethylstilbestrol on carcinogenic susceptibility during postnatal life in hamster progeny. Cancer Res. 1979;39:4636–44. [PubMed] [Google Scholar]
- SAYDAM O, SHEN Y, WURDINGER T, SENOL O, BOKE E, JAMES MF, TANNOUS BA, STEMMER-RACHAMIMOV AO, YI M, STEPHENS RM, FRAEFEL C, GUSELLA JF, KRICHEVSKY AM, BREAKEFIELD XO. Downregulated microRNA-200a in meningiomas promotes tumor growth by reducing E-cadherin and activating the Wnt/beta-catenin signaling pathway. Mol Cell Biol. 2009;29:5923–40. doi: 10.1128/MCB.00332-09. [DOI] [PMC free article] [PubMed] [Google Scholar]
- SCHMITTGEN TD, JIANG J, LIU Q, YANG L. A high-throughput method to monitor the expression of microRNA precursors. Nucleic Acids Res. 2004;32:e43. doi: 10.1093/nar/gnh040. [DOI] [PMC free article] [PubMed] [Google Scholar]
- SCHMITTGEN TD, LEE EJ, JIANG J, SARKAR A, YANG L, ELTON TS, CHEN C. Real-time PCR quantification of precursor and mature microRNA. Methods. 2008;44:31–8. doi: 10.1016/j.ymeth.2007.09.006. [DOI] [PMC free article] [PubMed] [Google Scholar]
- SHARMA A. Transgenerational epigenetic inheritance requires a much deeper analysis. Trends Mol Med. 2015;21:269–70. doi: 10.1016/j.molmed.2015.02.010. [DOI] [PubMed] [Google Scholar]
- SHIN KH, BAE SD, HONG HS, KIM RH, KANG MK, PARK NH. miR-181a shows tumor suppressive effect against oral squamous cell carcinoma cells by downregulating K-ras. Biochem Biophys Res Commun. 2011;404:896–902. doi: 10.1016/j.bbrc.2010.12.055. [DOI] [PubMed] [Google Scholar]
- SNOWDON J, ZHANG X, CHILDS T, TRON VA, FEILOTTER H. The microRNA-200 family is upregulated in endometrial carcinoma. PLoS One. 2011;6:e22828. doi: 10.1371/journal.pone.0022828. [DOI] [PMC free article] [PubMed] [Google Scholar]
- STENVOLD H, DONNEM T, ANDERSEN S, AL-SAAD S, VALKOV A, PEDERSEN MI, BUSUND LT, BREMNES RM. High tumor cell expression of microRNA-21 in node positive non-small cell lung cancer predicts a favorable clinical outcome. BMC Clin Pathol. 2014;14:9. doi: 10.1186/1472-6890-14-9. [DOI] [PMC free article] [PubMed] [Google Scholar]
- SVORONOS AA, ENGELMAN DM, SLACK FJ. OncomiR or Tumor Suppressor? The Duplicity of MicroRNAs in Cancer. Cancer Res. 2016;76:3666–70. doi: 10.1158/0008-5472.CAN-16-0359. [DOI] [PMC free article] [PubMed] [Google Scholar]
- THIERY JP, ACLOQUE H, HUANG RY, NIETO MA. Epithelial-mesenchymal transitions in development and disease. Cell. 2009;139:871–90. doi: 10.1016/j.cell.2009.11.007. [DOI] [PubMed] [Google Scholar]
- THOMSON DW, BRACKEN CP, GOODALL GJ. Experimental strategies for microRNA target identification. Nucleic Acids Res. 2011;39:6845–53. doi: 10.1093/nar/gkr330. [DOI] [PMC free article] [PubMed] [Google Scholar]
- VIDIGAL JA, VENTURA A. The biological functions of miRNAs: lessons from in vivo studies. Trends Cell Biol. 2015;25:137–47. doi: 10.1016/j.tcb.2014.11.004. [DOI] [PMC free article] [PubMed] [Google Scholar]
- VLACHOS IS, HATZIGEORGIOU AG. Online resources for miRNA analysis. Clin Biochem. 2013;46:879–900. doi: 10.1016/j.clinbiochem.2013.03.006. [DOI] [PubMed] [Google Scholar]
- VOLINIA S, CALIN GA, LIU CG, AMBS S, CIMMINO A, PETROCCA F, VISONE R, IORIO M, ROLDO C, FERRACIN M, PRUEITT RL, YANAIHARA N, LANZA G, SCARPA A, VECCHIONE A, NEGRINI M, HARRIS CC, CROCE CM. A microRNA expression signature of human solid tumors defines cancer gene targets. Proc Natl Acad Sci U S A. 2006;103:2257–61. doi: 10.1073/pnas.0510565103. [DOI] [PMC free article] [PubMed] [Google Scholar]
- WANG H, AN H, WANG B, LIAO Q, LI W, JIN X, CUI S, ZHANG Y, DING Y, ZHAO L. miR-133a represses tumour growth and metastasis in colorectal cancer by targeting LIM and SH3 protein 1 and inhibiting the MAPK pathway. Eur J Cancer. 2013;49:3924–35. doi: 10.1016/j.ejca.2013.07.149. [DOI] [PubMed] [Google Scholar]
- WEI Z, CUI L, MEI Z, LIU M, ZHANG D. miR-181a mediates metabolic shift in colon cancer cells via the PTEN/AKT pathway. FEBS Lett. 2014;588:1773–9. doi: 10.1016/j.febslet.2014.03.037. [DOI] [PubMed] [Google Scholar]
- WU ZS, WANG CQ, XIANG R, LIU X, YE S, YANG XQ, ZHANG GH, XU XC, ZHU T, WU Q. Loss of miR-133a expression associated with poor survival of breast cancer and restoration of miR-133a expression inhibited breast cancer cell growth and invasion. BMC Cancer. 2012;12:51. doi: 10.1186/1471-2407-12-51. [DOI] [PMC free article] [PubMed] [Google Scholar]
- XIE H, LEE L, SCICLUNA P, KAVAK E, LARSSON C, SANDBERG R, LUI WO. Novel functions and targets of miR-944 in human cervical cancer cells. Int J Cancer. 2015;136:E230–41. doi: 10.1002/ijc.29160. [DOI] [PMC free article] [PubMed] [Google Scholar]
- YAMAMOTO N, NISHIKAWA R, CHIYOMARU T, GOTO Y, FUKUMOTO I, USUI H, MITSUHASHI A, ENOKIDA H, NAKAGAWA M, SHOZU M, SEKI N. The tumor-suppressive microRNA-1/133a cluster targets PDE7A and inhibits cancer cell migration and invasion in endometrial cancer. Int J Oncol. 2015;47:325–34. doi: 10.3892/ijo.2015.2986. [DOI] [PubMed] [Google Scholar]
- YANG H, KONG W, HE L, ZHAO JJ, O’DONNELL JD, WANG J, WENHAM RM, COPPOLA D, KRUK PA, NICOSIA SV, CHENG JQ. MicroRNA expression profiling in human ovarian cancer: miR-214 induces cell survival and cisplatin resistance by targeting PTEN. Cancer Res. 2008;68:425–33. doi: 10.1158/0008-5472.CAN-07-2488. [DOI] [PubMed] [Google Scholar]
- YU J, OHUCHIDA K, MIZUMOTO K, SATO N, KAYASHIMA T, FUJITA H, NAKATA K, TANAKA M. MicroRNA, hsa-miR-200c, is an independent prognostic factor in pancreatic cancer and its upregulation inhibits pancreatic cancer invasion but increases cell proliferation. Mol Cancer. 2010;9:169. doi: 10.1186/1476-4598-9-169. [DOI] [PMC free article] [PubMed] [Google Scholar]
- ZHANG JG, WANG JJ, ZHAO F, LIU Q, JIANG K, YANG GH. MicroRNA-21 (miR-21) represses tumor suppressor PTEN and promotes growth and invasion in non-small cell lung cancer (NSCLC) Clin Chim Acta. 2010;411:846–52. doi: 10.1016/j.cca.2010.02.074. [DOI] [PubMed] [Google Scholar]
- ZHENG K, LIU W, LIU Y, JIANG C, QIAN Q. MicroRNA-133a suppresses colorectal cancer cell invasion by targeting Fascin1. Oncol Lett. 2015;9:869–874. doi: 10.3892/ol.2014.2753. [DOI] [PMC free article] [PubMed] [Google Scholar] [Retracted]
- ZHENG X, HENDRY WJ., 3RD Neonatal diethylstilbestrol treatment alters the estrogen-regulated expression of both cell proliferation and apoptosis-related proto-oncogenes (c-jun, c-fos, c-myc, bax, bcl-2, and bcl-x) in the hamster uterus. Cell Growth Differ. 1997;8:425–34. [PubMed] [Google Scholar]
- ZHU S, SI ML, WU H, MO YY. MicroRNA-21 targets the tumor suppressor gene tropomyosin 1 (TPM1) J Biol Chem. 2007;282:14328–36. doi: 10.1074/jbc.M611393200. [DOI] [PubMed] [Google Scholar]
Associated Data
This section collects any data citations, data availability statements, or supplementary materials included in this article.