

Abstract
Aims: Omega-3-carboxylic acids (OM3-CA) contain omega-3 free fatty acids, such as eicosapentaenoic acid (EPA) and docosahexaenoic acid (DHA), as carboxylic acids. Food intake is known to affect the bioavailability of ethyl ester fatty acid formulations. We conducted a phase I study to investigate the effects of the timing of OM3-CA administration relative to food intake on the pharmacokinetics of EPA and DHA.
Methods: In this randomized, open-label, three-period crossover study, Japanese healthy male subjects were administered 4 × 1 g OM3-CA capsules with continued fasting, before a meal, or after a meal. All subjects fasted for ≥ 10 h prior to drug/meal administration. The primary objective was to examine the effect of meal timing on the pharmacokinetics of EPA and DHA after OM3-CA administration. The secondary objectives were to examine the safety and tolerability of OM3-CA.
Results: A total of 42 Japanese subjects was enrolled in the study. The baseline-adjusted maximum concentration and area under the concentration–time curve from 0 to 72 h for EPA, DHA, and EPA + DHA were lower in the fasting and before meal conditions than in the after meal condition. The maximum total EPA, total DHA, and total EPA + DHA concentrations were reached later when administered in fasting conditions than in fed conditions, indicating slower absorption in fasting conditions. Diarrhea was reported by five, six, and no subjects in the fasting, before meal, and after meal conditions, respectively.
Conclusions: The timing of OM3-CA administration relative to food intake influences the systemic bioavailability of EPA and DHA in healthy Japanese male subjects.
Trial registration: NCT02372344
Keywords: Omega-3 fatty acids, Eicosapentaenoic acid, Docosahexaenoic acid, Pharmacokinetics, Japan
Introduction
Hypercholesterolemia and hypertriglyceridemia are significant health problems in Japan, and the Japan Atherosclerosis Society recommends that fasting triglycerides should be lowered to < 150 mg/dL in concert with lowering low-density lipoprotein (LDL) cholesterol in Japanese individuals to reduce the risk of atherosclerosis and coronary/peripheral arterial diseases1). There is increasing evidence to show that omega-3 fatty acids (n-3 FA), such as eicosapentaenoic acid (EPA) and docosahexaenoic acid (DHA), have beneficial effects on reducing triglyceride concentrations, and that dietary supplementation with EPA or DHA is beneficial in terms of secondary prevention of cardiovascular events and attenuating risk factors for cardiovascular disease2–9).
Omega-3-carboxylic acids (OM3-CA; Epanova®, AstraZeneca) are soft gelatin capsules containing a complex mixture of polyunsaturated fatty acids (PUFAs) of which EPA and DHA are the most abundant. Each 1-g capsule of OM3-CA contains at least 850 mg of PUFAs (approximately 550 mg as EPA and 200 mg as DHA)10). Unlike other n-3 FA formulations, which contain FAs in the ethyl ester form (e.g., Lovaza®), OM3-CA contain FAs in the free acid form and do not require hydrolysis by lipase before they can be absorbed. This property of OM3-CA is expected to improve the systemic bioavailability of FAs. Indeed, the ECLIPSE I (Epanova® Compared to Lovaza® in a Pharmacokinetic Single-dose Evaluation) trial showed that EPA and DHA are more readily absorbed in low-fat/fat-free feeding conditions in subjects who were administered OM3-CA than in subjects administered an ethyl ester formulation (Lovaza®)11).
OM3-CA was associated with significant improvements in triglyceride concentrations in subjects with hypertriglyceridemia (triglyceride concentrations ≥ 500 to < 2000 mg/dL) in the 12-week EVOLVE (EpanoVa fOr Lowering Very high triglyceridEs) trial12). Based on these and other results, OM3-CA was approved in the United States in May 2014 as the first prescription n-3 drug formulated as free FAs13). Previously approved formulations are composed of n-3-acid ethyl esters.
The results of ECLIPSE I11) indicated that the bioavailability of EPA and DHA after OM3-CA administration is less dependent on dietary fat content as compared with formulations that contain FAs in the ethyl ester form. However, higher plasma exposure was achieved when OM3-CA was administered with a high fat meal as compared with that during fasting conditions. Therefore, it was interesting to study the possible effects of the timing of OM3-CA administration relative to food intake on the pharmacokinetics of EPA and DHA in Japanese subjects. Understanding the potential effects of food intake on the bioavailability of EPA and DHA will be valuable for designing future phase II and III trials of OM3-CA in Japanese subjects with hypertriglyceridemia.
Aims
The primary objective of this phase I trial was to examine the effects of food timing on the pharmacokinetics of EPA and DHA after a single dose of OM3-CA in healthy Japanese male subjects. The secondary objectives were to examine the safety and tolerability of OM3-CA.
Methods
Ethics
The trial was conducted in accordance with the Declaration of Helsinki, International Conference on Harmonisation/Good Clinical Practice, and the Astra-Zeneca policy on Bioethics. The trial was approved by the institutional review board at the trial site (Hakata Clinic, Medical Co. LTA, Fukuoka, Japan). All subjects provided written informed consent. This trial was registered on ClinicalTrials.gov (NCT02372344).
Subjects
Japanese male subjects aged 20 to 45 years with a body mass index of 18.5 to 25.5 kg/m2 were eligible if their laboratory profiles, medical histories, 12-lead electrocardiography findings, and physical findings were clinically insignificant. Only subjects with a hemoglobin level above the lower limit of the center's reference range and a QTcF interval of > 340 to < 450 ms were eligible. Subjects who tested positive in a urine drug/alcohol test at screening or any admission (testing was for phencyclidine, benzodiazepine, cocaine, amphetamines, cannabis, opiates, barbiturates, and tricyclic antidepressants; the alcohol test was an alcohol breath assessment) and those who showed habitual use of tobacco or nicotine-containing products within 3 months of screening were excluded from the trial. Subjects who had used fish oil or other EPA- and/or DHA-containing supplements within 2 months of admission were also excluded.
Trial Design
This phase I, open-label, single-center trial was conducted at Hakata Clinic, Medical Co. LTA, Fukuoka, Japan. As illustrated in Fig. 1, eligible subjects were randomized into three groups (sequences ABC, BCA, and CAB) to receive OM3-CA in the fasting state (A), before breakfast (B), or after breakfast (C). At each treatment visit, subjects were admitted on Day −3 and discharged on Day 4 after performing all assessments described below. Physical tests, vital signs, and clinical chemistry were assessed on Day −2. On Day −1, a blood sample was obtained for baseline pharmacokinetic assessments. Subjects then fasted for ≥ 10 h overnight. Water intake was permitted during fasting.
Fig. 1.
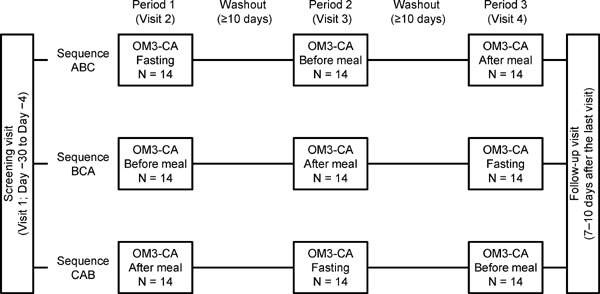
Trial design.
A: Administration in fasting condition; B: Administration before meal; C: Administration after meal. Each 1-g capsule of OM3-CA contains at least 850 mg of polyunsaturated fatty acids (PUFAs) of which EPA and DHA are the most abundant.
On Day 1, all subjects received a single oral dose of 4 × 1 g capsules of OM3-CA at the specified times: (A) 4 h before a standardized meal (lunch), (B) 30 min before breakfast, or (C) 30 min after the start of breakfast. In all three groups, OM3-CA was administered at 09:00 with 200 mL of water. In B and C groups, subjects consumed a low-calorie/low-fat breakfast with about 500 to 600 kcal of energy (16–18% fat). All other meals during each visit were standardized and prepared by the study site personnel. Meals were designed to contain no or very low levels of EPA and DHA. Lunch and dinner were served after obtaining blood samples at 4 and 10 h, respectively, after OM3-CA administration.
Blood samples (approximately 4 mL) were obtained for pharmacokinetic analyses at −15 h on Day −1; at −60 and −5 min predose; and at 1, 2, 3, 4, 5, 6, 7, 8, 10, 12, 24, 36, 48, and 72 h postdose. The plasma EPA and DHA concentrations (as their esterified and nonesterified forms) were determined using validated assays and are presented as the total EPA (esterified + nonesterified) and total DHA (esterified + nonesterified) concentrations. In short, the liquid chromatography–tandem mass spectrometry method employed deuterated forms of EPA and DHA as internal standards with linear ranges of 1 to 250 µg/mL for both EPA and DHA. The sum of the EPA and DHA concentrations (EPA + DHA) was calculated using the formula (total EPA concentration/EPA MW) + (total DHA concentration/DHA MW), where the molecular weight (MW) = 302.451 and 328.48828 g/mol for EPA and DHA, respectively.
The following pharmacokinetic parameters were assessed using a noncompartmental model (Phoenix® WinNonlin® 6.3; Certara, L.P., St Louis, MO, USA): The maximum drug concentration (Cmax), time to Cmax (tmax), terminal half-life (t1/2λZ), area under the plasma concentration time–curve from time zero to 72 h (AUC0–72), and mean residence time (MRT). Pharmacokinetic parameters were analyzed using baseline-adjusted plasma concentrations, which were determined by subtracting the mean EPA/DHA concentration of the three samples taken predose (i.e., at −15 h, −60 min, and −5 min) from the postdose EPA/DHA concentrations. This was performed to minimize the contribution of endogenous EPA and DHA to the pharmacokinetic estimates.
Safety endpoints included adverse events (AEs)/serious AEs (SAEs) (assessed throughout each visit), vital signs (Days −2, 1, and 4 in each visit), laboratory variables (Days −2 and 4), and 12-lead electrocardiography (Days 1 and 4).
Data Analyses and Statistics
The plan was to enroll approximately 42 subjects (14 per sequence) on the assumption that this would provide sufficiently robust results to predict the impact of food intake on the pharmacokinetics of OM3-CA and the bioavailability of EPA and DHA. Statistical analyses were conducted using the pharmacokinetics analysis set (defined as all subjects in the safety population with at least one detectable EPA and DHA plasma concentration) and the safety analysis set (defined as all subjects who received at least one dose of OM3-CA and who had at least one postdose assessment). Baseline characteristics and safety variables were assessed descriptively and are presented as the number (%) of subjects or mean ± standard deviation, as appropriate. The EPA and DHA concentrations were compared using a linear mixed-effect model in which log-transformed pharmacokinetic parameters were included as the response variable, while treatment, sequence, and period were included as fixed categorical effects, and subject was nested within sequence as a random categorical effect. The least-squares (LS) mean and 90% confidence interval (90% CI) for the difference in the log-scaled values were back-transformed to the original scale. For these analyses, the after meal administration was used as the reference to derive geometric mean ratios. No statistical hypothesis tests were planned or conducted.
Results
Subjects
Of 72 subjects initially screened, 42 subjects were enrolled and randomized with 14 subjects per sequence (Table 1). All 42 subjects completed the trial and were included in both analysis sets. All of the subjects were of Japanese ethnicity. The mean age and body mass index were 31.0 years and 21.80 kg/m2, respectively (Table 1).
Table 1. Subject disposition and characteristics.
| n or mean ± SD | |
|---|---|
| Subjects enrolled | 72 |
| Subjects randomized & completed trial | 42 |
| Sequence ABC | 14 |
| Sequence BCA | 14 |
| Sequence CAB | 14 |
| Age, years | 31.0 ± 7.4 |
| Weight, kg | 63.4 ± 6.8 |
| Height, cm | 170.4 ± 4.8 |
| BMI, kg/m2 | 21.80 ± 1.81 |
| Smoking status, never/former, n | 23/19 |
| Alcohol consumption, never/current, n | 22/20 |
SD: standard deviation; A: administration in fasting condition; B: administration before meal; C: administration after meal; BMI, body mass index.
Pharmacokinetics
As indicated in Table 2, the baseline (mean ± standard deviation) EPA, DHA, and EPA + DHA concentrations were generally similar between the three administration conditions. Fig. 2 shows the baseline-adjusted concentrations of EPA, DHA, and EPA + DHA after OM3-CA administration in the fasting state, before breakfast, or after breakfast. In all three administration conditions, the plasma concentrations of EPA, DHA, and EPA + DHA started to increase above baseline from about 1 to 3 h after OM3-CA administration. However, there were differences in the shapes and heights of the concentration–time curves between the conditions, suggesting that the timing of food administration influenced the bioavailability and rate of absorption of EPA and DHA after administration of 4 g of OM3-CA. Table 2 also shows the pharmacokinetic parameters for EPA, DHA and EPA + DHA. It is noteworthy that the baseline-adjusted Cmax values for EPA, DHA, and EPA + DHA were lower in the fasting (by 65%, 54%, and 62%, respectively, calculated as 100% – ratio of Cmax to after meal values) and before meal (by 56%, 43%, and 52%, respectively) conditions than in the after meal condition, and the 90% CIs for the calculated between-treatment ratios did not cross 1. The between-subject variability in the Cmax for EPA, as estimated from the baseline-adjusted plasma concentrations, was quite broad, with ranges of 10.9 to 271 µg/mL in fasting conditions, 6.40 to 386 µg/mL in before meal conditions, and 72.2 to 378 µg/mL in after meal conditions, indicative of reduced absorption of EPA in some subjects especially in the fasting and before meal treatment conditions. Similar results were observed for DHA (fasting: 11.8–157 µg/mL; before meal: 9.73–178 µg/mL; after meal: 27.0–195 µg/mL) and EPA + DHA (fasting: 0.0708–1.34 µmol/mL; before meal: 0.0694–1.82 µmol/mL; after meal: 0.321–1.84 µmol/mL). The geometric coefficients of variation for the AUC0–72 for EPA were 76.1%, 112%, and 31.1%, respectively for fasting, before meal, and after meal conditions (Table 2). Therefore, inter-individual variability in the EPA concentrations is larger in the fasting and before meal conditions as compared with the after meal condition. On the other hand, the geometric coefficients of variation for the AUC0–72 for DHA were 80.4%, 66.0%, and 75.8%, respectively, for fasting, before meal, and after meal conditions (Table 2). Thus, inter-individual variability in the plasma AUC0–72 for DHA is similarly large in all three conditions.
Table 2. Pharmacokinetic parameters of total EPA, total DHA, and total EPA + total DHA calculated on baseline subtracted plasma concentrations.
| Fasting (n = 42) | Before meal (n = 42) | After meal (n = 42) | |||
|---|---|---|---|---|---|
| Ratio to after meal | Ratio to after meal | ||||
| Total EPA | |||||
| Baseline (µg/mL) | 22.4 ± 10.7 | NC | 20.6 ± 9.0 | NC | 22.8 ± 12.1 |
| Cmax (µg/mL) | 78.5 (110) | 0.35 (0.27 – 0.47) | 97.1 (168) | 0.44 (0.33 – 0.59) | 221 (34.7) |
| tmax (h) | 6.0 (5.0 – 10.0) | 1.31 (1.25 – 1.38) | 4.0 (3.0 – 7.0) | 0.79 (0.75 – 0.83) | 5.0 (3.0 – 7.0) |
| AUC0–72 (h·mg/mL) | 1.53 (76.1) | 0.56 (0.45–0.69) | 1.52 (112) | 0.55 (0.44–0.69) | 2.76 (31.1) |
| t1/2λZ (h) | 42.7 (53.9)† | 1.05 (0.93–1.19) | 43.5 (43.6)‡ | 1.11 (0.98–1.27) | 40.6 (39.25)§ |
| MRT (h) | 60.1 (51.9)† | 1.10 (0.98–1.23) | 59.0 (39.2)‡ | 1.13 (1.00–1.27) | 54.3 (36.6)§ |
| Total DHA | |||||
| Baseline (µg/mL) | 107.7 ± 28.4 | NC | 106.1 ± 24.4 | NC | 106.9 ± 28.0 |
| Cmax (µg/mL) | 42.1 (84.9) | 0.46 (0.36–0.57) | 52.4 (103) | 0.57 (0.45–0.71) | 92.6 (42.65) |
| tmax (h) | 6.0 (4.0–72.0) | 1.44 (1.15–1.79) | 4.0 (2.0–72.0) | 0.97 (0.78–1.22) | 5.0 (3.0–6.0) |
| AUC0–72 (h·mg/mL) | 0.542 (80.4) | 0.87 (0.73–1.04) | 0.533 (66.0) | 0.86 (0.72–1.02) | 0.621 (75.8) |
| t1/2λZ (h) | 9.99 (607)‖ | NC | 3.45 (676)¶ | NC | 6.07 (3313)¶ |
| MRT (h) | 25.4 (194)‖ | NC | 9.05 (137)¶ | NC | 19.0 (343)¶ |
| Total EPA ± total DHA | |||||
| Baseline (nmol/mL) | 401.9 ± 116.6 | NC | 391.1 ± 100.3 | NC | 400.7 ± 121.4 |
| Cmax (µmol/mL) | 0.384 (103) | 0.38 (0.29–0.49) | 0.483 (138) | 0.48 (0.37–0.62) | 1.01 (36.5) |
| tmax (h) | 6.0 (5.0–72.0) | 1.38 (1.20–1.60) | 4.0 (3.0–72.0) | 0.91 (0.79–1.05) | 5.0 (3.0–6.0) |
| AUC0–72 (h·mg/mL) | 6.46 (75.9) | 0.61 (0.50–0.74) | 6.56 (83.1) | 0.62 (0.51–0.76) | 10.6 (43.6) |
| t1/2λZ (h) | 29.2 (173)†† | 0.51 (0.14–1.93) | 33.4 (NC)‡‡ | NC | 46.5 (99.55)§§ |
| MRT (h) | 44.6 (133)†† | 0.61 (0.20–1.88) | 43.7 (NC)‡‡ | NC | 59.0 (100)§§ |
n = 37,
n = 33,
n = 41,
n = 4,
n = 2,
n = 8,
n = 1,
n = 5
The baseline concentration is presented as the mean ± standard deviation of the concentrations measured at −15 h, −1 h, and −5 min at each visit. Cmax, AUC0–72, t1/2λZ, and MRT are presented as the geometric mean (geometric coefficient of variation).
tmax is presented as the median (range).
The ratio to after meal is presented as the estimate of the geometric least-squares means with 90% confidence intervals.
EPA: eicosapentaenoic acid; Cmax: maximum concentration; tmax: time to the maximum concentration; AUC0–72: area under the concentration–time curve from time zero to 72 h; t1/2λZ: terminal half-life; MRT: mean residence time; NC: not calculated; DHA: docosahexaenoic acid.
Fig. 2.
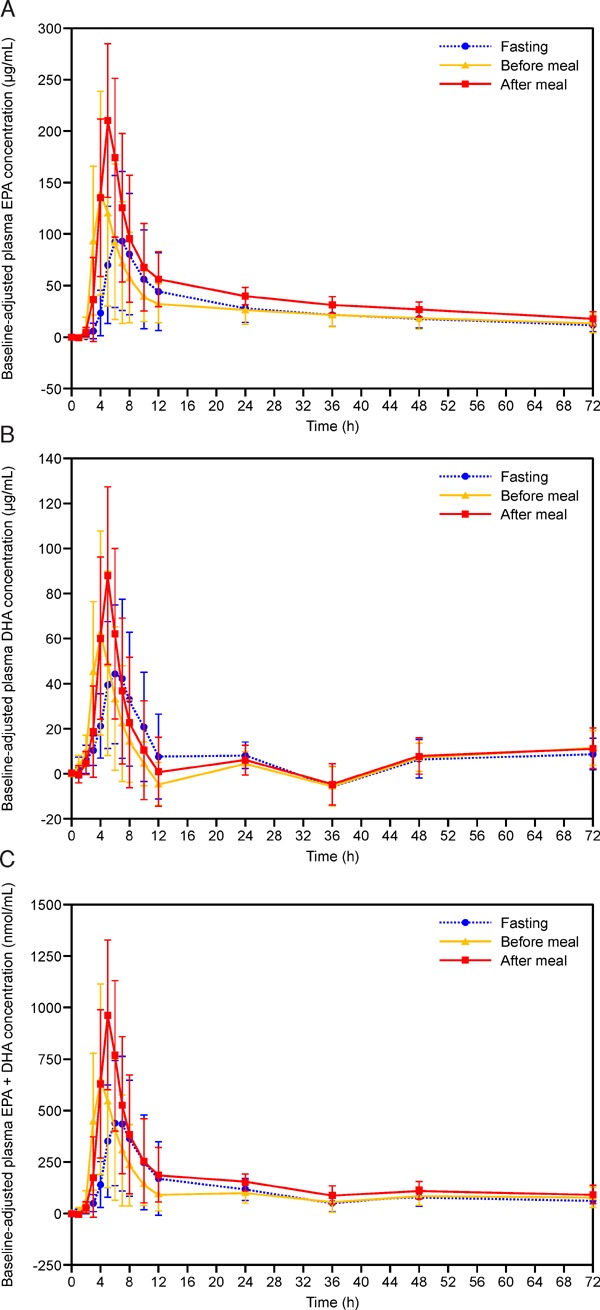
Baseline-adjusted plasma concentration–time profiles of (A) total EPA, (B) total DHA, and (C) total EPA + total DHA. Results are presented as the mean ± standard deviation. DHA: Docosahexaenoic acid; EPA: Eicosapentaenoic acid. Each 1-g capsule of OM3-CA contains at least 850 mg of polyunsaturated fatty acids (PUFAs) of which EPA and DHA are the most abundant.
The baseline-adjusted AUC0–72 values for EPA, DHA, and EPA + DHA were lower in the fasting (by 44%, 13%, and 39%, respectively) and before meal (by 45%, 14%, and 38%, respectively) conditions than in the after meal condition, with 90% CIs for the between-treatment ratios that did not cross 1. The median tmax for EPA, DHA, and EPA + DHA appeared later in the fasting condition (EPA, DHA, and EPA + DHA; 6.0, 6.0, and 6.0 h, respectively) relative to the before meal (4.0, 4.0, and 4.0 h, respectively) and after meal (5.0, 5.0, and 5.0 h, respectively) conditions, indicative of slower absorption of EPA and DHA in the absence of food. The later tmax in the fasting condition than in the after meal condition was also supported by the fact that the 90% CI for the between-treatment ratio did not cross 1 (ratio 1.31; 90% CI 1.25–1.38). The mean t1/2λZ for EPA was similar in all three treatment conditions with the values of 42.7, 43.5, and 40.6 h in the fasting, before meal, and after meal conditions, respectively, and the 90% CIs for the between-treatment ratios crossed 1. With regard to DHA and EPA + DHA, these parameters could only be calculated for 1 to 8 subjects per administration condition, thereby preventing meaningful comparisons. There was no evidence of an effect of sequence or subject on the pharmacokinetic parameters (data not shown).
Safety
AEs occurred in five (11.9%), six (14.3%), and one (2.4%) subject in the fasting, before meal, and after meal administration conditions, respectively (Table 3). All AEs in the fasting and before meal conditions were diarrhea. An episode of presyncope occurred in one subject who was administered OM3-CA in the after meal condition. There were no deaths or discontinuations because of AEs and none of the AEs were classified as serious. There were no clinically remarkable findings in terms of laboratory tests, vital signs, electrocardiography, or physical findings.
Table 3. Adverse events according to timing of administration.
| Fasting | Before meal | After meal | Total | |
|---|---|---|---|---|
| (n = 42) | (n = 42) | (n = 42) | (n = 42) | |
| AEs | 5 (11.9) | 6 (14.3) | 1 (2.4) | 9 (21.4) |
| Related AEs | 5 (11.9) | 6 (14.3) | 0 | 9 (21.4) |
| AEs leading to discontinuation | 0 | 0 | 0 | 0 |
| AEs leading to death | 0 | 0 | 0 | 0 |
| SAEs | 0 | 0 | 0 | 0 |
| AEs according to SOC and PT | ||||
| Gastrointestinal disorders | 5 (11.9) | 6 (14.3) | 0 | 9 (21.4) |
| Diarrhea | 5 (11.9) | 6 (14.3) | 0 | 9 (21.4) |
| Nervous system disorders | 0 | 0 | 1 (2.4) | 1 (2.4) |
| Presyncope | 0 | 0 | 1 (2.4) | 1 (2.4) |
Data are expressed as n (%).
AE: adverse event; SAE: serious adverse event; SOC: system organ class; PT: preferred term.
Discussion
Food intake and meal content may influence the systemic bioavailability of the fatty acids EPA and DHA following oral administration; in particular, lipase is required for the digestion and absorption of the ethyl ester forms of these FAs. Fat digestion is initiated in the stomach and the hydrolysis to free FAs is completed in the small intestine through emulsification with bile salts and the action of pancreatic lipase. Free FAs are absorbed into the enterocytes after forming mixed micelles with bile salts14). Previous clinical trials have examined the effect of food on the plasma levels of EPA and DHA after OM3-CA and OM3-EE (Lovaza®) administrations11, 15). In these studies, OM3-CA was associated with a higher bioavailability of EPA and DHA as compared with OM3-EE, indicating a potential therapeutic advantage of OM3-CA over OM3-EE, especially under low-fat dietary conditions normally recommended for patients with cardiovascular disease. Furthermore, the bioavailability was less affected by concomitant food intake in the OM3-CA group than in the OM3-EE group. However, concomitant food intake also increased the uptake of EPA and DHA when administered as OM3-CA. The effect of meal timing independent of meal fat content has not previously been studied.
In this study, we examined the influence of food and timing of food intake on the pharmacokinetics of EPA and DHA administered as OM3-CA to healthy Japanese male subjects. EPA and DHA are endogenous compounds that are present in the plasma prior to OM3-CA administration. Therefore, the baseline concentration (taken as the mean of three predose samples) was subtracted from each postdose concentration before the pharmacokinetic parameters were calculated to estimate the proportions of EPA and DHA in the plasma attributable to the OM3-CA administration. In this study, we found that the baselineadjusted Cmax and AUC0–72 values for EPA, DHA, and EPA + DHA were lower when OM3-CA was administered in the fasting state or before breakfast as compared with its administration after breakfast. In addition, the absorption of EPA and DHA was prolonged in the fasting condition, as illustrated by the later time to reach Cmax in this condition. These results indicate that both food intake and the timing of food intake influence the bioavailability of EPA and DHA, and that the systemic bioavailability and absorption of these FAs are reduced in the fasting state. However, the between-subject variability in the parameters related to EPA and DHA absorption (e.g., Cmax) suggest that the absorption of EPA and DHA was very limited in some healthy subjects in the fasting and before meal treatment state, and may have influenced the overall results.
In terms of safety, diarrhea was the most common AE, but it did not occur when OM3-CA was administered after a meal. This suggests that OM3-CA may be better tolerated in this condition. No other unexpected safety concerns were identified in the trial.
Considering the pharmacokinetic and safety profiles, OM3-CA could be administered after a meal to increase the bioavailability of EPA and DHA in Japanese subjects. This approach may also reduce the risk of gastrointestinal AEs.
It is unclear whether a higher systemic bioavailability of EPA and DHA also leads to greater effects on lipid concentrations. Because our study only involved a single dose of OM3-CA, its effects on lipids could not be evaluated. However, a previous clinical study of OM3-CA, the 12-week EVOLVE trial12) conducted in patients with severe hypertriglyceridemia, showed that OM3-CA administration at doses of 2, 3, or 4 g/day was associated with significant and slightly dose-dependent improvements in lipids (triglycerides, non-high-density lipoprotein cholesterol, total cholesterol to high-density lipoprotein cholesterol ratio, very-low-density lipoprotein cholesterol, remnant-like particle cholesterol, apolipoprotein CIII, lipoprotein-associated phospholipase A2, and arachidonic acid) as well as dose-dependent increases in the plasma concentrations of EPA and DHA as compared with the olive oil control group. Thus, the higher systemic bioavailability of EPA and DHA associated with OM3-CA administration after a meal may lead to more pronounced lipid effects, but long-term studies would be needed to examine these effects and document the safety profile of OM3-CA in more detail.
Limitations of the present trial include the small sample size, single dose, and enrollment of healthy male subjects. However, these factors are expected considering this was a phase I trial, which was designed to evaluate the impact of administration time relative to food intake, not to determine the clinical efficacy of OM3-CA.
Conclusions
In conclusion, the timing of OM3-CA administration relative to food intake influenced the pharmacokinetics of EPA and DHA in healthy Japanese male subjects. The systemic bioavailability of these FAs was highest when OM3-CA was administered after a meal. In addition, the incidence of diarrhea was lower when subjects were administered OM3-CA after a meal. Considered together, these findings suggest that OM3-CA administration after a meal may be appropriate in Japanese subjects in terms of maximizing the bioavailability of FAs and minimizing gastrointestinal AEs.
Acknowledgments
The authors wish to thank the investigators and staff at Sugioka Memorial Hospital, Medical Co. LTA for performing the trial. The authors also thank Nicholas D. Smith (Edanz Group Japan KK) for providing medical writing support, which was funded by Astra-Zeneca KK.
Funding and Notice of Grant Support
This trial was sponsored by AstraZeneca KK.
Conflict of Interest Statement
Y. Noda, H. Shimada, H. Kim and T. Yajima are employees of AstraZeneca K.K., Japan. C. Nilsson and T. Lundström are employees of AstraZeneca Gothenburg, Mölndal, Sweden.
References
- 1). Teramoto T, Sasaki J, Ishibashi S, Birou S, Daida H, Dohi S, Egusa G, Hiro T, Hirobe K, Iida M, Kihara S, Kinoshita M, Maruyama C, Ohta T, Okamura T, Yamashita S, Yokode M, Yokote K: Executive summary of the Japan Atherosclerosis Society (JAS) guidelines for the diagnosis and prevention of atherosclerotic cardiovascular diseases in Japan -2012 version. J Atheroscler Thromb, 2013; 20: 517-523 [DOI] [PubMed] [Google Scholar]
- 2). Matsuzaki M, Yokoyama M, Saito Y, Origasa H, Ishikawa Y, Oikawa S, Sasaki J, Hishida H, Itakura H, Kita T, Kitabatake A, Nakaya N, Sakata T, Shimada K, Shirato K, Matsuzawa Y, JELIS Investigators : Incremental effects of eicosapentaenoic acid on cardiovascular events in statin-treated patients with coronary artery disease. Circ J, 2009; 73: 1283-1290 [DOI] [PubMed] [Google Scholar]
- 3). Nakamura N, Hamazaki T, Kobayashi M, Ohta M, Okuda K: Effects of eicosapentaenoic acids on remnant-like particles, cholesterol concentrations and plasma fatty acid composition in patients with diabetes mellitus. In Vivo, 1998; 12: 311-314 [PubMed] [Google Scholar]
- 4). Nomura S, Kanazawa S, Fukuhara S: Effects of eicosapentaenoic acid on platelet activation markers and cell adhesion molecules in hyperlipidemic patients with type 2 diabetes mellitus. J Diabetes Complications, 2003; 17: 153-159 [DOI] [PubMed] [Google Scholar]
- 5). Okumura T, Fujioka Y, Morimoto S, Tsuboi S, Masai M, Tsujino T, Ohyanagi M, Iwasaki T: Eicosapentaenoic acid improves endothelial function in hypertriglyceridemic subjects despite increased lipid oxidizability. Am J Med Sci, 2002; 324: 247-253 [DOI] [PubMed] [Google Scholar]
- 6). Satoh N, Shimatsu A, Kotani K, Himeno A, Majima T, Yamada K, Suganami T, Ogawa Y: Highly purified eicosapentaenoic acid reduces cardio-ankle vascular index in association with decreased serum amyloid A-LDL in metabolic syndrome. Hypertens Res, 2009; 32: 1004-1008 [DOI] [PubMed] [Google Scholar]
- 7). Shinozaki K, Kambayashi J, Kawasaki T, Uemura Y, Sakon M, Shiba E, Shibuya T, Nakamura T, Mori T: The long-term effect of eicosapentaenoic acid on serum levels of lipoprotein (a) and lipids in patients with vascular disease. J Atheroscler Thromb, 1996; 2: 107-109 [DOI] [PubMed] [Google Scholar]
- 8). Toyama K, Nishioka T, Isshiki A, Ando T, Inoue Y, Kirimura M, Kamiyama T, Sasaki O, Ito H, Maruyama Y, Yoshimoto N: Eicosapentaenoic acid combined with optimal statin therapy improves endothelial dysfunction in patients with coronary artery disease. Cardiovasc Drugs Ther, 2014; 28: 53-59 [DOI] [PubMed] [Google Scholar]
- 9). Yagi S, Aihara K, Fukuda D, Takashima A, Hara T, Hotchi J, Ise T, Yamaguchi K, Tobiume T, Iwase T, Yamada H, Soeki T, Wakatsuki T, Shimabukuro M, Akaike M, Sata M: Effects of docosahexaenoic acid on the endothelial function in patients with coronary artery disease. J Atheroscler Thromb, 2015; 22: 447-454 [DOI] [PubMed] [Google Scholar]
- 10). AstraZeneca Pharmaceuticals LP. Omega-3 free fatty acids (Epanova): US prescribing information. 2014. http://www.accessdata.fda.gov/drugsatfda_docs/label/2014/205060s000lbl.pdf
- 11). Davidson MH, Johnson J, Rooney MW, Kyle ML, Kling DF: A novel omega-3 free fatty acid formulation has dramatically improved bioavailability during a low-fat diet compared with omega-3-acid ethyl esters: the ECLIPSE (Epanova® compared to Lovaza® in a pharmacokinetic single-dose evaluation) study. J Clin Lipidol, 2012; 6: 573-584 [DOI] [PubMed] [Google Scholar]
- 12). Kastelein JJ, Maki KC, Susekov A, Ezhov M, Nordestgaard BG, Machielse BN, Kling D, Davidson MH: Omega-3 free fatty acids for the treatment of severe hypertriglyceridemia: the EpanoVa fOr Lowering Very high triglyceridEs (EVOLVE) trial. J Clin Lipidol, 2014; 8: 94-106 [DOI] [PubMed] [Google Scholar]
- 13). Blair HA, Dhillon S: Omega-3 carboxylic acids (Epanova): a review of its use in patients with severe hypertriglyceridemia. Am J Cardiovasc Drugs, 2014; 14: 393-400 [DOI] [PubMed] [Google Scholar]
- 14). Shi Y, Burn P: Lipid metabolic enzymes: emerging drug targets for the treatment of obesity. Nature Rev Drug Disc, 2004; 3: 695-710 [DOI] [PubMed] [Google Scholar]
- 15). Offman E, Marenco T, Ferber S, Johnson J, Kling D, Curcio D, Davidson M: Steady-state bioavailability of prescription omega-3 on a low-fat diet is significantly improved with a free fatty acid formulation compared with an ethyl ester formulation: the ECLIPSE II study. Vasc Health Risk Manag, 2013; 9: 563-573 [DOI] [PMC free article] [PubMed] [Google Scholar]