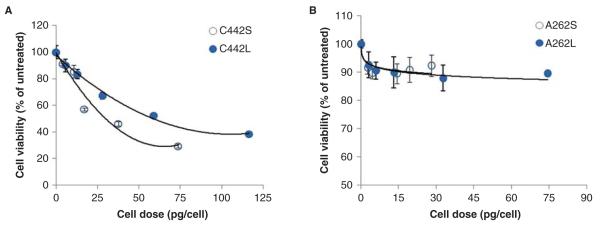
Figure 4.
Cytotoxicity dose–response profiles for C10 cells treated with small and large agglomerates of IONPs. Cytotoxicity was measured 24 h after exposure to agglomerates of carboxylated (A) or amine-modified IONPs (B). Cell dose values on the X-axis were determined by MPD, as described in the section “Materials and methods”. Exposure concentrations (μg/ml) for these dose equivalents were 5, 10, 50, 100 and 200 μg/ml (carboxylated) and 5, 10, 25, 50 and 100 μg/ml (aminated). On an absolute mass dose basis, C442S were found to be more cytotoxic compared with C442L. Values are mean + s.d. of at least triplicate biological replicates. Solid lines represent the best-fit regression model (polynomial or logarithmic) to the data (C442S, R2 = 0.9548; C442L, R2 = 0.9917; A262S, R2 = 0.7141; A262L, R2 = 0.9103).

