Abstract
Reduction of intraocular pressure is the sole therapeutic target for glaucoma. Intraocular pressure is determined by the dynamics of aqueous humour secretion and outflow, which comprise several pressure-dependent and pressure-independent mechanisms. Accurately quantifying the components of aqueous humour dynamics is essential in understanding the pathology of glaucoma and the development of new treatments. To better characterise aqueous humour dynamics, we propose a method to directly measure pressure-independent aqueous humour flow. Using the iPerfusion system, we directly measure the flow into the eye when the pressure drop across the pressure-dependent pathways is eliminated. Using this approach we address i) the magnitude of pressure-independent flow in ex vivo eyes, ii) whether we can accurately measure an artificially imposed pressure-independent flow, and iii) whether the presence of a pressure-independent flow affects our ability to measure outflow facility. These studies are conducted in mice, which are a common animal model for aqueous humour dynamics. In eyes perfused with a single cannula, the average pressure-independent flow was 1 [−3, 5] nl/min (mean [95% confidence interval]) (N=6). Paired ex vivo eyes were then cannulated with two needles, connecting the eye to both iPerfusion and a syringe pump, which was used to impose a known pressure-independent flow of 120 nl/min into the experimental eye only. The measured pressure-independent flow was then 121 [117, 125] nl/min (N=7), indicating that the method could measure pressure-independent flow with high accuracy. Finally, we showed that the artificially imposed pressure-independent flow did not affect our ability to measure facility, provided that the pressure-dependence of facility and the true pressure-independent flow were accounted for. The present study provides a robust method for measurement of pressure-independent flow, and demonstrates the importance of accurately quantifying this parameter when investigating pressure-dependent flow or outflow facility.
Keywords: Aqueous humour dynamics, iPerfusion, unconventional outflow, uveoscleral outflow, pressure-independent flow, outflow facility, ocular biomechanics
1. Introduction
Glaucoma is a world leading cause of irreversible blindness (Resnikoff et al., 2004) and elevated intraocular pressure (IOP) is the major risk factor. IOP reduction is the sole clinical objective to prevent further glaucomatous vision loss, regardless of whether IOP is elevated (Van Veldhuisen et al., 2000). Understanding the physiology of IOP regulation, and its dysregulation in glaucoma, is therefore central to developing and evaluating new IOP-lowering therapies.
IOP is determined by a mass balance between aqueous humour secretion into the eye (Qin), and aqueous humour outflow, via pressure-independent mechanisms (Qu) and pressure-dependent mechanisms (characterised by the outflow facility C). A mass balance of the flows entering and exiting the eye yields a form of what is known as Goldmann’s equation:
| (1) |
which includes an additional term representing inflow from a perfusion system (Q). P and Pe represent IOP and episcleral vessel pressure respectively. Most treatments for glaucoma aim to reduce Qin or increase Qu, with a number of new treatments targeting C (Stamer and Acott, 2012). IOP elevation in glaucoma is attributed to reduced values of C (Grant, 1951). Studies of aqueous humour dynamics (AHD) therefore aim to measure the various parameters of Eq. 1 so as to elucidate the factors controlling IOP.
Mice are common models to study AHD (Aihara et al., 2003; Boussommier-Calleja et al., 2012; Crowston et al., 2004; Lei et al., 2011; Li et al., 2016; Millar et al., 2011; 2015; Toris et al., 2016; Zhang et al., 2002; Zhang et al., 2009). However, some studies report that as much as 60–80% of outflow is pressure-independent in young mice (Aihara et al., 2003; Crowston et al., 2004; Lei et al., 2011), although the fraction of pressure-independent outflow may decrease with age (Millar et al., 2015). This contrasts with humans, where the majority of outflow is pressure-dependent (Bill and Phillips, 1971; Toris et al., 1995; Townsend and Brubaker, 1980), although reported values of the exact proportion vary over a large range, as reviewed by Johnson et al. (2017). If pressure-independent outflow truly dominates in mice, then the validity of mouse models for AHD becomes questionable.
Pressure-independent outflow (Qu) in post-mortem mice has generally been estimated indirectly by linear extrapolation to estimate the flow rate when P = Pe, under conditions where Qin is eliminated (Lei et al., 2011; Millar et al., 2011). In living mice, Qu has been estimated indirectly by solving Goldmann’s equation after measuring C, Pe, Qin and spontaneous IOP (Aihara et al., 2003). Alternatively, the quantity of unconventional (i.e. non-trabecular) outflow has been estimated in living mice based on accumulation of tracer in the uveoscleral tissues (Millar et al., 2011). As unconventional outflow is typically assumed to exhibit pressure-insensitivity, it is often equated with Qu, although this assumption is questionable (Johnson et al., 2017).
Here, we present a method to directly measure the net pressure-independent flow, Q0, defined as the difference between pressure-independent inflow and outflow according to
| (2) |
To measure Q0, we cannulate the anterior chamber with a needle and interface the eye with the iPerfusion system (Sherwood et al., 2016) that allows direct measurement of Q for a prescribed value of P. By setting P = Pe, the pressure-dependent component of outflow is eliminated (see Eq. 1), enabling a direct measurement of Q0. Note that Pe = 0 in an enucleated eye.
This report addresses the following questions:
What is the magnitude of pressure-independent flow, Q0, in enucleated mouse eyes?
If pressure-independent flow were present (Q0 ≠ 0), as in vivo, could it be measured accurately using iPerfusion?
Does non-zero pressure-independent flow affect the measurement of outflow facility?
2. Material and Methods
2.1 Experimental Design
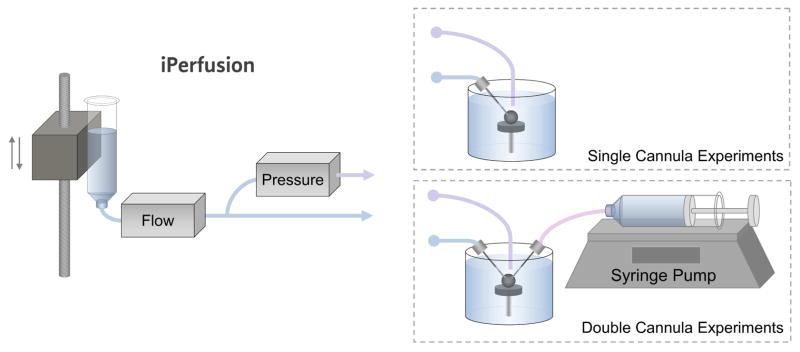
To answer Question 1, we cannulated enucleated mouse eyes with a single cannula connected to iPerfusion, as shown in Fig. 1. Following a standard perfusion protocol to ensure that the ocular response was normal, the applied pressure was set to zero and the flow rate Q into the eye was measured as P approached zero. To answer Question 2, we cannulated enucleated mouse eyes with two cannulae, providing connections to both iPerfusion and a syringe pump (see Fig. 1). The syringe pump was used to impose a known pressure-independent flow directly into one eye. We then asked whether iPerfusion was able to resolve this additional flow rate by direct measurement of Q as P approached zero. To answer Question 3, we compared outflow facility measurements between contralateral eyes, with one eye receiving the imposed pressure-independent flow. As outflow facility is tightly correlated between contralateral enucleated eyes of an individual mouse (Sherwood et al., 2016), a systematic offset in the facility between paired eyes would indicate that the magnitude of pressure-independent flow affects the measurement of facility.
Fig. 1.
Schematic of the experimental setup. The iPerfusion system comprises an actuated reservoir to control the applied pressure, a thermal flow sensor to measure the flow rate from the reservoir, and a differential pressure sensor to measure the pressure in the eye with respect to the bath. For the single cannula experiments, the eye was cannulated with one glass needle connected to iPerfusion. For the double cannula experiments, the eye was cannulated with two glass needles, connecting it to both the iPerfusion system and a syringe pump, used to impose a known pressure-independent flow.
2.2 Detailed Methods
2.2.1 Animal Husbandry
Eyes were obtained from male C57BL/6 mice (Charles River UK, Ltd) aged 9–16 weeks. All mice were housed in clear cages at 21°C with a 12-hour light-dark cycle (lights on at 7 AM). Food and water were supplied ad libitum. Mice were euthanised by cervical dislocation and eyes were enucleated and stored in PBS at room temperature for no more than 1 hour prior to cannulation. The time between death and completion of the perfusion did not exceed 5.5 hours. All experiments were performed in accordance with the ARVO Statement for the Use of Animals in Ophthalmic and Vision Research. Experiments were conducted under the authority of a UK Home Office Project Licence.
2.2.2 Ocular Perfusion Setup
Enucleated eyes were fixed to a platform with a small amount of cyanoacrylate glue (Loctite Precision Super Glue, Henkel, UK) and fully submerged in a bath of PBS maintained at 35.0 ± 0.5 °C for the duration of the experiment. Glass needles mounted on micromanipulators were used to cannulate the anterior chamber of the eye under a stereomicroscope. The needles were made by pulling borosilicate glass pipettes (B100-50, Sutter Instrument, USA) in a laser puller (P2000, Sutter Instrument) and were bevelled in a pipette beveller (SYS-48000, WPI, USA) to a 45° tap er and a 100 μm outer diameter at the tip. The perfusate used in both cannulae was Dulbecco’s PBS with 5.5 mM glucose passed through a sterile 0.22 μm filter prior to use. The flow rate from the iPerfusion system into the eye, Q, at pressure P was measured as described previously (Chandrawati et al., 2017; Li et al., 2016; O’Callaghan et al., 2017; Reina-Torres et al., 2017; Sherwood et al., 2016; Tam et al., 2017; Wang et al., 2017). As shown in Fig. 1, iPerfusion comprises an actuated pressure reservoir used to control Pa and a thermal flow sensor (SLG64, Sensirion, Switzerland) to measure Q. The pressure within the eye relative to the water bath (P) is measured using a differential pressure sensor (PX409, Omegadyne, USA). In the double cannula experiments, the second needle was connected to a 50 μl glass syringe (Gastight, Hamilton, USA), mounted on a syringe pump (PHD Ultra, Harvard Apparatus, USA). Supplementary Information provides an evaluation of the pump performance measured using the flow sensor.
The thermal flow sensor measures Q through a 75 μm glass capillary, which has a hydrodynamic resistance (Rq) in the range 8–10 mmHg/(μl/min) (measured prior to each perfusion). The pressure in the eye (P) thus differs from the applied reservoir pressure (Pa) according to:
| (3) |
Eq. 3 can be used to set the value of Pa in order to achieve a desired P.
The hydrodynamic resistance of the needles, measured prior to each perfusion, was always < 0.2 mmHg/(μl/min). Even at a high flow rate of 200 nl/min, this would result in a pressure drop of < 0.04 mmHg, which is within the resolution of the pressure sensor. The pressure drop across the needle was therefore neglected.
2.2.3 Single Cannula Experiments
Single eyes from individual mice (N=6) were cannulated with a single needle and underwent a 9-step pressure perfusion following previous methods (Sherwood et al., 2016). Briefly, following acclimatisation at 8 mmHg for 30 minutes, the eye was perfused at 9 pressure steps between 4.5 and 21 mmHg. We then measured the flow rate as the pressure approached zero, termed Q(P→0). The approach to zero pressure is asymptotic because the compliance of the eye, as described by Friedenwald’s model (Friedenwald, 1937), is given by 1/KP, where K is the ocular rigidity. Hence the compliance tends towards very high values at low pressures, and larger compliances increase the time to reach steady state. To reduce the time to reach steady state, P was set to 2 mmHg with the flow sensor bypassed (thereby setting Rq = 0 in Eq. 3), instantaneously setting the pressure in the eye to Pa. The flow bypass was then closed, and the applied pressure was set to 0 mmHg. Steady state was defined as when the rate of change of P, calculated by linear regression over a 5 minute window, was less than 0.01 mmHg/min continuously for 1 minute. The mean and standard deviation of Q and P for the pressure step were calculated from the final 4 minutes of data.
2.2.4 Double Cannula Experiments
In these experiments, an artificial pressure-independent flow was imposed through the second cannula using the syringe pump (Fig. 1). The imposed flow rate into the eye was defined to be Qp = 120 nl/min, chosen to approximate the difference between aqueous humour secretion (~150 nl/min), averaged from previous studies (Aihara et al., 2003; Millar et al., 2015; 2011; Toris et al., 2016) and pressure-independent outflow (~30 nl/min), chosen from the reported range of 0–120 nl/min (Boussommier-Calleja et al., 2012; 2015; Boussommier-Calleja and Overby, 2013; Chang et al., 2015; Kumar et al., 2013; Lei et al., 2011; Li et al., 2014; Overby et al., 2014a; Overby et al., 2014b; Rogers et al., 2013).
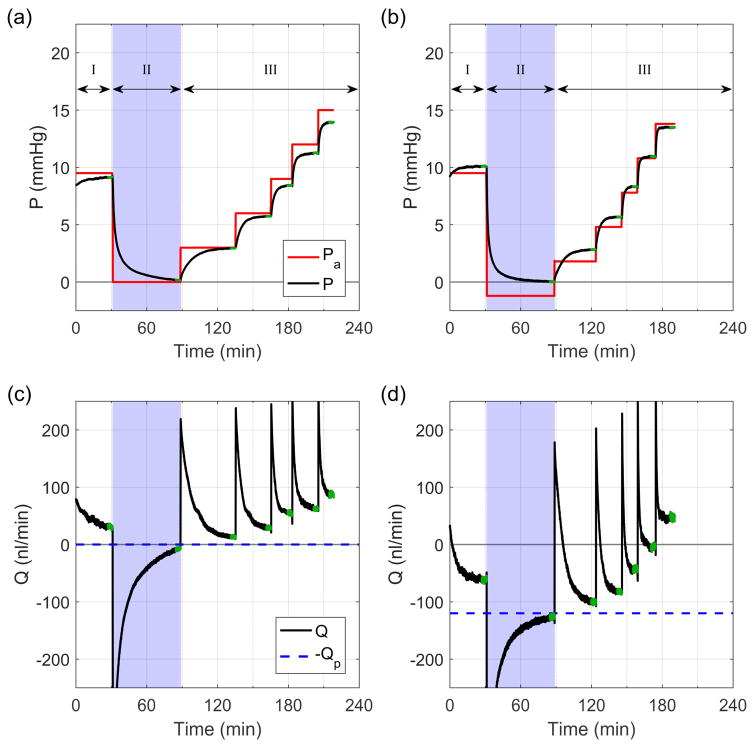
Paired eyes (N=7 pairs) were perfused simultaneously on duplicate iPerfusion systems, where contralateral eyes received an imposed flow rate of 0 or 120 nl/min. The perfusion protocol consisted of three phases: I) acclimatisation, II) direct measurement of Q(P→0), and III) characterisation of the flow-pressure relationship to measure C. Fig. 2 shows a sample tracing from a pair of eyes.
Fig. 2.
Flow (Q) and pressure (P) traces from a typical perfusion from the double cannula experiments. Traces (a) and (c) correspond to recordings from a control eye with Qp = 0 nl/min, while (b) and (d) correspond to recordings from the contralateral experimental eye with Qp = 120 nl/min. Green regions indicate steady state. Note that the difference between Pa and P arises from the resistance of the flow sensor, Rq, and the compliance of the eye.
Phase I: Acclimatisation
During phase I the reservoir pressure was set to Pa = 9.5 mmHg for 30 minutes to allow the eye to acclimatise to the perfusion system.
Phase II: Direct measurement of pressure-independent flow
Phase II is indicated by the blue shaded regions in Fig. 2. For the control case, where Qp = 0 nl/min, Pa was set to 0 mmHg (Fig. 2a). For the experimental case where Qp = 120 nl/min, Pa was set to −RqQp (see Eq. 3), using the value of Rq measured prior to the perfusion. A period of 60 minutes was allowed, and the final pressure and Q(P→0) were calculated as the average pressure and flow rate over the final 4 minutes.
Phase III: Measuring outflow facility
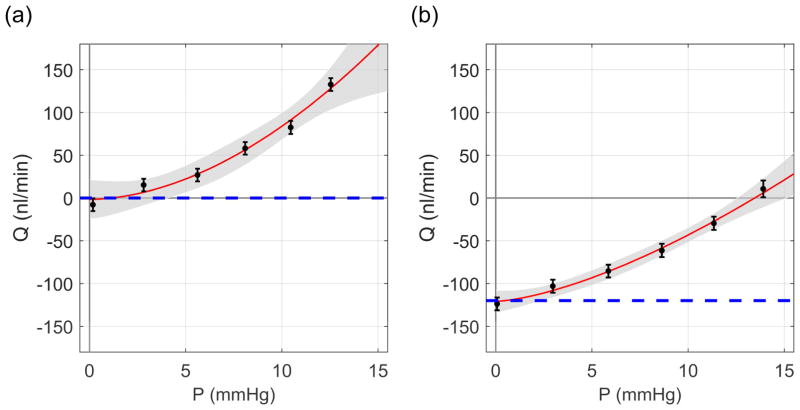
The flow-pressure relationship was then evaluated over 5 additional pressure steps, equally spaced in the range Pa = 3–15 mmHg. Steady state at each step was determined once the rate of change of Q/P, calculated by linear regression over a 5 minute window, was continuously less than 0.1 nl/min/mmHg/min for 1 minute. The mean and standard deviation of the final 4 minutes were then extracted and defined as the steady state flow rate and pressure for each step (see green regions in Fig. 2 and data points in Fig. 3). In order to estimate the outflow facility, we fit a power law model based on our previous study (Sherwood et al., 2016), but with Q0 added as a free parameter to allow for pressure-independent flow:
| (4) |
where Cr is the ‘reference facility’ at a ‘reference pressure’ of Pr = 8 mmHg, defined based on the physiological pressure drop between the anterior chamber and episcleral vessels. The exponent β characterises the nonlinearity of the flow-pressure relationship. Eq. 4 was fit to the data using weighted non-linear regression, with weights defined as the reciprocal variance of the flow rate over the 4-minute window for each step. Sample flow-pressure plots with best fits and confidence intervals are given in Fig 3.
Fig. 3.
Sample flow-pressure plots. (a) Control eye with Qp = 0 nl/min and (b) the contralateral experimental eye with Qp = 120 nl/min. Dashed lines illustrate −Qp. Red curves represent the best fit of Eq. 4 to the flow-pressure data, with the 95% confidence intervals shown in grey. Error bars represent two standard deviations.
2.3 Statistics
Statistics for normally distributed data, such as pressure or flow rate, are reported in the form
| (5) |
where, Q̄ is the mean or best fit parameter, MEQ̄,95 is the 95% margin of error (the half-width of the 95% confidence interval (CI)) and sQ is the sample standard deviation.
Facility, C, is better represented by a lognormal distribution (Sherwood et al., 2016). Hence the fold change in facility between paired eyes is also lognormally distributed. To account for the multiplicative nature of the lognormal distribution, statistical values of facility, or fold changes in facility, are given in the form
| (6) |
where C̄* is the geometric mean, with 95% margin of error MEC̄*,95 and geometric sample standard deviation , as described in our previous study (Sherwood et al., 2016). All statistical analyses on facility were carried out on the log-transformed reference facility, Yr= log(Cr), yielding a normally distributed parameter, Yr, suitable for the t-test.
3. Results
3.1 What is the magnitude of pressure-independent flow in enucleated mouse eyes?
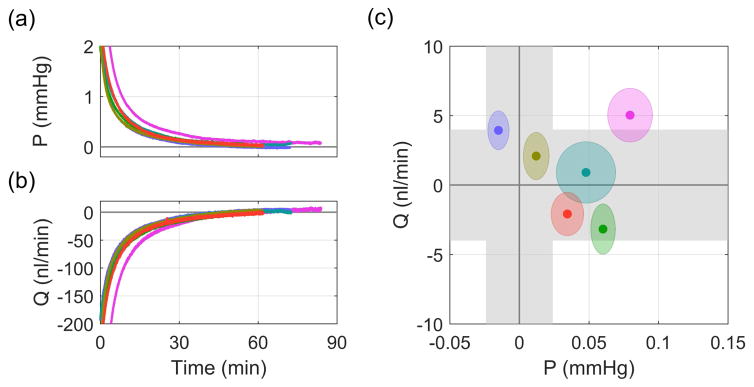
We first measured pressure-independent flow at zero pressure in enucleated mouse eyes. Figs. 4a and b show how the pressure and flow rate asymptotically approached zero after setting Pa = 0 in the single cannula experiments. Fig. 4c shows the steady state flow and pressure values, with each point representing the mean for a given eye and ellipses indicating two standard deviations. The grey bands indicate the measurement uncertainty of the flow and pressure sensors (see Supplemental Information 1 in Sherwood et al. (2016)). For these six eyes, the average Q(P→0) was 1 ± 4 (7) nl/min (see Eq. 5), which was not significantly different from zero (p = 0.44). The average steady state pressure was approximately zero, 0.04 ± 0.04 (0.07) mmHg, within the accuracy of the pressure sensor. This confirms that there is zero pressure-independent flow in enucleated mouse eyes.
Fig. 4.
Direct measurement of Q(P→0) in the single cannula experiments. (a) Pressure and (b) flow traces after Pa was set to 0 mmHg. (c) Steady state values of pressure and flow. Grey regions indicate sensor uncertainty and ellipses show two standard deviations on the recorded flow and pressure signals.
3.2 Can iPerfusion measure pressure-independent flow when it is present?
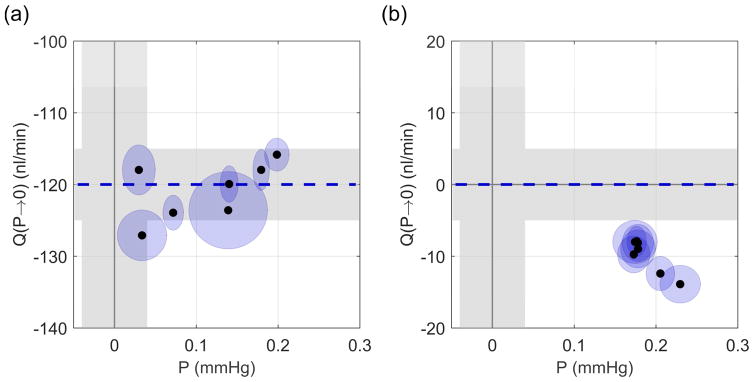
Figs. 5a and b show the values of Q(P→0) measured during Phase II of the double cannula experiments. For the experimental eyes (Fig. 5a), in which there was a pressure-independent flow into the eye of Qp = 120 nl/min, the mean Q(P→0) was −121 ± 4 (8) nl/min with a mean P of 0.11 ± 0.07 (0.14) mmHg. Q(P→0) was insignificantly different from −Qp (p = 0.58, N=7). Note that the negative value of the measured flow rate indicates net flow out of the eye, as expected. For the control eyes (Fig. 5b), where Qp = 0 nl/min, the mean Q(P→0) was −10 ± 2 (5) nl/min. The difference between −Qp and Q(P→0) was small but detectible (p < 10−3, N=7), and attributable to the control eyes not having fully reached steady state, as the final mean pressure (0.19 ± 0.02 (0.04) mmHg) had not quite reached zero (p < 10−3). Note that for all control eyes, Q(P→0) was negative and therefore cannot be interpreted as pressure independent outflow, which would yield a positive Q.
Fig. 5.
Direct measurement of Q(P→0) from Phase II of the double cannula experiments. (a) Experimental eyes with Qp = 120 nl/min, (b) control eyes with Qp = 0 nl/min. Grey regions indicate sensor uncertainty and ellipses show two standard deviations. Dashed blue line indicates −Qp.
3.3 Does pressure-independent flow affect facility measured by iPerfusion?
Finally, we consider whether the presence of pressure-independent flow, should it exist as in vivo, affects measurements of outflow facility. Fig. 6 compares the reference facility Cr, measured in the contralateral control and experimental eyes, where the ellipses represent the 95% confidence bounds on Cr. If an ellipse overlaps the unity line, the difference in facility between the control and experimental eyes of that mouse is not significantly different from zero (equivalent to a fold difference of unity). Analysing all the pairs yields an average fold difference of 0.98 x/1.27 (1.67) (see Eq. 6), which is not significantly different from unity (p = 0.82, N=7 pairs). The average facility for all 14 eyes was 6.25*/1.14 (1.55) nl/min/mmHg.
Fig. 6.
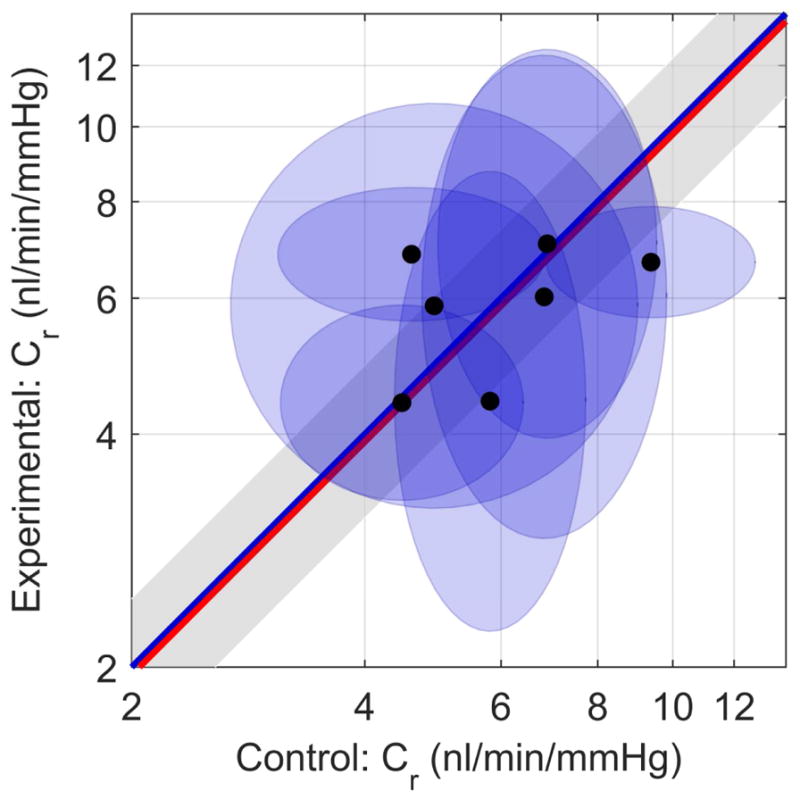
Paired plot of reference facility Cr. Control eyes (Qp = 0 nl/min along x-axis), Experimental eyes (Qp = 120 nl/min along y-axis). Each data point represents one mouse, and ellipses indicate 95% confidence intervals on Cr. The blue unity line represents the ideal case of perfect agreement in Cr between contralateral eyes, while the red line indicates the mean difference in measured facility between paired eyes. The grey shaded region indicates the confidence interval on the mean difference.
4. Discussion
In the present study, we report the first direct measurements of pressure-independent aqueous humour flow. By equalising the pressure between the eye and the bath, flow across the pressure-dependent pathways was eliminated. This left only pressure-independent flow, Q0, which represents the difference between inflow and pressure-independent outflow. Using iPerfusion, we demonstrated that Q0 = 0 in enucleated mouse eyes. Further, when a known Q0 was imposed, we could accurately measure it.
4.1 The absence of pressure-independent flow ex vivo
For the ex vivo eyes in the present study, aqueous humour secretion would be expected to rapidly approach zero, due to cessation of blood flow. Hence, ex vivo measurements of Q0 would reflect Qu, the pressure-independent outflow. Our direct measurements gave an average Q0 of 1 ± 4 (7) nl/min (N=6). From this, we conclude that the magnitude of the pressure-independent outflow in enucleated mouse eyes is insignificantly different from zero, and if present has a magnitude of less than ~5 nl/min. This result is in contrast with prior estimates of pressure-independent outflow in C57 mice of similar ages, as estimated by extrapolation in enucleated eyes which vary between 0 to 120 nl/min (Boussommier-Calleja et al., 2015; 2012; Boussommier-Calleja and Overby, 2013; Chang et al., 2015; Kumar et al., 2013; Lei et al., 2011; Li et al., 2014; Overby et al., 2014a; Overby et al., 2014b; Rogers et al., 2013). This indicates that linear extrapolation is not an appropriate method for predicting pressure-independent flow in mouse eyes. Although there is no pressure-independent flow in enucleated eyes, there are reports suggesting that pressure-independent flow may exist in eyes perfused in situ following death (Millar et al., 2015; 2011). Additionally, insufficient hydration of the corneoscleral shell during a perfusion can result in an evaporative loss that generates an artefactual pressure-independent outflow (Boussommier-Calleja et al., 2015).
4.2 What about uveoscleral outflow?
The absence of pressure-independent flow does not imply that there is no uveoscleral outflow. In contrast to the functional description of ‘pressure-independent flow’ used in this study, uveoscleral outflow is an anatomical definition. The uveoscleral outflow pathway comprises flow through gaps in the ciliary muscle, into the supraciliary and suprachoroidal spaces, and thence across the sclera into the extraocular space. Flow through each of these tissues is driven by a pressure gradient, and is hence by definition, pressure-dependent. However, the hydrodynamic resistances of these tissues may vary with pressure.
As flow through the uveoscleral tissues is pressure-dependent, in the absence of a pressure gradient, we would not expect any uveoscleral outflow. At higher pressures, uveoscleral outflow may well occur ex vivo, but it is not possible to distinguish anatomical flow routes (i.e. uveoscleral from trabecular outflow) from perfusion measurements alone.
The value of C measured by perfusion combines the influence of trabecular and uveoscleral outflow facilities, along with any other pressure-dependent flow mechanisms, (including pseudofacility: the pressure-dependent decrease in aqueous humour secretion (Becker and Neufeld, 2002; Kaufman, 2003)). In vivo, the pressure gradient driving uveoscleral outflow is determined by the intraocular and extraocular pressures, P – P0, in contrast to that for trabecular outflow, which is determined by the difference between the intraocular and episcleral vessel pressures, P - Pe. Including these terms in Equation (1) yields a form of the modified Goldmann’s equation:
| (7) |
where Ctr and Cu are the trabecular and uveoscleral outflow facilities, respectively, Cps is the pseudofacility, Pcc is the ciliary processes capillary pressure and Qu represents any pressure-independent outflow that may be present in vivo, such as that due to uveovortex outflow. For enucleated eyes, there is no aqueous humour production (Qin = 0, Cps = 0), zero pressure-independent outflow (Qu = 0), and extraocular and episcleral vessel pressures are equal to the external reference pressure. Equation 7 thus reduces to:
4.3 How does Q0 affect our interpretation of flow-pressure data?
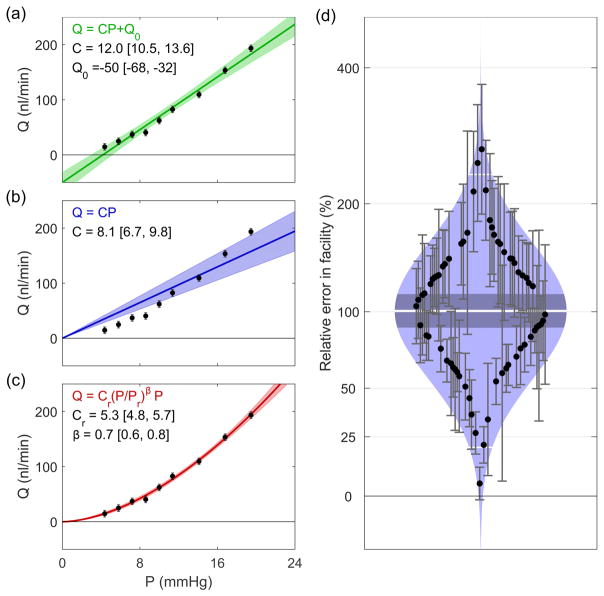
Pressure-independent outflow has typically been interpreted as the intercept from a linear fit to the flow-pressure data. This ostensibly represents the outflow rate when the pressure drop across all pressure-dependent pathways is eliminated. What has not generally been recognised is that this interpretation has a considerable impact on the assessment of outflow facility. To demonstrate this Figs. 7a–c show different fits to a representative flow-pressure data set, artificially generated based on the average values from iPerfusion measurements of 66 C57 mice (Cr = 5.5 nl/min/mmHg, β = 0.66) (Sherwood et al., 2016). A normally distributed random noise was applied to the flow rates with a standard deviation of 3 nl/min, consistent with previous iPerfusion data (see Supplementary Information 1 in Sherwood et al. (2016)).
Fig. 7.
Comparison of models for fitting flow-pressure data. (a) Common linear model, (b) linear model with zero intercept, (c) power law model. Shaded regions indicate the 95% confidence intervals of the fits. (d) Cello plot showing relative error in estimates of facility when using the common linear model. Shaded regions indicate predicted lognormal distribution, with the mean (central white line), confidence interval on the mean (central dark band), and ± two standard deviations around the mean (outer white lines). Each data point shows an individual eye and error bars indicate the 95% confidence interval on the relative error. Data reprocessed from (Sherwood et al., 2016).
Fig. 7a shows the common linear fit (with a finite Q0 as a free parameter). For this representative case, the fit yields Q0 = −50 [−60,−32] nl/min (mean [95% CI]), and Cr = 12.0 [10.5, 13.6] nl/min/mmHg. However, as we have demonstrated that Q0 = 0, this fit is clearly not appropriate, as the estimated value of Q0 is significantly different from zero. If one enforces Q0 = 0, but still imposes a linear fit (thereby implicitly defining a constant facility, see Fig. 7b), the model is clearly not appropriate as it does not capture the form of the data. Hence, it must be concluded that the facility itself is a function of pressure for these measurements. A power law model of the form of Eq. 4, but with Q0 = 0, can characterise the pressure-dependence of the outflow facility (Fig. 7c). The reference facility predicted by the power law model is 5.3 [4.8, 5.7] nl/min/mmHg.
In order to demonstrate how this impacts estimates of facility over a large sample, we reevaluated data from 66 C57 mouse eyes described in a previous study (Sherwood et al., 2016). Fig. 7d shows a ‘Cello Plot’, statistically summarising the proportional difference between the facility estimated using linear (with Q0 as a free parameter) and power law models. As we have shown that Q0 = 0 and the facility varies as a function of pressure, using the linear model that does not account for these effects introduces an error in the estimation of outflow facility. The average error was 100% [88, 114 %] (mean [95% CI], indicated by the central white line and dark band respectively). The two standard deviation range covers 20–234%, meaning that for a given eye, the error introduced by incorrect use of the common linear model would result in a large but relatively unpredictable error in the estimate of facility. Although the cause of the non-linearity in the present data may be artefactual and the conditions will differ between post mortem and in vivo perfusions, some degree of nonlinearity is expected in all data as a linear relationship is a special case.
4.4 How does pressure-independent flow affect facility measurements?
Using the power law model with Q0 as a free parameter (Eq. 4), we compared the facility between contralateral eyes, with only one eye receiving an imposed Q0. The average fold difference between contralateral eyes was 0.98 x/1.27 (1.67), which compares well with 1.08 x/1.17 (1.57), reported in our previous study (Sherwood et al., 2016) for 10 pairs of eyes with a single cannula, following the stepping protocol used for the single cannula experiments. The two geometric standard deviation levels for the two data sets (1.67 vs 1.57) are similar, indicating that the presence of the pressure-independent flow has negligible impact on our ability to resolve facility, provided that the pressure-dependent changes in facility are accounted for, as with Eq. 4.
4.5 Towards in vivo measurements
For in vivo perfusion measurements, the episcleral vessel pressure would be non-zero, and therefore Pe would need to be measured to assess Q0. Using the technique proposed in the present study, P could be set to Pe and Q0 could be directly measured.
Measurement of Pe could be carried out using the method of lowering the intraocular pressure until red blood cells can be observed in Schlemm’s canal (Aihara et al., 2003; Millar et al., 2011). Due to the uncertainty in measuring Pe, the acquired Q0 measurements in vivo would be less accurate than in ex vivo measurements. Considering Eq. 1 and 2, any inaccuracy in the estimated Pe would alter the measured value of Q0 by a factor of C(P-Pe). Assuming C = 5.5 nl/min, if we could identify Pe to within ± 2 mmHg, this would correspond to an uncertainty of approximately ± 10 nl/min in the direct measurement of Q0 (approximately a 2SD range), indicating that the approach should be robust.
For in vivo measurements, the >60 minutes required to measure Q(P→0) would be significantly shortened, as at P = Pe, the ocular compliance would be reduced several fold compared to P = 0. Furthermore, newly available flow sensors with 150 μm inner capillaries (Sensirion SLG150) have an Rq that is sixteen-fold lower than present sensors with a 75 μm capillary. Hence, we would expect to be able to measure Q0 within 5 minutes in vivo, having first determined Pe.
Limitations
A single value of pressure-independent flow was investigated, at a magnitude chosen based on various reports of mouse eyes from multiple strains and ages. However, the two standard deviation range from our data suggests that we could have measured any value of Q0 within approximately 7 nl/min for a given eye. Further experiments requiring more animals were therefore not justified.
This study included only enucleated eyes, and thus neglects the complexity of in vivo AHD. We chose this approach because enucleated eyes provide a platform for validating our method to measure Q0 that would not be possible in vivo. First, using enucleated eyes reduces the number of unknown parameters in Eq. 1 from three in vivo (C, Q0, Pe), to one ex vivo (C), as we have shown that Q0 = 0 in enucleated eyes under normal perfusion conditions. Thus, ex vivo measurements of C have lower uncertainty than in vivo measurements. Second, enucleated eyes allow us to impose a constant, known value of Q0 and demonstrate that our method reproduces this value. In vivo, any potential changes in Qin, Qu or Pe, as may be caused by anaesthesia for instance, would confound any attempt at validation. Third, enucleated eyes allow tighter control of temperature and hydration, which have been shown to affect measured values of C and Q0 (Boussommier-Calleja et al., 2015). Future studies will extend this work to in vivo eyes.
Conclusions
Hitherto, estimates of pressure-independent flow have been made indirectly, by extrapolating a (typically linear) fit to flow-pressure data. In this study, we described and tested an approach to directly measure pressure-independent flow in mouse eyes. Using this technique, we showed that in properly hydrated ex vivo mouse eyes, there is no pressure-independent flow, in contrast to previous studies using the extrapolation approach. We then imposed a pressure-independent flow using a syringe pump and demonstrated that we could accurately measure the imposed flow rate. We further demonstrated that the presence of pressure-independent flow did not influence measurements of facility, as long as the pressure-dependence of outflow facility was considered when analysing the data. The technique validated in this study will be applicable to in vivo analyses, enabling the first direct pressure-independent flow measurements in vivo.
Supplementary Material
Highlights.
We report the first direct measurement of net pressure-independent AH flow (Q0).
Q0 is the difference between aqueous humour inflow and pressure-independent outflow.
In enucleated mouse eyes, Q0 = 0, in contrast with previous estimates.
When a known Q0 is imposed, we can measure it accurately (within 10 nl/min).
Inaccurate assessment of Q0 leads to significant errors when measuring facility.
Acknowledgments
We acknowledge funding support from the BrightFocus Foundation (G2015145), National Eye Institute (EY022359) and a PhD Studentship from Fight for Sight (UK; 1385).
Footnotes
Publisher's Disclaimer: This is a PDF file of an unedited manuscript that has been accepted for publication. As a service to our customers we are providing this early version of the manuscript. The manuscript will undergo copyediting, typesetting, and review of the resulting proof before it is published in its final citable form. Please note that during the production process errors may be discovered which could affect the content, and all legal disclaimers that apply to the journal pertain.
References
- Aihara M, Lindsey JD, Weinreb RN. Aqueous humor dynamics in mice. Invest Ophthalmol Vis Sci. 2003;44:5168–5173. doi: 10.1167/iovs.03-0504. [DOI] [PubMed] [Google Scholar]
- Becker B, Neufeld AH. Pressure dependence of uveoscleral outflow. J Glaucoma. 2002;11:464. doi: 10.1097/00061198-200210000-00017. [DOI] [PubMed] [Google Scholar]
- Bill A, Phillips CI. Uveoscleral drainage of aqueous humour in human eyes. Exp Eye Res. 1971;12:275–281. doi: 10.1016/0014-4835(71)90149-7. [DOI] [PubMed] [Google Scholar]
- Boussommier-Calleja A, Bertrand J, Woodward DF, Ethier CR, Stamer WD, Overby DR. Pharmacologic manipulation of conventional outflow facility in ex vivo mouse eyes. Invest Ophthalmol Vis Sci. 2012;53:5838–5845. doi: 10.1167/iovs.12-9923. [DOI] [PMC free article] [PubMed] [Google Scholar]
- Boussommier-Calleja A, Li G, Wilson A, Ziskind T, Scinteie OE, Ashpole NE, Sherwood JM, Farsiu S, Challa P, Gonzalez P, Downs JC, Ethier CR, Stamer WD, Overby DR. Physical factors affecting outflow facility measurements in mice. Invest Ophthalmol Vis Sci. 2015;56:8331–8339. doi: 10.1167/iovs.15-17106. [DOI] [PMC free article] [PubMed] [Google Scholar]
- Boussommier-Calleja A, Overby DR. The influence of genetic background on conventional outflow facility in mice. Invest Ophthalmol Vis Sci. 2013;54:8251–8258. doi: 10.1167/iovs.13-13025. [DOI] [PMC free article] [PubMed] [Google Scholar]
- Chandrawati R, Chang JYH, Reina-Torres E, Jumeaux C, Sherwood JM, Stamer WD, Zelikin AN, Overby DR, Stevens MM. Localized and controlled delivery of nitric oxide to the conventional outflow pathway via enzyme biocatalysis: toward therapy for glaucoma. Adv Mater. 2017;29:1604932. doi: 10.1002/adma.201604932. [DOI] [PMC free article] [PubMed] [Google Scholar]
- Chang JYH, Stamer WD, Bertrand J, Read AT, Marando CM, Ethier CR, Overby DR. Role of nitric oxide in murine conventional outflow physiology. Am J Physiol Cell Physiol. 2015;309:C205–C214. doi: 10.1152/ajpcell.00347.2014. [DOI] [PMC free article] [PubMed] [Google Scholar]
- Crowston JG, Aihara M, Lindsey JD, Weinreb RN. Effect of latanoprost on outflow facility in the mouse. Invest Ophthalmol Vis Sci. 2004;45:2240–2245. doi: 10.1167/iovs.03-0990. [DOI] [PubMed] [Google Scholar]
- Friedenwald JS. Contribution to the theory and practice of tonometry. Am J Ophthalmol. 1937;20:985–1024. [Google Scholar]
- Grant WM. Clinical measurements of aqueous outflow. AMA Arch Ophthalmol. 1951;46:113–131. doi: 10.1001/archopht.1951.01700020119001. [DOI] [PubMed] [Google Scholar]
- Johnson M, McLaren JW, Overby DR. Unconventional aqueous humor outflow: A review. Exp Eye Res. 2017;158:94–111. doi: 10.1016/j.exer.2016.01.017. [DOI] [PMC free article] [PubMed] [Google Scholar]
- Kaufman PL. Some thoughts on the pressure dependence of uveoscleral flow. J Glaucoma. 2003;12:89. doi: 10.1097/00061198-200302000-00018. [DOI] [PubMed] [Google Scholar]
- Kumar S, Shah S, Deutsch ER, Tang HM, Danias J. Triamcinolone acetonide decreases outflow facility in C57BL/6 mouse eyes. Invest Ophthalmol Vis Sci. 2013;54:1280–1287. doi: 10.1167/iovs.12-11223. [DOI] [PMC free article] [PubMed] [Google Scholar]
- Lei Y, Overby DR, Boussommier-Calleja A, Stamer WD, Ethier CR. Outflow physiology of the mouse eye: pressure dependence and washout. Invest Ophthalmol Vis Sci. 2011;52:1865–1871. doi: 10.1167/iovs.10-6019. [DOI] [PMC free article] [PubMed] [Google Scholar]
- Li G, Farsiu S, Chiu SJ, Gonzalez P, Lütjen-Drecoll E, Overby DR, Stamer WD. Pilocarpine-induced dilation of Schlemm’s canal and prevention of lumen collapse at elevated intraocular pressures in living mice visualized by OCT. Invest Ophthalmol Vis Sci. 2014;55:3737–3746. doi: 10.1167/iovs.13-13700. [DOI] [PMC free article] [PubMed] [Google Scholar]
- Li G, Mukherjee D, Navarro I, Ashpole NE, Sherwood JM, Chang J, Overby DR, Yuan F, Gonzalez P, Kopczynski CC, Farsiu S, Stamer WD. Visualization of conventional outflow tissue responses to netarsudil in living mouse eyes. Eur J Pharmacol. 2016;787:20–31. doi: 10.1016/j.ejphar.2016.04.002. [DOI] [PMC free article] [PubMed] [Google Scholar]
- Millar JC, Clark AF, Pang IH. Assessment of aqueous humor dynamics in the mouse by a novel method of constant-flow infusion. Invest Ophthalmol Vis Sci. 2011;52:685–694. doi: 10.1167/iovs.10-6069. [DOI] [PubMed] [Google Scholar]
- Millar JC, Phan TN, Pang IH, Clark AF. Strain and age effects on aqueous humor dynamics in the mouse. Invest Ophthalmol Vis Sci. 2015;56:5764–5776. doi: 10.1167/iovs.15-16720. [DOI] [PubMed] [Google Scholar]
- Overby DR, Bertrand J, Schicht M, Paulsen F, Stamer WD, Lütjen-Drecoll E. The structure of the trabecular meshwork, its connections to the ciliary muscle, and the effect of pilocarpine on outflow facility in mice. Invest Ophthalmol Vis Sci. 2014a;55:3727–3736. doi: 10.1167/iovs.13-13699. [DOI] [PMC free article] [PubMed] [Google Scholar]
- Overby DR, Bertrand J, Boussommier-Calleja A, Tektas OY, Schicht M, Ethier CR, Stamer WD, Woodward DF, Lütjen-Drecoll E. Ultrastructural changes associated with dexamethasone-induced ocular hypertension in mice. Invest Ophthalmol Vis Sci. 2014b;55:4922–4933. doi: 10.1167/iovs.14-14429. [DOI] [PMC free article] [PubMed] [Google Scholar]
- O’Callaghan J, Crosbie DE, Cassidy PS, Sherwood JM, Flügel-Koch C, Lütjen-Drecoll E, Humphries MM, Reina-Torres E, Wallace D, Kiang AS, Campbell M, Stamer WD, Overby DR, O’Brien C, Tam LCS, Humphries P. Therapeutic potential of AAV-mediated MMP-3 secretion from corneal endothelium in treating glaucoma. Hum Mol Genet. 2017;26:1230–1246. doi: 10.1093/hmg/ddx028. [DOI] [PMC free article] [PubMed] [Google Scholar]
- Reina-Torres E, Wen JC, Liu KC, Li G, Sherwood JM, Chang JYH, Challa P, Flügel-Koch CM, Stamer WD, Allingham RR, Overby DR. VEGF as a paracrine regulator of conventional outflow facility. Invest Ophthalmol Vis Sci. 2017;58:1899–1908. doi: 10.1167/iovs.16-20779. [DOI] [PMC free article] [PubMed] [Google Scholar]
- Resnikoff S, Pascolini D, Etyaale D, Kocur I, Pararajasegaram R, Pokharel GP, Mariotti SP. Global data on visual impairment in the year 2002. Bull World Health Organ. 2004;82:844–851. [PMC free article] [PubMed] [Google Scholar]
- Rogers ME, Navarro ID, Perkumas KM, Niere SM, Allingham RR, Crosson CE, Stamer WD. Pigment epithelium-derived factor decreases outflow facility. Invest Ophthalmol Vis Sci. 2013;54:6655–6661. doi: 10.1167/iovs.13-12766. [DOI] [PMC free article] [PubMed] [Google Scholar]
- Sherwood JM, Reina-Torres E, Bertrand JA, Rowe B, Overby DR. Measurement of outflow facility using iPerfusion. PLoS One. 2016;11:e0150694. doi: 10.1371/journal.pone.0150694. [DOI] [PMC free article] [PubMed] [Google Scholar]
- Stamer WD, Acott TS. Current understanding of conventional outflow dysfunction in glaucoma. Curr Opin Ophthalmol. 2012;23:135–143. doi: 10.1097/ICU.0b013e32834ff23e. [DOI] [PMC free article] [PubMed] [Google Scholar]
- Tam LCS, Reina-Torres E, Sherwood JM, Cassidy PS, Crosbie DE, Lütjen-Drecoll E, Flügel-Koch C, Perkumas K, Humphries MM, Kiang AS, O’Callaghan J, Callanan JJ, Read AT, Ethier CR, O’Brien C, Lawrence M, Campbell M, Stamer WD, Overby DR, Humphries P. Enhancement of outflow facility in the murine eye by targeting selected tight-junctions of Schlemm’s canal endothelia. Sci Rep. 2017;7:40717. doi: 10.1038/srep40717. [DOI] [PMC free article] [PubMed] [Google Scholar]
- Toris CB, Fan S, Johnson TV, Camras LJ, Hays CL, Liu H, Ishimoto BM. Aqueous flow measured by fluorophotometry in the mouse. Invest Ophthalmol Vis Sci. 2016;57:3844–3852. doi: 10.1167/iovs.14-15144. [DOI] [PMC free article] [PubMed] [Google Scholar]
- Toris CB, Gleason ML, Camras CB, Yablonski ME. Effects of brimonidine on aqueous humor dynamics in human eyes. Arch Ophthalmol. 1995;113:1514–1517. doi: 10.1001/archopht.1995.01100120044006. [DOI] [PubMed] [Google Scholar]
- Townsend DJ, Brubaker RF. Immediate effect of epinephrine on aqueous formation in the normal human eye as measured by fluorophotometry. Invest Ophthalmol Vis Sci. 1980;19:256–266. [PubMed] [Google Scholar]
- Van Veldhuisen PC, Ederer F, Gaasterland DE, Sullivan EK, Beck AD, Prum BE, Jr, Cyrlin MN, Weiss H. The advanced glaucoma intervention study (AGIS): 7. The relationship between control of intraocular pressure and visual field deterioration. Am J Ophthalmol. 130:429–440. doi: 10.1016/s0002-9394(00)00538-9. [DOI] [PubMed] [Google Scholar]
- Wang K, Read AT, Sulchek T, Ethier CR. Trabecular meshwork stiffness in glaucoma. Exp Eye Res. 2017;158:3–12. doi: 10.1016/j.exer.2016.07.011. [DOI] [PMC free article] [PubMed] [Google Scholar]
- Zhang D, Vetrivel L, Verkman AS. Aquaporin deletion in mice reduces intraocular pressure and aqueous fluid production. J Gen Physiol. 2002;119:561–569. doi: 10.1085/jgp.20028597. [DOI] [PMC free article] [PubMed] [Google Scholar]
- Zhang Y, Davidson BR, Stamer WD, Barton JK, Marmorstein LY, Marmorstein AD. Enhanced inflow and outflow rates despite lower IOP in bestrophin-2-deficient mice. Invest Ophthalmol Vis Sci. 2009;50:765–770. doi: 10.1167/iovs.08-2501. [DOI] [PMC free article] [PubMed] [Google Scholar]
Associated Data
This section collects any data citations, data availability statements, or supplementary materials included in this article.


