

Abstract
Cell survival is regulated by a signaling network driven by the activity of protein kinases; however, determining the contribution that each kinase in the network makes to such regulation remains challenging. Here, we report a computational approach that uses mass spectrometry-based phosphoproteomics data to rank protein kinases based on their contribution to cell regulation. We found that the scores returned by this algorithm, which we have termed kinase activity ranking using phosphoproteomics data (KARP), were a quantitative measure of the contribution that individual kinases make to the signaling output. Application of KARP to the analysis of eight hematological cell lines revealed that cyclin-dependent kinase (CDK) 1/2, casein kinase (CK) 2, extracellular signal-related kinase (ERK), and p21-activated kinase (PAK) were the most frequently highly ranked kinases in these cell models. The patterns of kinase activation were cell-line specific yet showed a significant association with cell viability as a function of kinase inhibitor treatment. Thus, our study exemplifies KARP as an untargeted approach to empirically and systematically identify regulatory kinases within signaling networks.
Cells respond to their environment through a network of biochemical reactions driven by protein kinases (1). Such networks regulate essential biological functions in normal cells and are often dysregulated in different diseases, including cancer (2, 3). The human genome codes for 518 protein kinase genes (4) and approximately half of these are expressed in a given cell type (5, 6). Determining the contributions that different kinases make to cellular regulation is challenging, however, as each kinase's contribution is dependent on contextual information provided by the biochemical composition of the extracellular milieu (7–9) and changes as a result of development or disease.
Given that each phosphorylation site is the result of protein kinase activity (opposed by a phosphatase), the phosphoproteome (the collection of all phosphorylation sites in cells) contains information regarding the net activity of all kinases expressed in the system being measured. Therefore, there is a strong community interest in the development of computational methods to extract kinase regulatory information from phosphoproteomics data (10–12). The phosphoproteome can now be efficiently explored by mass spectrometry (MS) (13, 14). Efforts have been made to compare relative kinase activation using MS-based phosphoproteomics data with methods such as kinase substrate enrichment analysis (KSEA), which allow the inference of differences in kinase activities between experimental conditions (15–18). Phosphoproteomics data obtained from drug perturbation experiments may also be used to infer signaling circuitry (19–22). These approaches, although useful for the comparison of signaling networks across conditions, do not provide information as to which kinases contribute more to signaling regulation relative to each other within an individual cell population.
Here, we present the theoretical and experimental basis of a methodology, termed kinase activity ranking using phosphoproteomics data (KARP), which aims to infer the contributions made by individual kinases to signaling regulation in an untargeted manner. We first determined whether kinase activities could be inferred and ranked relative to one another from phosphoproteomics data obtained from a single cell population. We found that KARP accurately predicted the impact that targeting given kinases would have on cell viability, thus allowing an understanding, in quantitative terms, of the contribution of individual kinases to cell regulation.
EXPERIMENTAL PROCEDURES
Cell Culture
B-cell lymphoma and leukemia cell lines were routinely maintained in RPMI 1640 medium supplemented with 10% FBS and 100 U·ml−1 penicillin/streptomycin. Cells were maintained at a confluency of 0.5–2.0 × 10⁶ cells·ml−1. Murine stromal cells were grown in IMDM1 medium (supplemented with 10% FBS and 100 U·ml−1 penicillin/streptomycin) and maintained at a confluency of 2.0–30.0 × 10⁶ cells in 175 cm2 flasks. Murine stromal (MS)-5-cell-conditioned IMDM medium was generated by growing stromal cells in IMDM for 3 days. All cells were kept at 37 °C in a humidified atmosphere at 5% CO2.
Cell Lysis and Protein Digestion
A total of 10 × 106 cells were seeded at 0.5 × 10⁶ cells·ml−1 and left overnight. For each acute myeloid leukemia primary sample, 10 × 106 cells were seeded at 1 × 10⁶ cells·ml−1 and left in the incubator for 2 h. Cells were subsequently harvested by centrifugation, washed twice with ice-cold phosphate-buffered saline—supplemented with 1 mm Na3VO4 and 1 mm NaF—and lysed in 0.2 ml of ice-cold urea lysis buffer (8 m urea in 20 mm HEPES (pH 8.0), supplemented with 1 mm Na3VO4, 1 mm NaF, 1 mm Na2H2P2O7, and 1 mm β-glycerol phosphate). Lysates were further homogenized by sonication, and any insoluble material removed by centrifugation. Protein concentration was estimated via the bicinchoninic acid assay. After normalizing each condition to a common protein concentration (0.5 μg·μl−1), each sample was reduced and alkylated by sequential incubation with 10 mm dithiothreitol and 16.6 mm iodoacetamide for 30 min at room temperature in the dark. For protein digestion, the urea concentration was reduced to 2 m through the addition of 20 mm HEPES (pH 8.0). Immobilized tosyl-lysine chloromethyl ketone-trypsin was then added, and samples incubated overnight at 37 °C. Trypsin beads were removed by centrifugation and the resultant peptide solutions were desalted using Oasis hydrophilic-lipophilic balance (HLB) 1cc solid-phase extraction cartridges as described previously (23).
Phosphopeptide Enrichment
Phosphorylated peptides were enriched using TiO2 (GL Sciences) as previously described (21). The resulting phosphopeptide solutions were snap-frozen, dried with a SpeedVac, and stored at −80 °C until further use.
LC-MS/MS Phosphoproteomics Analysis
For cell-line samples, each biological replicate was analyzed twice by LC-MS/MS as follows: Phosphopeptide pellets were resuspended in 14 μl of 0.1% TFA, and 4.0 μl per technical replicate was injected into a Waters NanoACQUITY UPLC system (Waters, Manchester, U.K.) coupled online to an LTQ-Orbitrap-XL mass spectrometer (Thermo Fisher Scientific). The samples were separated on a 100 min linear gradient between 5 and 35% acetonitrile (ACN) on an ACQUITY BEH130 C18 UPLC column (15 cm × 75 μm, 1.7 μm, 130 Å) at a flow rate of 300 nl·min−1. The top five most intense multiply charged ions in each MS1 scan were selected for collision-induced dissociation fragmentation (with multistage activation enabled). The resolution of the MS1 was set to 30,000 full-width half-maximum (FWHM).
Experimental Design and Statistical Rationale
For each cell line, four independent biological replicates were performed, and these were analyzed in technical triplicate. Peptide identification was performed by matching deisotoped, MS/MS data to the Uniprot Swissprot human protein databases (September 2014 release, containing 20,233 entries), utilizing the Mascot server version 2.4. Mascot Distiller (version 2.5.1.0) was used to generate peak lists in the mascot generic format. Mass tolerances were set to 10 ppm and 600 mmu for the precursor and fragment ions, respectively. For the phosphoproteomics experiments, the allowed fixed modification was carbamidomethyl (Cys) and variable modifications were: phospho-Ser, phospho-Thr, phospho-Tyr, pyro-Glu (N-terminal), and oxidation-Met and were restricted the searches to tryptic peptides with one missed cleavage allowed. The identified phosphopeptides from each of the samples were collated and curated using in-house scripts. Unique phosphopeptides ions with expectancy < 0.05 were then included in the subsequent analyses. Mascot decoy database searches showed that with these settings produce a false discovery rate of ∼1%. Peptide quantification was performed as described before by our group (23–25) and others (26, 27). Briefly, Pescal software (written in Python v2.7) was then used to obtain peak areas of extracted ion chromatograms of each of the phosphopeptide ions in the database across all of the samples being compared. The retention times of each phosphopeptide ion, in each sample, were predicted through alignment of common phosphopeptides' retention times using an in-house linear modeling algorithm. Chromatographic peaks obtained from extracted ion chromatograms for each phosphopeptide in each sample were then integrated and the peak areas recorded. The mass-to-charge (m/z) and retention time (tR) tolerances were set to 7 ppm and 1.5 min, respectively. Processed data are shown in Supplemental Datasets 1 and 2. Phosphorylation sites were reported when phosphopeptides showed a delta score >10, otherwise the precise modification site was deemed ambiguous (28). MS raw data have been deposited in PRIDE (project accession PXD005073, http://www.ebi.ac.uk/pride/archive/projects/PXD005073).
Technical replicates were averaged, and peak areas for each phosphopeptide ion were then normalized to the sum of peptide intensities for each sample. Kinase–substrate matching was performed on these data as in reported before (15) using a visual basic for applications (VBA) script against the PhosphoSitePlus database (downloaded in July 2014). The K-score was calculated for each kinase substrate group using the equation below (where m = the number of phosphorylation sites in the dataset matched to kinase K; α = the normalized intensity of the phosphorylation site i; n = the total number of phosphorylation sites in the dataset regardless of any kinase–substrate association; β = the normalized intensity of the phosphorylation site j; and t = the total number of known target phosphorylation sites in the PhosphoSitePlus database for kinase K). Data were visualized either using Microsoft Excel 2007/2010 or within the R statistical computing environment (v3.0.0) using a combination of the reshape2 and ggplot2 packages. Statistical significance of Pearson's correlation coefficients (r) was assessed through calculation of the corresponding t-statistics as below. An α = 0.05 was used, with P-values below this threshold considered statistically significant. FORMULA: t = r/√(1 − r^2/n − 2).
Pervanadate Treatment
P31/Fuj cells were exposed to 1 mm sodium pervanadate or left untreated during 30 min (sodium pervanadate was prepared by mixing 30% H2O2 and 100 mm Na3VO4 pH 8.0 at 1:100 ratio during 15 min). Cells were then harvested and lysed as outlined above. After homogenization and protein quantification, treated and untreated cell lysates were mixed to a final protein concentration of 1.0 μg·μl−1. The proportions used were 0%, 25%, 50%, 75%, and 100% of pervanadate treated extracts with 100%, 75%, 50%, 25%, and 0% of untreated extracts. Protein mixtures were subsequently subjected to trypsin digestion and phosphopeptide enrichment as described above.
Epidermal Growth Factor (EGF) and Insulin-Like Growth Factor (IGF) 1 Treatment
K-score results were obtained from a meta-analysis of Supplementary Dataset 2 in Ref. (21). Briefly, MCF-7 cells were starved for 24 h and subsequently treated with 100 ng·ml−1 EGF or IGF-1 for 0, 5, 10, 30, or 60 min and processed for MS analysis as described in Ref. (21). K-scores were calculated as described above.
Viability Analysis and Sensitivity Coefficient
Cell lines were seeded in 96-well plates (10,000 cells·well−1), left overnight and treated with vehicle (DMSO), or 1 to 1000 nm of AZD-5438 (CDK2i), GF-109203X (PKCαi; Tocris), PF-3758309 (PAKi; Calbiochem), Trametinib (MEKi; Selleckchem), MK-2206 (AKTi; Selleckchem), KU-0063794 (mammalian target of rapamycin (mTOR); Chemdea); or TAK 715 (P38αi). Cells were also treated with 0.01 to 10 μm of PKC-412 (PKC/Flt3i; Tocris) or 0.1 to 10 μm of TBB (CK2i). After 72 h, cells were stained with Guava ViaCount reagent (Millipore) as indicated by the manufacturer and cell number, and viability was measured using a Guava EasyCyte Plus instrument. All drugs were solubilized in DMSO, and all measurements were performed in triplicate. Flow cytometry data were analyzed using CytoSoft (v2.5.7). IC50 values were calculated using Graphpad PRISM (v5.03). The sensitivity coefficient (SC) was calculated using the equation below (where PCi = reduction in proliferation at Ci, IC50i = in vitro IC50 against primary target and Ci = inhibitor concentration at which proliferation is measured). Data were visualized using Microsoft Excel 2007/2010 or within the R statistical computing environment (v3.0.0), using a combination of the reshape2 and ggplot2 packages.
RESULTS
Development of an Algorithm for the Ranking of Kinase Activities
We reasoned that the net activity of a kinase within a particular biological system would be proportional to its contribution to total phosphorylation, which can be calculated as the sum of the intensities of its known substrates relative to the sum of the intensities of all phosphorylation sites present in the dataset. We call the output of such analysis the K-score. To test the relevance of this concept, we analyzed the phosphoproteome of the P31/Fuji cell line (derived from acute myeloid leukemia) under basal conditions by label-free MS. We then computed the K-scores for each of the kinases represented in this dataset, as determined by known substrates defined in the PhosphoSitePlus database (29) (Fig. 1A). This analysis revealed that CK2A1, CDK2, CDK1, ERK1, and CK1A were the five kinases that contributed most to cellular phosphorylation within this cell line. Kinases within the PhosphoSitePlus database are not equally represented, however, as the total number of substrates known for each kinase (t) was heterogeneous (Fig. 1B) perhaps reflecting how well-studied a given kinase is. In addition, the number of these substrates identified within the phosphoproteomics data (m) was also unequal (Figs. 1B–1D), probably because of a lack of expression of certain substrates in this cell line or due to the nature of the detectable phosphoproteome. We therefore decided to test the impact of normalization of the K-scores to account for this imbalance and thus undertook a systematic comparison of different normalization coefficients that incorporated the values of m and t.
Fig. 1.

Development of kinase activity ranking. The principle of the K-score: the intensities (peak areas in extracted ion chromatograms) of phosphorylated peptides containing sites commonly phosphorylated by given kinases are summed and normalized to the sum of all phosphopeptide intensities. The resulting values may be further normalized by dividing to the number of substrates known and identified per kinase (Fig. 2). (A) Unnormalized K-scores of the kinases with greater contribution to phosphorylation as determined by phosphoproteomics analysis of the P31/Fuj cell line followed by KARP analysis. Data points represent mean ± S.E. of four independent experiments. (B) Number of substrates per kinase (t) in the PhosphoSitePlus database. (C) Number of phosphorylation sites identified per kinase (m) in the phosphoproteomics dataset from the P31/fuj cell line. (D) Relationship between m and t.
In order to test the performance of the different methods of normalization, we sought to compare the KARP outputs (K-scores) to an independent measure of cell regulation, as we reasoned that kinases with greater contribution to total phosphorylation may also contribute more to the signaling output. This hypothesis is supported by the known role of protein kinases in the regulation cell viability downstream of growth factor receptors, as the contribution of individual kinases in these networks to cell proliferation is thought to be proportional to their degree of activation (30–33). Therefore, a relevant signaling output to consider in our cell models was the regulation of cell viability as a function of kinase activity ranking. As such, we treated P31/Fuji cells with a number of different small-molecule kinase inhibitors and measured the reduction in cell viability as a function of treatment.
The effect of small molecule inhibitors on cell behavior is dependent on both the contribution of the target to the pathway flux as well as the affinity of the compound to the target (which is reflected by the in vitro IC50). To account for this, we normalized the drug-induced inhibition of cell viability by the reported in vitro IC50 of the compound against its known targets. We termed this value the sensitivity coefficient (SC) (Figs. 2A and 2B). By doing this, differences in inhibitor potencies were normalized, and kinase inhibitors with disparate in vitro IC50 values could be ranked against one another on the basis of the contribution of their targets to cell viability. As shown in Fig. 2C, K-scores were not associated with the IC50 of inhibitor effects on cell viability. We found, however, a statistically significant association between K-scores and SCs for given kinases. Normalization by the square root of the ratio between m and t for the specific kinase showed the strongest linear relationship between the K-scores and SC values for each individual kinase (r = 0.927, p < 0.01). Based on this observation, the final method for the calculation of K-scores was taken as K = Σα/Σβ · (m/t)1/2. The association between K-scores and reduction in cell viability as a function of kinase inhibitor treatment suggests that KARP provided a quantitative measure of the contribution that individual kinases made to the regulation of this cell population's viability.
Fig. 2.

Assessment of the impact of normalization methods on the accuracy of KARP. (A) Formula for the sensitivity coefficient, SC. (B–D) The P31/Fuj cell line was treated with the named compounds and their viability measured after 48 h using the Guava Viacount assay. The K-score (K) for the named kinases were calculated as shown on the chart headings and compared with the IC50 of inhibition of cell viability as a function of treatment with the inhibitors shown (C) or to the SC (D). K-score values represent the mean of four independent experiments, each measured in duplicate.
To investigate the impact that kinase popularity (i.e. the number of substrates per kinase present in the database) could potentially have on K-score values, we plotted the normalization factor in the final KARP formula (i.e. [m/t]1/2) as a function of t (number of substrates present in the PhosphoSite database) for each kinase identified (Fig. 3A). We found that the value of the normalization term increased as t decreased (Fig. 3A), suggesting that such normalization term was capable of adjusting for large values of t. In support of this conclusion, we did not find a clear correlation between the number of substrates present in the database for a given kinase and their K-score (Figs. 3B and 3C). The exceptions were for CDK1, CDK2, and CK2A1, which are extensively studied kinases showing large K-scores (Fig. 3B, red fonts). These kinases are known to play a major roles in regulating cell proliferation, with CDK1 and CDK2 being master regulators of cell cycle progression (34, 35). It is therefore conceivable that these kinases have the largest K-scores because these contribute the most to the regulation of cell viability in these models. However, other well-studied kinases, such as protein kinase A, PKCα, ERK2, and Src—each having more than 200 substrates in the database—showed low K-scores. Conversely, kinase interacting with stathmin (KIS) and mitogen-activated protein kinase p38 delta (P38D) had high K-scores despite having low values of t. Therefore, there did not seem to be a clear relationship between t and K-score (Fig. 3C) and thus, although it may contribute to some extent, KARP outputs were not just a reflection of kinase popularity.
Fig. 3.

Impact of kinase popularity on the KARP. (A) Relationship between t and (m/t)1/2; number of substrates present in the PhosphoSitePlus database per kinase and the normalization term in the KARP formula, respectively. (B) K-score as a function of t. (C) As in B but in log10 scale.
Systematic Evaluation of Algorithm Performance
We then investigated the reproducibility and quantitative nature of K-scores. To this end, DHL6 cells (a cell-line derived from lymphoma) were treated with sodium pervanadate (pV), a potent inhibitor of tyrosine phosphatase activity. Following cell lysis, the resulting lysates were mixed with those from untreated cells at five different proportions, in a linear manner (Fig. 4A). To test the reproducibility of the analysis, we performed this experiment on three independent occasions and each was analyzed in analytical triplicate. As expected, pV, a tyrosine phosphatase inhibitor, induced an increase in the K-score of tyrosine kinases, which consequently ranked higher in samples as a function of pV-treated cells (Fig. 4B). The relationship between K-scores and proportion of pV-treated cells was linear and reproducible (r > 0.99 with coefficients of variation < 15%, Figs. 4C and 4D), indicating that K-scores are quantitative readouts of kinase–substrate groups. These results suggest that KARP outputs may be used to rank kinases based on their activation status in a reproducible and quantitative manner.
Fig. 4.

Reproducibility, linearity, and accuracy of K-score determination. (A) P31/Fuj cells were treated with 1 mm pV, an agent known to increase tyrosine phosphorylation, or left untreated. Cells were lysed and lysates mixed at the proportions shown. The resulting mixtures were processed for phosphoproteomic analysis and K-scores obtained from the data. The experiment was performed on three independent occasions, each analyzed in analytical triplicate. (B) Ranking of kinases based on K-scores as a function of pV-treated cells. Tyrosine kinases (shown as triangular data points) clearly increase their K-score-based ranks as a function of pV-treated extracts present in samples. (C and D) Reproducibility and linearity of K-scores for three representative kinases. The data show that K-scores can be obtained reproducibly, and such values are quantitative as the K-scores for tyrosine kinases were directly proportional to the fraction of pV-treated cells in the samples.
Method Evaluation in an Independent Biological Model
To investigate the biological relevance of KARP outputs in more detail and to validate the approach further, we also performed a meta-analysis of published phosphoproteomics data obtained from time-course experiments of Michigan Cancer Foundation-7 (MCF7) cells treated with EGF or IGF-I (21). The time course of kinase activation as a result of growth factor treatment is well understood (13), and thus these experiments allowed an assessment of whether K-scores reflected the expected changes in kinase activities as a function of treatment. We observed that K-scores for serine/threonine and tyrosine kinases changed upon treatment with these growth factors with the expected kinetics (Fig. 5). For example, K-scores for MEK1/2 and ERK1 increased after 5 min of stimulation with either EGF or IGF-I and then decreased at later time points, whereas those for Akt1 were more sustained. These data are consistent with the effects that these growth factors have on PI3K/Akt and MEK/ERK pathway activities in MCF7 cells (21, 36), indicating that KARP outputs are an accurate reflection the expected kinase activities.
Fig. 5.

K-scores as a function of EGF or IGF treatment. The phosphoproteomics data in Wilkes et al. were processed for K-score analysis. These values show the expected kinetics of growth factor stimulation on kinase activity.
KARP Models the Contribution of Kinases to Cell Viability in a Diverse Set of Models
To investigate whether KARP is a measure of regulation in cellular models other than in our initial system (Fig. 1), we analyzed seven additional cancer cell lines and used KARP to rank more than 100 kinases based on their activation relative to each other. Fig. 6A shows the 60 kinases with the greatest K-scores. We found that CDK1, CDK2, ERK1, PAK1, P38D, and CK2 were the most highly ranked kinases in this sample set (Supplemental Fig. S1). Performing the analysis against a randomized database as opposed to the PhosphoSite plus database was not able to reproduce these results (Supplemental Fig. S2).
Fig. 6.
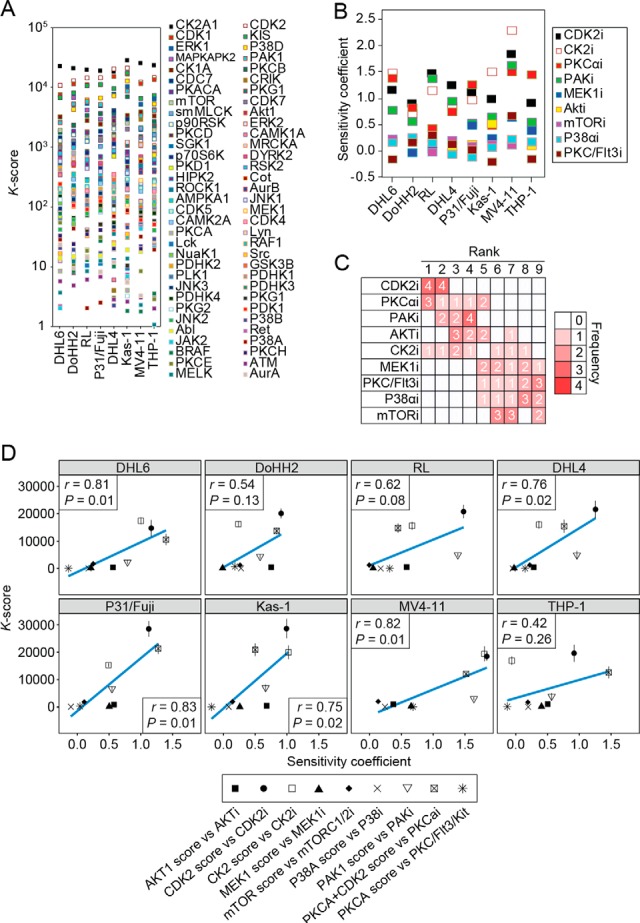
Modeling the contribution of kinase activity to cell viability in a panel of cancer cells. (A) Distribution of K-scores in eight cancer cell lines. (B) Distribution of SCs in the cell lines. (C) Frequency of ranking of kinase inhibitors based on SC analysis. (D) Association between SC and K-scores in cell lines. Experiments were performed in four independent occasions, and data represent mean ± S.E.
To investigate whether the K-scores reflected the contribution of kinases to cell viability, and could therefore predict responses to compounds, we measured reductions in cell viability in this additional panel of cell lines as a function of treatment with nine kinase inhibitors (dose–response curves are shown in Supplemental Fig. S2). We added the data obtained from the P31/Fuj cell line (Fig. 1) to this analysis, thus having a total of eight cell lines in the comparison (values are shown in Supplemental Dataset 3). As with KARP analysis, sensitivity coefficients for CDK2 inhibitors ranked the highest (Figs. 6B and 6C), and a direct comparison revealed a linear relationship between K-scores of specific kinases with the SCs against their inhibitor (Fig. 6D). Overall, K-scores modeled viability in six of the eight cell lines tested, as assessed by linear regression analysis, with Pearson r values ranging from 0.42 to 0.83 (median of 0.75, p = 0.019). Thus, although K-scores and SC use two very different datasets as their inputs (mass spectrometry phosphoproteomics data and cell count data, respectively), we found a linear association between the two metrics in all cases (Fig 6D). These data therefore suggest that K-scores can model the contribution of kinases to cell viability in a diverse set of cell lines and can thus predict sensitivity as function of kinase treatment in several cellular models.
DISCUSSION
In this study, we aimed to develop a framework to model the contribution of protein kinases to cell viability. Methods to quantify the contribution of enzymes to the regulation of metabolic fluxes include metabolic control analysis and biochemical system theory (37). These tools have been fundamental to our understanding of the extent of control that individual enzymes exert over linear metabolic pathways. Metabolic control analysis and biochemical system theory are, however, unsuitable for the investigation of regulatory elements in kinase signaling as these form highly interconnected networks rather than linear pathways (38). siRNA-based screening experiments are useful for the identification of proteins involved in the regulation of particular processes (8, 39); however, these studies produce only qualitative data, as the inhibition of proliferation imposed by individual siRNA probes depends on both the extent of inhibition of given targets and their importance to the regulation of cell viability. Kinase activity assays that use synthetic peptides (40, 41) as substrates in in vitro enzymatic assays fail to take into account the activity of phosphatases that counteract kinase activity in vivo and the subcellular localization of proteins that provide further specificity to kinase signaling.
In contrast to the approaches cited above, KARP measures net kinase activity—i.e. protein phosphorylation that has occurred in intact and metabolically active cells—and revolves around the hypothesis that the fraction of protein phosphorylation attributed to a given kinase relative to total phosphorylation may be a measure of its contribution to signaling. Previous approaches for the inference of kinase activities from phosphoproteomics data are restricted to the comparison of phosphorylation across experimental conditions (15, 16). We found that kinase ranking by KARP reflected the ranking that the respective inhibitors had in reducing cell viability (Fig. 6), thus suggesting that K-scores reflect the contribution of individual kinases to signaling and to the regulation of cell viability within an individual cell population. As the approach does not require comparison to a reference sample, K-scores represent a measure of signaling regulation in 'absolute units'. Previous approaches for the systematic identification of regulatory nodes in cancer cells have typically involved RNAi screening experiments (8, 39) or complex analytical workflows that require the integration of multiomics data (17, 42), whereas KARP uses data obtained from a single-shot LC-MS/MS run and does not require referencing to other omics datasets. Therefore, with further development, KARP could potentially be used to determine which kinases could be targeted for therapeutic gain in disease states, as the user would be able to predict the kinase to which the disease is most therapeutically sensitive.
From a methodological standpoint, KARP is akin to methods for the absolute quantification of proteins using large-scale proteomics data, such as intensity-based absolute quantification (iBAQ) and the sum of peptide intensities (25, 43, 44). Indeed, absolute protein quantification using large-scale label-free data involves the summation of the intensities of peptides derived from a given protein after proteolysis, while KARP relies on the summation of the intensities of phosphopeptides containing sites catalyzed by the same kinase. In this manner, KARP quantifies the contribution of kinases to total cellular phosphorylation and regulation without the need to compare to a reference sample.
We found a significant correlation between K-scores of given kinases and reduction of cell viability after their inhibition (Fig. 2 and Fig. 6). K-scores could be obtained reproducibly and with good linearity as a function of kinase activity (Fig. 4), reflecting the quantitative nature of the approach. Changes in K-scores as a function of kinase pathway activation downstream of growth factor receptors indicated that such values are a faithful reflection of kinase pathway activation (Fig. 5). Therefore, KARP can potentially be useful for the identification of regulatory kinases in signaling networks and to investigate how such regulation quantitatively changes in different experimental and physiological contexts or as a result of disease.
DATA AVAILABILITY
The LC-MS/MS raw data have been deposited in the PRotemics IDEntifications data respository (“http://www.ebi.ac.uk/pride/archive/projects/PXD005073”), with the data set identifier PXD005073.
Supplementary Material
Footnotes
Author contributions: P.R.C. designed research; E.W., P.C., V.R., and P.R.C. performed research; E.W., P.C., and P.R.C. analyzed data; and E.W. and P.R.C. wrote the paper.
* This work was supported by Barts and The London Charity (297/2249), BBSRC (BB/M006174/1) and Cancer Research U.K. (C236/A11795).
 This article contains supplemental material.
1 The abbreviations used are:
- IMDM
- Iscove's modified Dulbecco's medium
- CDK
- cyclin-dependent kinase
- CK
- casein kinase
- DMSO
- dimethyl sulfoxide
- EGF
- epidermal growth factor
- ERK
- extracellular signal-related kinase
- FBS
- fetal bovine serum
- FWHM
- full-width half-maximum
- HEPES
- 4-(2-hydroxyethyl)-1-piperazineethanesulfonic acid
- HLB
- hydrophilic-lipophilic balance
- IGF-1
- insulin-like growth factor 1
- KARP
- kinase activity ranking using phosphoproteomics data
- KIS
- kinase interacting with stathmin
- LC
- liquid chromatography
- mTOR
- mammalian target of rapamycin
- MCF7
- Michigan Cancer Foundation-7
- MS-5
- murine stromal-5
- MS/MS
- tandem mass spectrometry
- P38D
- p38 mitogen-activated kinase delta
- PAK
- p21-activated kinase
- PKC
- protein kinase C
- RPMI
- Roswell Park Memorial Institute
- UPLC
- ultra performance liquid chromatography
- VBA
- Visual Basic for Applications.
REFERENCES
- 1. Cohen P. (1982) The role of protein phosphorylation in neural and hormonal control of cellular activity. Nature 296, 613–620 [DOI] [PubMed] [Google Scholar]
- 2. Davies H., Bignell G. R., Cox C., Stephens P., Edkins S., Clegg S., Teague J., Woffendin H., Garnett M. J., Bottomley W., Davis N., Dicks E., Ewing R., Floyd Y., Gray K., Hall S., Hawes R., Hughes J., Kosmidou V., Menzies A., Mould C., Parker A., Stevens C., Watt S., Hooper S., Wilson R., Jayatilake H., Gusterson B. A., Cooper C., Shipley J., Hargrave D., Pritchard-Jones K., Maitland N., Chenevix-Trench G., Riggins G. J., Bigner D. D., Palmieri G., Cossu A., Flanagan A., Nicholson A., Ho J. W., Leung S. Y., Yuen S. T., Weber B. L., Seigler H. F., Darrow T. L., Paterson H., Marais R., Marshall C. J., Wooster R., Stratton M. R., and Futreal P. A. (2002) Mutations of the BRAF gene in human cancer. Nature 417, 949–954 [DOI] [PubMed] [Google Scholar]
- 3. Vivanco I., and Sawyers C. L. (2002) The phosphatidylinositol 3-kinase AKT pathway in human cancer. Nature Rev. Cancer 2, 489–501 [DOI] [PubMed] [Google Scholar]
- 4. Manning G., Whyte D. B., Martinez R., Hunter T., and Sudarsanam S. (2002) The protein kinase complement of the human genome. Science 298, 1912–1934 [DOI] [PubMed] [Google Scholar]
- 5. Wilhelm M., Schlegl J., Hahne H., Gholami A. M., Lieberenz M., Savitski M. M., Ziegler E., Butzmann L., Gessulat S., Marx H., Mathieson T., Lemeer S., Schnatbaum K., Reimer U., Wenschuh H., Mollenhauer M., Slotta-Huspenina J., Boese J. H., Bantscheff M., Gerstmair A., Faerber F., and Kuster B. (2014) Mass-spectrometry-based draft of the human proteome. Nature 509, 582–587 [DOI] [PubMed] [Google Scholar]
- 6. Kim M. S., Pinto S. M., Getnet D., Nirujogi R. S., Manda S. S., Chaerkady R., Madugundu A. K., Kelkar D. S., Isserlin R., Jain S., Thomas J. K., Muthusamy B., Leal-Rojas P., Kumar P., Sahasrabuddhe N. A., Balakrishnan L., Advani J., George B., Renuse S., Selvan L. D., Patil A. H., Nanjappa V., Radhakrishnan A., Prasad S., Subbannayya T., Raju R., Kumar M., Sreenivasamurthy S. K., Marimuthu A., Sathe G. J., Chavan S., Datta K. K., Subbannayya Y., Sahu A., Yelamanchi S. D., Jayaram S., Rajagopalan P., Sharma J., Murthy K. R., Syed N., Goel R., Khan A. A., Ahmad S., Dey G., Mudgal K., Chatterjee A., Huang T. C., Zhong J., Wu X., Shaw P. G., Freed D., Zahari M. S., Mukherjee K. K., Shankar S., Mahadevan A., Lam H., Mitchell C. J., Shankar S. K., Satishchandra P., Schroeder J. T., Sirdeshmukh R., Maitra A., Leach S. D., Drake C. G., Halushka M. K., Prasad T. S., Hruban R. H., Kerr C. L., Bader G. D., Iacobuzio-Donahue C. A., Gowda H., and Pandey A. (2014) A draft map of the human proteome. Nature 509, 575–581 [DOI] [PMC free article] [PubMed] [Google Scholar]
- 7. Cowley S., Paterson H., Kemp P., and Marshall C. J. (1994) Activation of MAP kinase is necessary and sufficient for PC12 differentiation and for transformation of NIH 3T3 cells. Cell 77, 841–852 [DOI] [PubMed] [Google Scholar]
- 8. Bakal C., Linding R., Llense F., Heffern E., Martin-Blanco E., Pawson T., and Perrimon N. (2008) Phosphorylation networks regulating JNK activity in diverse genetic backgrounds. Science 322, 453–456 [DOI] [PMC free article] [PubMed] [Google Scholar]
- 9. Creixell P., Palmeri A., Miller C. J., Lou H. J., Santini C. C., Nielsen M., Turk B. E., and Linding R. (2015) Unmasking determinants of specificity in the human kinome. Cell 163, 187–201 [DOI] [PMC free article] [PubMed] [Google Scholar]
- 10. Beltrao P., Bork P., Krogan N. J., and van Noort V. (2013) Evolution and functional cross-talk of protein post-translational modifications. Mol. Syst. Biol. 9, 714. [DOI] [PMC free article] [PubMed] [Google Scholar]
- 11. Swaney D. L., Beltrao P., Starita L., Guo A., Rush J., Fields S., Krogan N. J., and Villén J. (2013) Global analysis of phosphorylation and ubiquitylation cross-talk in protein degradation. Nat. Methods 10, 676–682 [DOI] [PMC free article] [PubMed] [Google Scholar]
- 12. Tan C. S., Bodenmiller B., Pasculescu A., Jovanovic M., Hengartner M. O., Jørgensen C., Bader G. D., Aebersold R., Pawson T., and Linding R. (2009) Comparative analysis reveals conserved protein phosphorylation networks implicated in multiple diseases. Science Signal. 2, ra39. [DOI] [PubMed] [Google Scholar]
- 13. Olsen J. V., Blagoev B., Gnad F., Macek B., Kumar C., Mortensen P., and Mann M. (2006) Global, in vivo, and site-specific phosphorylation dynamics in signaling networks. Cell 127, 635–648 [DOI] [PubMed] [Google Scholar]
- 14. de Graaf E. L., Giansanti P., Altelaar A. F., and Heck A. J. (2014) Single-step enrichment by Ti4+-IMAC and label-free quantitation enables in-depth monitoring of phosphorylation dynamics with high reproducibility and temporal resolution. Mol. Cell. Proteomics 13, 2426–2434 [DOI] [PMC free article] [PubMed] [Google Scholar]
- 15. Casado P., Rodriguez-Prados J. C., Cosulich S. C., Guichard S., Vanhaesebroeck B., Joel S., and Cutillas P. R. (2013) Kinase-substrate enrichment analysis provides insights into the heterogeneity of signaling pathway activation in leukemia cells. Science Signal. 6, rs6. [DOI] [PubMed] [Google Scholar]
- 16. Mischnik M., Sacco F., Cox J., Schneider H. C., Schafer M., Hendlich M., Crowther D., Mann M., and Klabunde T. (2015) IKAP: A heuristic framework for inference of kinase activities from phosphoproteomics data. Bioinformatics 32, 424–431 [DOI] [PubMed] [Google Scholar]
- 17. Drake J. M., Paull E. O., Graham N. A., Lee J. K., Smith B. A., Titz B., Stoyanova T., Faltermeier C. M., Uzunangelov V., Carlin D. E., Fleming D. T., Wong C. K., Newton Y., Sudha S., Vashisht A. A., Huang J., Wohlschlegel J. A., Graeber T. G., Witte O. N., and Stuart J. M. (2016) Phosphoproteome integration reveals patient-specific networks in prostate cancer. Cell 166, 1041–1054 [DOI] [PMC free article] [PubMed] [Google Scholar]
- 18. Ochoa D., Jonikas M., Lawrence R. T., El Debs B., Selkrig J., Typas A., Villén J., Santos S. D., and Beltrao P. (2016) An atlas of human kinase regulation. Mol. Syst. Biol. 12, 888. [DOI] [PMC free article] [PubMed] [Google Scholar]
- 19. Saez-Rodriguez J., Alexopoulos L. G., Epperlein J., Samaga R., Lauffenburger D. A., Klamt S., and Sorger P. K. (2009) Discrete logic modelling as a means to link protein signalling networks with functional analysis of mammalian signal transduction. Mol. Syst. Biol. 5, 331. [DOI] [PMC free article] [PubMed] [Google Scholar]
- 20. Terfve C. D., Wilkes E. H., Casado P., Cutillas P. R., and Saez-Rodriguez J. (2015) Large-scale models of signal propagation in human cells derived from discovery phosphoproteomic data. Nat Commun. 6, 8033. [DOI] [PMC free article] [PubMed] [Google Scholar]
- 21. Wilkes E. H., Terfve C., Gribben J. G., Saez-Rodriguez J., and Cutillas P. R. (2015) Empirical inference of circuitry and plasticity in a kinase signaling network. Proc. Natl. Acad. Sci. U.S.A. 112, 7719–7724 [DOI] [PMC free article] [PubMed] [Google Scholar]
- 22. Linding R., Jensen L. J., Ostheimer G. J., van Vugt M. A. T. M., Jørgensen C., Miron I. M., Diella F., Colwill K., Taylor L., Elder K., Metalnikov P., Nguyen V., Pasculescu A., Jin J., Park J. G., Samson L. D., Woodgett J. R., Russell Robert B., Bork P., Yaffe M. B., and Pawson T. (2007) Systematic discovery of in vivo phosphorylation networks. Cell 129, 1415–1426 [DOI] [PMC free article] [PubMed] [Google Scholar]
- 23. Montoya A., Beltran L., Casado P., Rodríguez-Prados J. C., and Cutillas P. R. (2011) Characterization of a TiO(2) enrichment method for label-free quantitative phosphoproteomics. Methods 54, 370–378 [DOI] [PMC free article] [PubMed] [Google Scholar]
- 24. Casado P., and Cutillas P. R. (2011) A self-validating quantitative mass spectrometry method for assessing the accuracy of high-content phosphoproteomic experiments. Mol. Cell. Proteomics 10, M110 003079 [DOI] [PMC free article] [PubMed] [Google Scholar]
- 25. Cutillas P. R., and Vanhaesebroeck B. (2007) Quantitative profile of five murine core proteomes using label-free functional proteomics. Mol. Cell. Proteomics 6, 1560–1573 [DOI] [PubMed] [Google Scholar]
- 26. Tsou C. C., Tsai C. F., Tsui Y. H., Sudhir P. R., Wang Y. T., Chen Y. J., Chen J. Y., Sung T. Y., and Hsu W. L. (2010) IDEAL-Q, an automated tool for label-free quantitation analysis using an efficient peptide alignment approach and spectral data validation. Mol. Cell. Proteomics 9, 131–144 [DOI] [PMC free article] [PubMed] [Google Scholar]
- 27. Mann B., Madera M., Sheng Q., Tang H., Mechref Y., and Novotny M. V. (2008) ProteinQuant Suite: A bundle of automated software tools for label-free quantitative proteomics. Rapid Comm. Mass Spectrom. 22, 3823–3834 [DOI] [PubMed] [Google Scholar]
- 28. Savitski M. M., Lemeer S., Boesche M., Lang M., Mathieson T., Bantscheff M., and Kuster B. (2011) Confident phosphorylation site localization using the Mascot Delta Score. Mol. Cell. Proteomics 10, M110 003830 [DOI] [PMC free article] [PubMed] [Google Scholar]
- 29. Hornbeck P. V., Zhang B., Murray B., Kornhauser J. M., Latham V., and Skrzypek E. (2015) PhosphoSitePlus, 2014: Mutations, PTMs and recalibrations. Nucleic Acids. Res. 43, D512–D520 [DOI] [PMC free article] [PubMed] [Google Scholar]
- 30. Solit D. B., Garraway L. A., Pratilas C. A., Sawai A., Getz G., Basso A., Ye Q., Lobo J. M., She Y., Osman I., Golub T. R., Sebolt-Leopold J., Sellers W. R., and Rosen N. (2006) BRAF mutation predicts sensitivity to MEK inhibition. Nature 439, 358–362 [DOI] [PMC free article] [PubMed] [Google Scholar]
- 31. Paez J. G., Jänne P. A., Lee J. C., Tracy S., Greulich H., Gabriel S., Herman P., Kaye F. J., Lindeman N., Boggon T. J., Naoki K., Sasaki H., Fujii Y., Eck M. J., Sellers W. R., Johnson B. E., and Meyerson M. (2004) EGFR mutations in lung cancer: Correlation with clinical response to gefitinib therapy. Science 304, 1497–1500 [DOI] [PubMed] [Google Scholar]
- 32. Heinrich M. C., Corless C. L., Duensing A., McGreevey L., Chen C. J., Joseph N., Singer S., Griffith D. J., Haley A., Town A., Demetri G. D., Fletcher C. D., and Fletcher J. A. (2003) PDGFRA activating mutations in gastrointestinal stromal tumors. Science 299, 708–710 [DOI] [PubMed] [Google Scholar]
- 33. Pao W., and Girard N. (2011) New driver mutations in non-small-cell lung cancer. Lancet Oncol. 12, 175–180 [DOI] [PubMed] [Google Scholar]
- 34. Vassilev L. T., Tovar C., Chen S., Knezevic D., Zhao X., Sun H., Heimbrook D. C., and Chen L. (2006) Selective small-molecule inhibitor reveals critical mitotic functions of human CDK1. Proc. Natl. Acad. Sci. U.S.A. 103, 10660–10665 [DOI] [PMC free article] [PubMed] [Google Scholar]
- 35. Koff A., Giordano A., Desai D., Yamashita K., Harper J. W., Elledge S., Nishimoto T., Morgan D. O., Franza B. R., and Roberts J. M. (1992) Formation and activation of a cyclin E-cdk2 complex during the G1 phase of the human cell cycle. Science 257, 1689–1694 [DOI] [PubMed] [Google Scholar]
- 36. Aksamitiene E., Kholodenko B. N., Kolch W., Hoek J. B., and Kiyatkin A. (2010) PI3K/Akt-sensitive MEK-independent compensatory circuit of ERK activation in ER-positive PI3K-mutant T47D breast cancer cells. Cell Signal 22, 1369–1378 [DOI] [PMC free article] [PubMed] [Google Scholar]
- 37. Cascante M., Boros L. G., Comin-Anduix B., de Atauri P., Centelles J. J., and Lee P. W. (2002) Metabolic control analysis in drug discovery and disease. Nature Biotechnol. 20, 243–249 [DOI] [PubMed] [Google Scholar]
- 38. Jørgensen C., and Linding R. (2010) Simplistic pathways or complex networks? Curr. Opin. Genet. Dev. 20, 15–22 [DOI] [PubMed] [Google Scholar]
- 39. Grueneberg D. A., Degot S., Pearlberg J., Li W., Davies J. E., Baldwin A., Endege W., Doench J., Sawyer J., Hu Y., Boyce F., Xian J., Munger K., and Harlow E. (2008) Kinase requirements in human cells: I. Comparing kinase requirements across various cell types. Proc. Natl. Acad. Sci. U.S.A. 105, 16472–16477 [DOI] [PMC free article] [PubMed] [Google Scholar]
- 40. Cutillas P. R., Khwaja A., Graupera M., Pearce W., Gharbi S., Waterfield M., and Vanhaesebroeck B. (2006) Ultrasensitive and absolute quantification of the phosphoinositide 3-kinase/Akt signal transduction pathway by mass spectrometry. Proc. Natl. Acad. Sci. U.S.A. 103, 8959–8964 [DOI] [PMC free article] [PubMed] [Google Scholar]
- 41. Yu Y., Anjum R., Kubota K., Rush J., Villen J., and Gygi S. P. (2009) A site-specific, multiplexed kinase activity assay using stable-isotope dilution and high-resolution mass spectrometry. Proc. Natl. Acad. Sci. U.S.A. 106, 11606–11611 [DOI] [PMC free article] [PubMed] [Google Scholar]
- 42. Ryall K. A., Shin J., Yoo M., Hinz T. K., Kim J., Kang J., Heasley L. E., and Tan A. C. (2015) Identifying kinase dependency in cancer cells by integrating high-throughput drug screening and kinase inhibition data. Bioinformatics 31, 3799–3806 [DOI] [PMC free article] [PubMed] [Google Scholar]
- 43. Schwanhäusser B., Busse D., Li N., Dittmar G., Schuchhardt J., Wolf J., Chen W., and Selbach M. (2011) Global quantification of mammalian gene expression control. Nature 473, 337–342 [DOI] [PubMed] [Google Scholar]
- 44. Silva J. C., Gorenstein M. V., Li G. Z., Vissers J. P., and Geromanos S. J. (2006) Absolute quantification of proteins by LCMSE: A virtue of parallel MS acquisition. Mol. Cell. Proteomics 5, 144–156 [DOI] [PubMed] [Google Scholar]
Associated Data
This section collects any data citations, data availability statements, or supplementary materials included in this article.
Supplementary Materials
Data Availability Statement
The LC-MS/MS raw data have been deposited in the PRotemics IDEntifications data respository (“http://www.ebi.ac.uk/pride/archive/projects/PXD005073”), with the data set identifier PXD005073.