

Abstract
Emerging peptide array technologies are able to profile molecular activities within cell lysates. However, the structural diversity of peptides leads to inherent differences in peptide signal-to-noise ratios (S/N). These complex effects can lead to potentially unrepresentative signal intensities and can bias subsequent analyses. Within mass spectrometry-based peptide technologies, the relation between a peptide’s amino acid sequence and S/N remains largely nonquantitative. To address this challenge, we present a method to quantify and analyze mass spectrometry S/N of two peptide arrays, and we use this analysis to portray quality of data and to design future arrays for SAMDI mass spectrometry. Our study demonstrates that S/N varies significantly across peptides within peptide arrays, and variation in S/N is attributable to differences of single amino acids. We apply supervised machine learning to predict peptide S/N based on amino acid sequence, and identify specific physical properties of the amino acids that govern variation of this metric. We find low peptide–S/N concordance between arrays, demonstrating that different arrays require individual characterization and that global peptide–S/N relationships are difficult to identify. However, with proper peptide sampling, this study illustrates how machine learning can accurately predict the S/N of a peptide in an array, allowing for the efficient design of arrays through selection of high S/N peptides.
Peptide arrays have emerged as an enabling tool for identifying biologically relevant peptide substrates and molecular recognition sites, and hold great promise as a new analytical method for basic and translational research in the biomedical sciences.1,2 Uses of peptide arrays include measuring changes in enzymatic activity—specifically enzymes that add or remove post-translational modifications—to gain insight into different cellular pathways and processes.3−5 Other applications include diagnostic or detection-focused arrays such as differential peptide arrays to detect specific analytes in complex mixtures6,7 or diagnose diseases.8,9 Many existing methods are based on either radioisotopic or fluorescent labels to detect reaction products.10,11 These methods introduce additional protocol steps, and for the latter, can alter natural biological activity leading to false interpretations, as when resveratrol was erroneously found to enhance deacetylation on a peptide with an attached fluorophore.12
We recently introduced the SAMDI mass spectrometry method, which uses MALDI mass spectrometry to analyze peptides that are immobilized to a self-assembled monolayer of alkanethiolates on gold (Figure 1), and we have demonstrated the use of this method for profiling enzyme specificities,13 for discovering new enzymes,14 and for profiling activities in a lysate.15 This method provides many benefits, including the use of surface chemistries that are intrinsically inert to the nonspecific adsorption of protein, the availability of a broad range of chemistries for immobilization of peptides, and, most significantly, the compatibility with matrix assisted laser desorption ionization mass spectrometry to analyze the masses of the peptide-alkanethiolate conjugates. This ability to directly measure peptide masses16 allows a straightforward analysis of peptide modifications by identifying the corresponding mass shifts. This method has also been demonstrated to provide a semiquantitative measure of the peptides’ substrate activity.15 However, the S/N of a mass peak for a peptide often depends on its amino acid sequence, resulting in both well-suited and poorly suited peptides for inclusion in an array.
Figure 1.
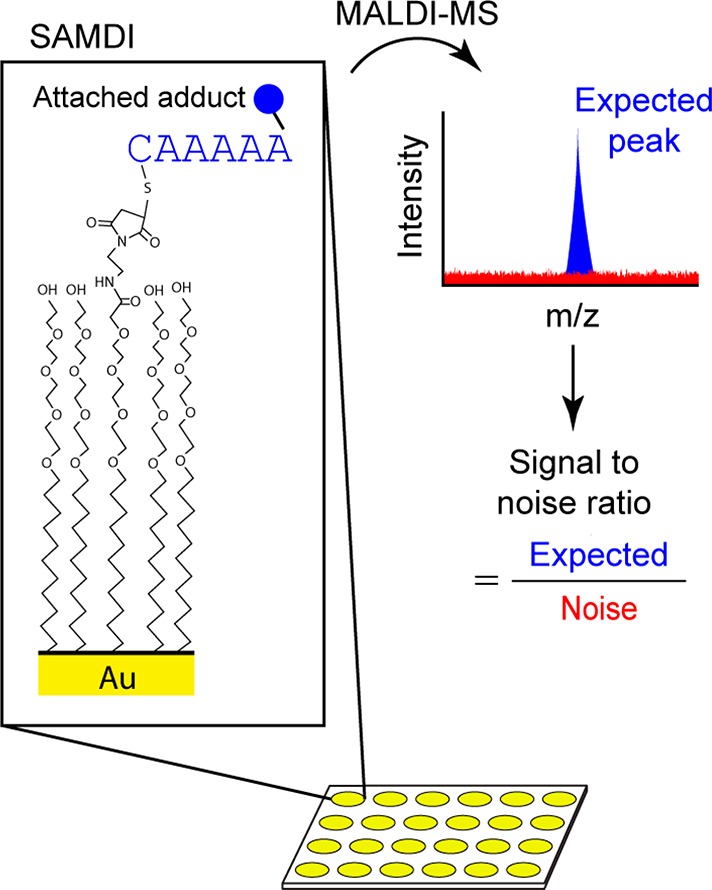
Measuring S/N on peptide arrays using SAMDI MS. SAMDI MS uses MALDI mass spectrometry to analyze peptides that are immobilized to a self-assembled monolayer of alkanethiolates on gold. Depending on the enzyme of study, the peptides may contain a chemical adduct, such as an acetyl group if deacetylases are the enzymes of interest. The expected peak before enzyme treatment includes the peptide immobilized to the alkanethiolate with the attached chemical adduct of interest. We quantify the expected mass peak and noise using their area under the curve to calculate peptide S/N.
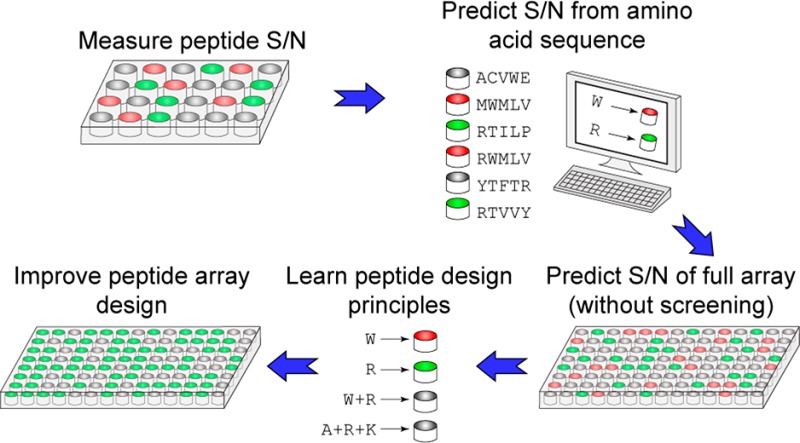
In practice, the signal-to-noise ratio (S/N) of a peptide in mass spectrometry can vary, making certain sequences poorly compatible with the detection method.17,18 Hence, some fraction of peptides serves no useful purpose in an experiment. To identify peptide array designs that maximize S/N, we synthesized two peptide arrays and measured the S/N of each peptide using SAMDI mass spectrometry. Then we randomly chose subsets of the peptides from each array to train a machine learning model to be able to predict the S/N of the remaining peptides in their corresponding array based on amino acid sequences. We identified and compared amino acids associated with high S/N peptides in two peptide arrays and used machine learning to highlight properties that predict the relationship between amino acids and S/N. While SAMDI-specific results are not generalizable, the method we describe can be adapted and applied to diverse peptide array technologies.
Previous work has explored peptide-S/N relationships involving peptide charge (as with arginine residues)19,20 or hydrophilicity, where hydrophilic proteins can be preferentially detected in MALDI-MS due to easier cocrystallization with MALDI matrix.21,22 In addition to hydrophilicity, many specific and complex peptide-matrix interactions can explain MALDI peptide S/N.20,23,24 Single amino acids have been reported to improve signal strength. For example, Krause and co-workers reported that peptides containing arginine or phenylalanine typically contributed to higher MALDI signal strength.25 Additionally, the relationship between S/N and amino acid sequence gains complexity with the addition of chemical adducts. For example, Kolarich and co-workers reported peptides with attached N-glycans have altered signal strengths depending on MS instrument types or subtle changes to peptides from glycosylation.26 Many studies use peptides that may have undergone oxidation25,27−29 which likely also affects peptide signal strength. These peptide modifications introduce difficulties in signal detection and emphasize the need to integrate computational strategies to better understand the relationship between the amino acid sequence of a peptide and the quality of its signal. We select peptide libraries that are unbiased in their composition to evaluate differences in S/N due to differing amino acid sequences, and we offer a complete empirical analysis relating amino acid composition and S/N of the peptides.
Using statistical and machine learning strategies, we investigated how amino acid composition affects S/N in SAMDI mass spectrometry and how subtle amino acid differences can give rise to different S/N. To investigate the consistency of peptide S/N relationships across distinct experimental arrays, we focus on two synthesized peptide arrays, each containing two consecutive variable positions (represented by all 19 amino acids except for cysteine). The amino acids surrounding the variable positions however are different. The two peptide arrays are Ac-GRKacXZC (K-array) and Ac-GXZHGC (H-array). We collected peptide spectra by SAMDI mass spectrometry and calculated the S/N of each peptide. Statistical analysis identified amino acids associated with low or high S/N peptides. We trained machine learning models using a random subset of peptides from each array to identify factors that predict S/N from the physical properties of the peptide’s amino acids. We then predicted the S/N of the remaining peptides and compared the predictions to our experimentally collected S/N values from SAMDI mass spectrometry. Accurate prediction of peptide S/N from machine learning models reveals high and low quality peptides which allows for educated and improved design of peptide arrays without costly screening.
Materials and Methods
Solid-Phase Peptide Synthesis
Data was collected from K- and H-peptide array experiments. The K-peptide array synthesis and methods have been previously published15 and contains peptides of the form Ac-GRKacXZC, where X and Z represent all combinations of 19 amino acids (cysteine omitted) for a total of 361 peptides. We synthesized another 361 membered unmodified histidine peptide array with the sequence Ac-GXZHGC, referred to as the H-array. The constant amino acids (everything except X or Z) are referred to as the outside amino acids. Peptides were synthesized using standard solid phase peptide synthesis on Fmoc-Rink Amide MBHA resin purchased from Anaspec. Fmoc-protected amino acids were purchased from either Anaspec or Sigma-Aldrich. The Fmoc-Rink Amide resin was swelled in dimethylformamide (DMF) for 30 min and treated with 20% piperidine in DMF for 20 min to remove the Fmoc protecting group. The first Fmoc-protected amino acid was coupled to the resin with pybop and N-methylmorpholine at a 4:4:8 ratio, which was repeated until all the amino acids were coupled to the resin. Once the Fmoc protecting group was removed from the final amino acid, the resin was treated with 10% acetic anhydride in DMF for 30 min to acetylate the N-terminus. The peptide was cleaved from the resin with a solution of 95% trifloroacetic acid (TFA), 2.5% triethylsilane, and 2.5% milli-q water for 2 h. To remove the resin, the solution was filtered and precipitated with peptides with ethyl ether. The peptides were resuspended in 0.1% TFA, lyophilized and resuspended in 0.1% TFA again. The peptides are neutralized by dilution into 50 mM Tris buffer pH 7.5 before immobilization.
Preparing Peptide Arrays
Peptide arrays were prepared as described previously.13,16 Briefly, steel plates were evaporated with 384 gold spots. The plates were soaked in an alkanethiolate solution that self-assembles onto the gold surfaces. The alkanethiolate monolayers presented a functional maleimide group against a background of tri(ethylene glycol). Peptides were transferred onto the gold spots using Tecan robotics and incubated at room temperature for 1 h for immobilization. Peptide immobilization occurs through conjugate addition of the thiol on the terminal cysteine residue to the maleimide.
SAMDI Mass Spectrometry
The SAMDI peptide array plates were coated with a 10 mg/mL 2′,4′,6′-trihydroxyacetophenone (THAP) MALDI matrix in acetonitrile. Each immobilized peptide was analyzed in the reflector positive mode with 900 shots on an AB Sciex TOF/TOF 5800 MALDI mass spectrometer.
Statistical Testing to Identify Amino Acids Associated with High or Low S/N
The S/N of all peptides were calculated by dividing the integrated product (area under the curve) of the expected peptide peaks (the signal) by the integrated product of a region in the spectrum devoid of peaks (the noise). The S/N for each peptide were sorted and ranked from lowest to highest. The S/N increase for consecutive peptides was calculated, and the low region boundary was defined as when a large change in S/N increase occurs. Similarly, a high S/N region was identified with the same process. This method allows different sizes for low and high regions. Amino acid enrichment in either region was determined using the Fischer exact test, which calculates the probability to observe at least as many amino acids in the region. Since there were 361 peptides, the significance threshold was determined by a Bonferroni corrected p-value cutoff of 10–4 (approximately 0.05/361); all reported p-values define the likelihood that the observed number of amino acids is within the low or high regions by random chance.
Machine Learning Methods
We considered a variety of linear and nonlinear supervised techniques: partial least-squares regression (PLSR), random forests, deep learning, support vector machines (SVM), and nearest neighbor regression. Random forest outperformed PLSR (in terms of Q2) because PLSR can only model linear relationships. Deep learning, SVMs, and nearest neighbor regression all require parameter tuning, which if done improperly, commonly led to poor performance (zero or even negative Q2 values). Additionally, the multiple training/testing of different feature sets would usually require many iterations of parameter tuning, hindering our analysis. However, the training parameters of random forest typically require little to no tuning, and we found that it outperformed other methods while requiring less human guidance.
Random forest is a commonly used nonlinear supervised learning model that is an aggregation of individual decision trees.34,36 Decision trees are composed of multiple levels of “if-then” statements to segment data. For example, if high amino acid polarity leads to high S/N, then a decision tree would identify appropriate thresholds, alpha and beta, and create the rule: “If polarity > alpha, then S/N > beta”. This rule segments the data based on high/low polarity. Each decision tree is distinct as it is trained on a random subset of the data, selecting a fraction of the total number of rows and columns of the data matrix. This sampling has a 2-fold benefit: it avoids overfitting data and increases generalizability of the aggregated model. Random forest also has a low barrier for implementation due to existing toolboxes that can be used off-the-shelf. We used the randomForest library in the freely available software environment R, version 3.3.1. The common usage of random forest, in combination with its ease of use, provided an ideal framework for this study.
Computational Development
All data analysis and model training was performed in the freely available statistical software environment R, version 3.3.1. All code is documented in the following public git repository: https://github.com/xuebert/ML_SN_SAMDI_AChem. A generalized graphical user interface has been developed to visualize data in a bubble chart framework; this GUI is provided at https://github.com/xuebert/bubble_chart_app.
Results and Discussion
Experimental Design
We calculated peptide S/N using SAMDI mass spectrometry in two peptide arrays: Ac-GRKacXZC (K-array) and Ac-GXZHGC (H-array), where X and Z represent all combinations of 19 amino acids (cysteine omitted) for a total of 361 peptides in each array. To investigate the relationships between specific amino acids and S/N, we conducted statistical tests and machine learning. For each array, we trained a machine learning model with randomly chosen groups of peptides consisting of 5 to 350 peptides to discover patterns and make predictions of peptide S/N based on amino acid sequences. Through subsequent machine learning analysis, we identified physical properties and amino acid positions that are useful in predicting the peptide’s observed S/N. We applied the corresponding results to a published peptide array data set to reveal how S/N information can inform and serve as a guide for experimental design and analysis. In doing so, we discovered specific amino acid interactions that can explain observed S/N-amino acid relationships. From analysis of both arrays, we found that the machine learning models need to be trained on only 1/3 of peptides in each array to make accurate predictions of peptide S/N.
Preparation of Peptide Arrays and S/N Data Collection
We used solid-phase peptide synthesis to synthesize two peptide libraries containing terminal-cysteine residues, Ac-GRKacXZC (K-array) and Ac-GXZHGC (H-array), where X and Z represent all amino acids except cysteine for a total of 361 peptides in each array. Steel plates with 384 gold spots were soaked in a solution of disulfides as described earlier.9 The monolayers self-assembled onto the gold surfaces and presented a functional maleimide group allowing for the immobilization of thiol-containing molecules. We treated each monolayer surface with a unique peptide, which was immobilized to the surface through the side-chain thiol of the terminal cysteine residues. Eleven identical arrays were printed for the experiments that follow. We collected spectra for each immobilized peptide for both arrays on an AB Sciex 5800 MALDI mass spectrometer using reflector positive mode. Noise was quantified as the area under the curve (AUC) of the mass spectrum in a region devoid of signals, and the peptide signal was quantified as AUC of the expected peptide-terminated alkanethiol mass minus the noise AUC. Finally, we calculated S/N as the peptide’s signal AUC divided by the noise AUC and calculated the mean for each peptide over the 11 plates in each array.
S/N is Attributable to Single Amino Acids in the K-Array
Comprehensive analysis of the K-array revealed general trends of single amino acids in a peptide on the observed S/N for that peptide. We used the Fischer exact test (Bonferroni corrected p < 10–4) to determine whether peptides with low or high S/N were enriched with specific amino acids. The corresponding p-values reflect the probability that the observed number of amino acids is within either the low or high S/N region by random chance (gray regions in Figure 2A). All p-values are reported in Supporting Information Figures 1 and 2. We found enrichment of peptides with X-position tryptophan and leucine in the low S/N region and enrichment of peptides with Z-position glycine in the high S/N region (Figure 2B). This result suggests that single amino acids can have a strong effect on a peptide’s detectability in MALDI-MS. The exceptionally low S/N of tryptophan and leucine-containing peptides suggest that their S/N-lowering effect is particularly strong, further suggesting that future K-arrays can disregard tryptophan and leucine while favoring glycine.
Figure 2.

Low peptide S/N is observed in peptides containing tryptophan and leucine and aspartic acid and glutamic acid. Peptide S/N was averaged over 11 control plates. (A) Peptides in the K-array were sorted according to S/N. Low/high S/N regions are identified (see Methods). S/N ranges from 3.8 to 313.7, demonstrating that peptides vary greatly in S/N. (B) Amino acids found in the low/high regions were found to be statistically significant (Bonferroni corrected p < 10–4) using a Fischer exact test. The reported p-value is the chance the observed number of amino acids is within the low or high region by random chance. Peptides with X-position tryptophan and leucine have statistically low S/N, and peptides with Z-position glycine have statistically high S/N. Peptides that have X-position alanine are not statistically significant and are representative of other amino acids. Panels C and D describe the same methods for the H-array. S/N has a similarly large range for both arrays, but the differences in amino acids observations suggest that dissimilar mechanisms are responsible for S/N.
Peptides in the K-array display a wide range of S/N—from 3.8 to 313.7 (S/N is unitless)—demonstrating a wide range of poorly detectable to detectable peptides (Figure 2A). Combined with the statistical tests, this result suggests that poorly detectable peptides can be predicted by their sequence. This observation may explain differences in MS-detectable peptide fragments after protein digestion.30,31 In MS-based proteomics experiments, proteins are commonly digested and the fragments are detected using mass spectrometry. It is rare for complete detection of all peptide sequences after digestion,32,33 and incorporation of known poorly detectable peptide information could increase confidence of protein observation. As we demonstrate, characterization of a MALDI-MS experimental pipeline with known peptide sequences can inform subsequent protein quantification experiments.
Machine Learning Model Predicts SAMDI-MS S/N as a Function of Amino Acid Sequence
We developed a machine learning model to predict the S/N of peptide-terminated alkanethiolates in the SAMDI spectrum based on amino acid sequence with high accuracy suggesting that amino acid composition drives S/N observations in a predictive manner. We trained a random forest34 machine learning model to predict S/N based on the hydrophilic, steric, and electronic physical properties of amino acids.35 The training data contained 361 peptides (rows) and 39 associated physical properties for each of the X- or Z-position amino acids (resulting in 78 columns). The response vector, or predicted variable, defines the mean S/N from the 11 control plates.
We used cross-validation, where a data sample (randomly selected rows) is left out for model testing, to calculate the predictive power Q2 statistic37
In this formulation, yi is the true S/N for the left-out test peptide i, ŷi is the predicted S/N of the test peptide, y̅train is the sample mean of S/N in the training set, and n is the number of cross-validated test peptides. The Q2 statistic can take on values from −∞ to 1, where 1 represents perfect prediction and 0 is equivalent to random performance. Cross-validation effectively simulates a partially synthesized array. By training on a randomly selected subset of peptides and testing simulated predictions on the remaining data, cross-validation mimics the process of experimentally validating peptide-S/N relationships. We create an explicit null model for each case by randomizing the data values prior to model training; the average Q2 value of the null case was about 0.
The K-array analysis resulted in a Q2 of 0.59 using both X- and Z-positions and all 39 amino acid physical properties. The high Q2 value confirms our hypothesis that S/N values can be reliably predicted from amino acid sequences. This performance further suggests that S/N of new amino acids, such as non-natural amino acids, can be predicted using their known physical properties. Together these results strongly indicate that amino acid sequence influences S/N in MALDI-MS. However, the inability to acquire a Q2 value closer to 1 suggests that hidden variables—such as chemical interactions with amino acids outside the X- and Z-positions—play an important role in the overall response. These interactions are challenging to take into account, as they cannot be characterized with physical properties alone.
Bubble Chart Illustrates the S/N as an Experimental Design Parameter
As a measure of data quality, the S/N becomes another experimental design parameter. When studying enzyme activity on SAMDI peptide arrays, we measure the extent of peptide conversion with the enzyme.15 Enzyme-treated peptides can be sorted into four categories: (i) high enzyme activity and high S/N, (ii) high enzyme activity and low S/N, (iii) low enzyme activity and high S/N, and (iv) low enzyme activity and low S/N. In the past, the SAMDI peptide array data was compiled into heat-maps that portrayed only enzymatic activity. We wanted to incorporate a metric into SAMDI array data output to differentiate between peptides that offer reliable and valuable information (category i from those of lesser importance).
To this end, we include S/N information to complement a previously published experiment.15 We construct a bubble chart where each peptide is represented by a circle, whose color represents the extent of peptide conversion to the product, and whose size represents normalized S/N of the peptide before enzyme treatment. Previous approaches that use a color-only heatmap give the impression that each data point is equally valid in an analysis of the array data. However, some of the peptides contribute information that is more reliable because they have smaller errors. Observed enzyme activity on a peptide does not always correlate to significance. By incorporating S/N in bubble size, we rule out low performance signals and focus the analysis on high S/N ones. We illustrate this approach by replotting the heatmaps from Kuo et al.15 to include S/N (Figure 3).
Figure 3.
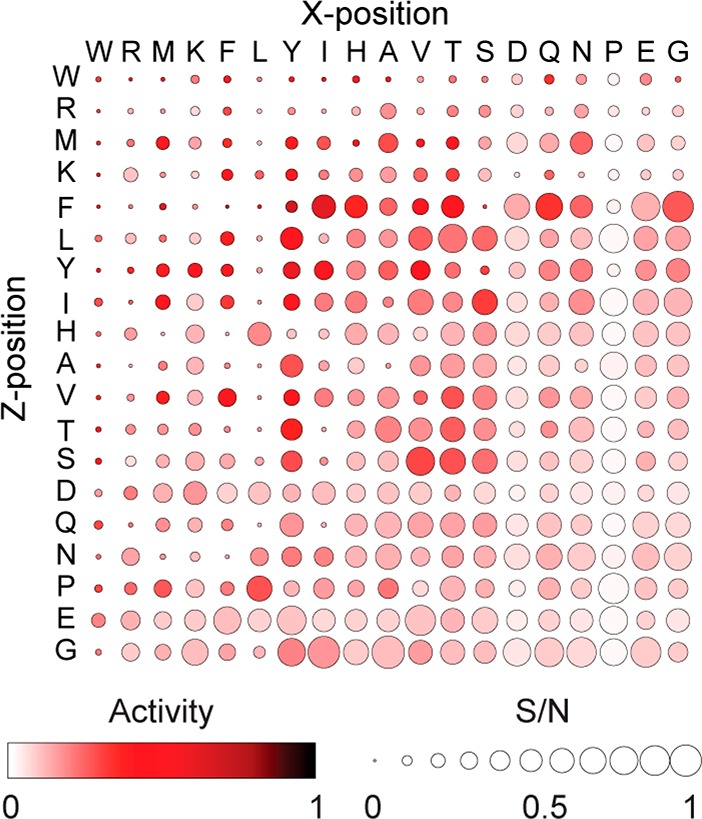
Heatmap of cell lysate deacetylation activity and S/N highlights trustworthy peptides. Bubble color is based on deacetylase activities from Kuo et al.9 for lysate treated ac-GRKacXZKC peptide arrays. Bubble area represents peptide S/N before lysate treatment, normalized by max S/N. Amino acids are sorted by their general trend in peptide S/N when in either X- or Z-position. Peptides containing tryptophan (W), arginine (R), methionine (M), and lysine (K) have consistently low S/N, regardless of position. This illustration emphasizes peptides that are both active in terms of enzymatic activity and reliable in terms of S/N. In contrast, the highest activity peptides (darkest in color) do not necessarily give the highest S/N (largest bubble).
In Kuo et al.,15 the K-array was exposed to cell lysates, and endogenous deacetylase activity was quantified by measuring the fraction of deacetylated peptides with MALDI mass spectrometry.15 Deacetylation activity was quantified as the AUC of the modified (deacetylated) peptide divided by the AUC of both modified and unmodified peptides. AUC of each peptide is the sum of the three background-subtracted ion peaks in MALDI-MS: H+, Na+, and K+.
This new analysis revealed additional insights into the previous data. Peptides containing amino acids tryptophan, leucine, arginine, methionine, and lysine reflect low S/N, suggesting that their activity profiles are less useful. Conversely, peptides containing proline, glutamic acid, and glycine reflect high S/N, suggesting that their activity profiles are more useful. Peptides containing leucine exhibit low S/N exclusively in the X-position, demonstrating that certain amino acids can have positional effects on S/N. Though amino acid presence can largely explain a peptide’s S/N, we also find that some peptides have inexplicably low S/N—such as KAA, KIT, and KIQ—despite general trends suggesting that these peptides should have high S/N. This peculiarity highlights the complexities in S/N and reinforces the utility of machine learning strategies to predict S/N, which can be a critical design factor for future arrays.
Testing for S/N does not supplant tightly controlled and validated peptide array experiments. Instead, we suggest that accounting for unknown influences that lower confidence of a signal’s true value—such as peptide synthesis inefficiencies, side reactions, peptide loss from washing, or ionization efficiencies—can better guide experimental design and data analysis. These influences are especially complicated with peptide species, where it is not clear how different amino acid sequences affect S/N. Machine learning can easily account for such effects.
Low S/N Peptides Offer Unrepresentative Signals
The experiments by Kuo et al. demonstrated that low S/N peptides have higher variance across replicates. The same K-array measurements were carried out on two time points and across three different cellular conditions. We compared the variance in replicates of peptides in the top 20% of S/N to those in the bottom 20%. A one-sided F-test verified that the top 20% peptides have lower replicate variance than the lower 20% across all three conditions and across both time points (p < 10–10 for all cases). This finding suggests that peptides with low S/N have unrepresentative (or possibly random) signals, and they should be weighted less during analysis to avoid misled conclusions. To investigate further, we calculated the standard deviation of deacetylase activity on each peptide and plotted it against S/N (Supporting Information Figure 3A); peptides with lower S/N have a higher variance in deacetylase activity. This trend was consistent for all days and for all experimental conditions, with a high anticorrelation coefficient (ranging from −0.814 to −0.975, Supporting Information Figure 3B), demonstrating that peptides with low S/N can give unrepresentative measurements.
S/N is Attributable to Single Amino Acids in the H-Array
We investigate the H-array, Ac-GXZHGC, to analyze the generalizability of our findings; that is, do S/N characteristics of peptides from the K-array also apply to other peptide arrays? Similar to the K-array, the H-array has a wide range of S/N values, ranging from 5.5 to 255 (Figure 2C and 2D), reinforcing the fact that peptides span a wide range of nondetectable to detectable signals in MALDI. The statistically low S/N peptides contain aspartic acid and/or glutamic acid, suggesting that their synthesis may be unnecessary in future experiments. Peptides with phenylalanine have statistically high S/N values suggesting that additional phenylalanine may improve peptide signals in the H-array.
Context Matters: S/N Characteristics Are Inconsistent between the K-Array and H-Array
In addition to the variable composition of amino acids, the surrounding amino acids (those not in the X- or Z-position) play a role. Within the same array, S/N appears consistent between positions (Supporting Information Figure 4), suggesting that S/N remains largely unchanged when amino acid substitutions are made in the X- or Z-positions. However, peptides that had the lowest S/N in the K-array contained tryptophan, arginine and methionine; those with the lowest S/N in the H array had aspartic acid and glutamic acid. This disparity demonstrates that S/N characteristics in one array can be contextual and are not always consistent with a different array (Figure 4). This observation suggests that the outside amino acids—arginine and lysine in the K-array and histidine in the H-array—strongly influence SAMDI peptide detection. In other words, the amino acid context around X- and Z-positions influences overall peptide detection, and partial knowledge of amino acid sequence is insufficient in understanding S/N values. This finding suggests that future SAMDI arrays require individual peptide–S/N characterization, and current understanding of mass spectrometric peptide–S/N relationships is insufficient to design a peptide array a priori.
Figure 4.

Amino acid influence is context dependent. Amino acids are sorted by their correlated mean peptide S/N in the K-array when in either X- or Z-positions. Bars represent S/N normalized by the highest value within each array. The H-array shows little agreement, suggesting that the surrounding amino acids strongly influence S/N. The two negatively charged amino acids, aspartic and glutamic acid, have the largest difference between the two arrays, suggesting a relation between charge and S/N, but only within the H-array.
Physical Interactions Help Inform S/N Differences
S/N differences can arise from a variety of sources, including synthesis inefficiencies, side reactions, and poor MALDI-MS ionization. Peptides with both methionine and tryptophan have low S/N in the K-array, and both have shown sensitivity to oxidation,27,28 sequestering the relevant peaks and lowering signal strength. However, Lee and co-workers demonstrated greater oxidation of histidine than either methionine or tryptophan,38 and Stafford and co-workers reported similar findings in oxidation of histidine in peptide arrays.27 Their results are contrary to our lack of observed histidine oxidation (or low S/N) in either array, which remains unexplained.
In contrast to the K-array where methionine and tryptophan associate with the lowest S/N, glutamic acid and aspartic acid have the lowest S/N in the H-array (Figure 4). Lysine has strongly favorable hydrogen bonding energies,39 and when in close vicinity of methionine and tryptophan, hydrogen bonding could catalyze oxidation.39,40 Tryptophan-containing peptides have statistically low S/N specifically when in the X-position (Figure 2), which is directly adjacent to the lysine and further supports this hypothesis. If hydrogen bonding stabilization is required for methionine or tryptophan oxidation, then the presence of carboxylic acid groups on acidic amino acids may be unfavorable for oxidation. To explore this concept further, we compared methionine or tryptophan containing K-array peptides with either glutamic or aspartic acid to those without glutamic or aspartic acid. We applied a Mann–Whitney U test and found that peptides with one of methionine or tryptophan and one of glutamic or aspartic acid had higher S/N values (p = 0.0050) than peptides with methionine or tryptophan without either glutamic or aspartic acid, maybe indicating that the two acidic amino acids protect against methionine and tryptophan oxidation.
High S/N peptides in the K-array commonly contain hydrophilic amino acids, such as glutamic acid, asparagine, and glutamine, potentially because of more efficient crystallization within the matrix. This finding is in agreement with a report by Fenselau and co-workers, where hydrophilic proteins were preferentially detected in MALDI-MS due to differences in the cocrystallization.21 However, the H-array has high S/N associated with hydrophobic amino acids: proline, tyrosine, phenylalanine, and isoleucine. The divergence in S/N of hydrophobic and hydrophilic amino acids suggests that mechanisms leading to high S/N are different between the two arrays.
A two sided Mann–Whitney U test (Bonferroni corrected p < 2.6 × 10⁻³) reveals peptides that contain eight amino acids in the X- or Z-position that have statistically different S/N values between the two arrays: glutamic acid, tryptophan, aspartic acid, methionine, arginine, lysine, glycine, and phenylalanine. This test directly compares differences between the two arrays rather than within the array, which has resulted in more amino acids than the Fischer exact test in Figure 2. Only arginine and phenylalanine differ from Figure 2, and both amino acids have lower S/N in the K-array. This result contrasts with those of Krause and co-workers where peptides with higher numbers of arginine or phenylalanine typically contributed to higher MALDI signal strength25 (the K-array has an additional arginine). The unusual observation may be due to an unknown interaction with other outside amino acids, indicating that peptide S/N should be tested for each peptide array.
Machine Learning Performance Across Positions and Physical Properties Help Explain S/N Observations
We trained random forest models with individual physical properties to assess the impact each property has on S/N. Highly predictive properties (namely, those with highest Q2) suggest that the associated physical property is highly relevant and predictive of SAMDI-MS S/N. In addition, we independently evaluated the X- and Z-positions to see if one position reflected more predictive power. Positional differences suggest that the amino acid position, and not merely composition, influences the predictive power of our machine learning model.
Using both X- and Z-positions and all physical properties, the K-array and H-array had a Q2 of 0.59 and 0.61, respectively (Figure 5). The similar Q2 values suggest that the models reached an upper limit to predictive performance from amino acid sequence. Predictions based on the amino acids in both X- and Z- positions consistently performed better than predictions based solely on one position: Q2 = 0.22 and 0.20 for the X- and Z-positions in the K-array, respectively, and Q2 = 0.16 and 0.28 in the X- and Z-positions of the H-array, respectively. As expected, more complete amino acid information results in better prediction. However, the higher Q2 for the Z-position in the H-array suggests that positions can have varied influence on S/N. This observation suggests that the Z-position interacts with the histidine to change S/N detection in MALDI-MS more strongly than the X-position. In addition, the highest single property Q2 values—0.57 and 0.54 in the K- and H-array, respectively—are close to the Q2 value of all properties. This observation indicates that few properties are necessary to predict S/N and that many physical properties are redundant.
Figure 5.
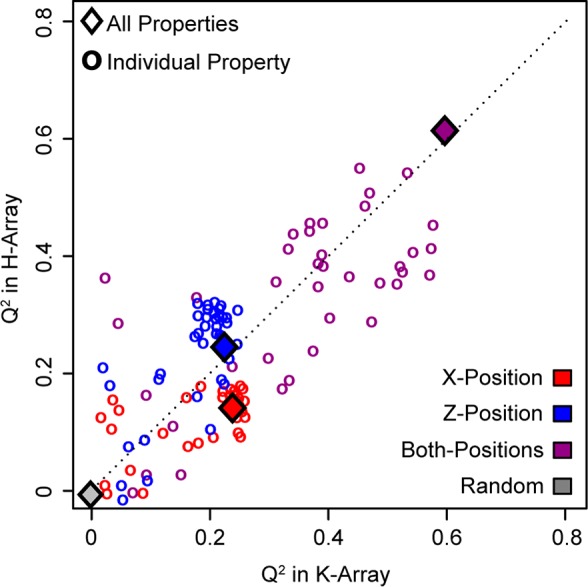
Peptide S/N is predicted as a function of amino acid properties. Peptide S/N was predicted using a random forest machine learning model based on 39 amino acid physical properties, shown in diamonds, of the amino acid in either the X-position (red), Z-position (blue), or both (purple). Also, models were fit on individual properties to identify their predictive power, shown in circles. Random forest models contained 1000 trees and the predictive power, quantified by the Q2 metric, was calculated based on 5-fold cross-validation. All Q2 values are listed in Supporting Information Tables 1 and 2. Consistent for both peptide arrays, the highest Q2 values were attained when using both positions with all physical properties (purple diamond). Z-position Q2 values (blue) are higher in the H-array, which suggests that positions have varied predictive power on S/N. In addition, most properties lie near the diagonal indicating that they have similar predictive power between peptide arrays; the amino acid disagreement in Figure 4, however, suggests that those properties are predictive for different reasons.
In terms of physical properties (39 total), we do find both consistent and inconsistent trends for the two arrays. Electronic properties (15 total) tend to be less predictive for both arrays than steric or hydrophilic properties (Supporting Information Tables 1 and 2). Steric properties (16 total) and hydrophilic properties (8 total) are especially highly predictive in the K- and H-arrays, respectively. Hydrophilic properties are highly predictive in the H-array potentially due to the hydrophilicity of glutamic and aspartic acid and their association with low S/N exclusively in the H-array. Similarly, hydrophobic amino acids like proline, tyrosine, phenylalanine, and isoleucine tend to have high S/N. This alignment explains why hydrophilic properties are predictive in the H-array. However, it is unclear why electronic properties are relatively less predictive while steric properties are more predictive in the K-array.
Despite these differences, physical properties are similarly predictive between the K-array and H-array (Figure 5), as evident in their closeness to the diagonal. That is, a predictive or nonpredictive property remains largely the same between arrays, but there still exist small differences between the performance of steric and hydrophilic properties between arrays. This relation demonstrates that the same properties govern S/N observations, but because single amino acids differ in S/N characteristics (Figure 4), these results altogether suggest that S/N values manifest from different mechanisms between the arrays. These different mechanisms are likely a direct result of context differences, specifically relating to the outside amino acids.
Machine Learning Cannot Predict S/N on Completely Unknown Peptide Arrays
We trained various machine learning models on the K-peptide array and tested them on the H-array, and vice versa, to assess the feasibility of predicting S/N on a de novo peptide array. We trained models for every positional combination to interrogate exhaustively the entire space. For example, we trained a model on X-position data in the K-array, then testing on the Z-position in the H-array, and we continued with all combinations of positions. We also trained several types of models to gauge whether common machine learning models can predict S/N on different arrays: random forest,34 deep learning,41 nearest neighbor regression,42 and partial least-squares regression.43 The models had the following model-specific parameters: random forest had 1000 trees, deep learning consisted of two layers of 200 nodes with feed-forward connections; nearest neighbors regression used 10 neighbors; and partial least-squares regression used one component, or loading vector.
All models trained on the K-array failed to predict S/N in the H-array, and vice versa (Q2 < 0.1). This failure is attributable to S/N disagreement between peptide arrays for each amino acid (Figure 4), which arises from the unique outside amino acids in the two arrays (GRKacXZC and GXZHGC). This finding reinforces the idea that context matters: interactions with outside amino acids influence S/N, and that peptide–S/N relationships within one array do not always generalize to other arrays. While these results do not present general rules for peptide S/N predictions on new arrays, we have developed a method that will be invaluable for designing and preparing new SAMDI peptide arrays. This work introduces a strategy to identify the specific rules of a given array.
Only 1/3 of Peptides in an Array Are Required for Machine Learning Model Prediction of Peptide S/N
We investigated the minimum number of peptides in an array needed to train a model that could accurately predict S/N of the full array. We simulated a partially synthesized array by randomly selecting subsets of peptides from each array to train the machine learning model to predict S/N of the nonselected peptides. The number of randomly selected training peptides ranged from 5 to 350, and each training size contained 200 repetitions of selecting random peptides. We trained a random forest model with all 39 physical properties in both amino acid positions. The null model with randomized data performed consistently around Q2 = 0. We identified the point of diminishing returns, which balances minimum training size with maximum predictive power, by normalizing the number of training peptides and finding the sample size closest to training size 1 and Q2 = 1. The point of diminishing returns was found to be 87 and 111 peptides for the K-array and H-array, respectively, both of which had a Q2 = 0.48 (shown with arrows in Figure 6). In other words, as the number of training peptides used increases, the Q2 (predictive power) increases until 87 peptides are used in the K-array and 111 peptides are used in the H-array, when Q2 becomes roughly constant. This result shows that we can partially screen future peptide arrays by synthesizing only about 100 of the planned 361-sized array, or roughly one-third, reducing the use of resources and time. Though we cannot generalize this specific ratio to larger array sizes, these results suggest that only a fraction of peptides in a given array need to be synthesized to identify the rules of that array, and the remaining synthesis can be tailored based on those specific rules. This machine learning technique can prevent costly experimental screens and assist researchers optimize the design of future arrays.
Figure 6.
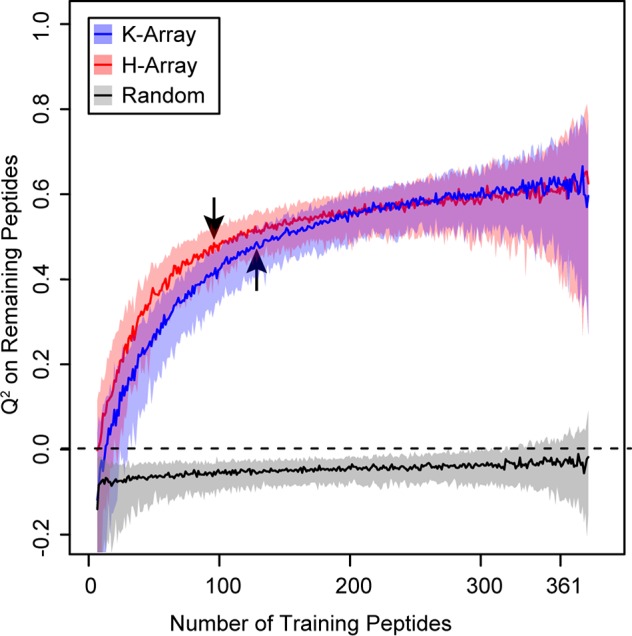
Peptide array S/N can be predicted from a minimal peptide subsample. A specified number of peptides were randomly selected for training to predict S/N of the remaining peptides using all physical properties of both X- and Z-position amino acids. Because of computational constraints, random forest was used with 100 trees for training set sizes from 5 to 350. The median Q2 and 80% confidence intervals are shown for 200 random training sets. For both peptide arrays, predictive power increases with training size and levels out around 100 peptides. The optimal trade-off was identified by normalizing the number of training peptides and finding the sample size closest to training size 1 and Q2 = 1. The trade-off is shown with arrows: 87 training peptides for K-array and 111 for H-array, which demonstrates that machine learning can predict S/N for future peptide arrays, avoiding costly experiments that screen for high S/N peptides. A randomized data set performed consistently around Q2 = 0.
Conclusions
There are significant variations in the intensities of peaks in SAMDI mass spectrometry that can arise from different peptide sequences. SAMDI analysis of peptide arrays demonstrates that peptide signals can have a wide range of S/N, where many of the peptides are nearly undetectable. We find that S/N is attributable to single amino acids, offering design choices to increase information content. However, the underlying basis of S/N is unclear and may be due to complex interactions among amino acids, matrix, crystallization, or ionization efficiencies. Additionally, we find that the two arrays used in this work exhibited different S/N values for different amino acids, demonstrating that the whole amino acid sequence can affect S/N values in MALDI-MS. Machine learning identified physical properties that predict S/N with high accuracy. Machine learning models can be trained on a fraction of the peptide sequences and still describe the full set of sequences, allowing early selection of high S/N peptides. Such computational models allow for the design of arrays consisting of only high S/N peptides without costly screens or unnecessary peptide library syntheses. Additionally, accounting for S/N as a design choice can prevent inaccurate results drawn from poor peptide measurements.
This work significantly improves and simplifies high-throughput data analysis by factoring in data quality. The statistical and machine learning methods presented here allow us to discover the most valuable information from peptide arrays and plan future experiments with more confidence. As demonstrated, these methods can inform the design of new peptide arrays using a small set of presynthesized peptides. The presented methodology and applications of S/N are adapted to maximize the information learned from peptide array experiments and can improve peptide design across a wide range of technologies.
Acknowledgments
This work was supported by Intelligence Advanced Research Projects Activity (BAA-13-04) and the Center of Cancer Nanotechnology Excellence initiative of the National Institutes of Health’s National Cancer Institute (U54 CA199091). The authors would like to acknowledge computational resources and staff support provided by the Quest High Performance Computing Facility at Northwestern University.
Supporting Information Available
The Supporting Information is available free of charge on the ACS Publications website at DOI: 10.1021/acs.analchem.7b01728.
Full summary of statistical tests to identify high/low S/N amino acids, (ii) figures illustrating anticorrelation between peptide standard deviation and S/N, (iii) a full breakdown of amino acid influence on S/N, and (iv) tables for individual physical property predictive power (Q2 values) (PDF)
The authors declare no competing financial interest.
Supplementary Material
References
- Aarts J. M. M. J. G.; Wang S.; Houtman R.; Van Beuningen R. M. G. J.; Westerink W. M. A.; Van De Waart B. J.; Rietjens I. M. C. M.; Bovee T. F. H. Chem. Res. Toxicol. 2013, 26 (3), 336–346. 10.1021/tx300463b. [DOI] [PubMed] [Google Scholar]
- Murayama N.; Van Beuningen R.; Suemizu H.; Guguen-guillouzo C.; Shibata N.; Yajima K.; Utoh M.; Shimizu M.; Chesne C.; Nakamura M.; Guengerich F. P.; Houtman R.; Yamazaki H. Chem. Res. Toxicol. 2014, 27, 304–308. 10.1021/tx4004374. [DOI] [PMC free article] [PubMed] [Google Scholar]
- Zandian A.; Forsström B.; Häggmark-Månberg A.; Schwenk J. M.; Uhlén M.; Nilsson P.; Ayoglu B. J. Proteome Res. 2017, 16, 1300–1314. 10.1021/acs.jproteome.6b00916. [DOI] [PubMed] [Google Scholar]
- Wu C.; Ma M. H.; Brown K. R.; Geisler M.; Li L.; Tzeng E.; Jia C. Y. H.; Jurisica I.; Li S. S. Proteomics 2007, 7, 1775–1785. 10.1002/pmic.200601006. [DOI] [PubMed] [Google Scholar]
- Reineke U.; Ivascu C.; Schlief M.; Landgraf C.; Gericke S.; Zahn G.; Herzel H.; Volkmer-Engert R.; Schneider-Mergener J. J. Immunol. Methods 2002, 267 (1), 37–51. 10.1016/S0022-1759(02)00139-4. [DOI] [PubMed] [Google Scholar]
- Umali A. P.; Leboeuf S. E.; Newberry R. W.; Kim S.; Tran L.; Rome W. A.; Tian T.; Taing D.; Hong J.; Kwan M.; Heymann H.; Anslyn E. V. Chem. Sci. 2011, 2, 439–445. 10.1039/C0SC00487A. [DOI] [Google Scholar]
- Ghanem E.; Afsah S.; Fallah P. N.; Lawrence A.; LeBovidge E.; Raghunathan S.; Rago D.; Ramirez M. A.; Telles M.; Winkler M.; Schumm B.; Makhnejia K.; Portillo D.; Vidal R. C.; Hall A.; Yeh D.; Judkins H.; da Silva A. A.; Franco D. W.; Anslyn E. V. ACS Sensors 2017, 2, 641. 10.1021/acssensors.6b00809. [DOI] [PubMed] [Google Scholar]
- Farrow B.; Hong S. A.; Romero E. C.; Lai B.; Coppock M. B.; Deyle K. M.; Finch A. S.; Stratis-cullum D. N.; Agnew H. D.; Yang S.; Heath J. R. ACS Nano 2013, 7 (10), 9452–9460. 10.1021/nn404296k. [DOI] [PubMed] [Google Scholar]
- Pfeilsticker J. A.; Umeda A.; Farrow B.; Hsueh C. L.; Deyle K. M.; Kim J. T.; Lai B. T.; Heath J. R. PLoS One 2013, 8 (10), e76224. 10.1371/journal.pone.0076224. [DOI] [PMC free article] [PubMed] [Google Scholar]
- Lesaicherre M. L.; Uttamchandani M.; Chen G. Y. J.; Yao S. Q. Bioorg. Med. Chem. Lett. 2002, 12 (16), 2085–2088. 10.1016/S0960-894X(02)00378-5. [DOI] [PubMed] [Google Scholar]
- Takahashi M.; Nokihara K.; Mihara H. Chem. Biol. 2003, 10, 53–60. 10.1016/S1074-5521(02)00308-3. [DOI] [PubMed] [Google Scholar]
- Kaeberlein M.; Mcdonagh T.; Heltweg B.; Hixon J.; Westman E. A.; Caldwell S. D.; Napper A.; Curtis R.; Distefano P. S.; Fields S.; Bedalov A.; Kennedy B. K. J. Biol. Chem. 2005, 280 (17), 17038–17045. 10.1074/jbc.M500655200. [DOI] [PubMed] [Google Scholar]
- Gurard-Levin Z. A.; Kilian K. A.; Kim J.; Bahr K.; Mrksich M. ACS Chem. Biol. 2010, 5 (4), 863–873. 10.1021/cb100088g. [DOI] [PMC free article] [PubMed] [Google Scholar]
- Ban L.; Pettit N.; Li L.; Stuparu A. D.; Cai L.; Chen W.; Guan W.; Han W.; Wang P. G.; Mrksich M. Nat. Chem. Biol. 2012, 8 (9), 769–773. 10.1038/nchembio.1022. [DOI] [PMC free article] [PubMed] [Google Scholar]
- Kuo H. Y.; Deluca T. A.; Miller W. M.; Mrksich M. Anal. Chem. 2013, 85 (22), 10635–10642. 10.1021/ac402614x. [DOI] [PMC free article] [PubMed] [Google Scholar]
- Gurard-levin Z. A.; Scholle M. D.; Eisenberg A. H.; Mrksich M. ACS Comb. Sci. 2011, 13, 347–350. 10.1021/co2000373. [DOI] [PMC free article] [PubMed] [Google Scholar]
- Medzihradszky K. F.; Campbell J. M.; Baldwin M. A.; Falick A. M.; Juhasz P.; Vestal M. L.; Burlingame A. L. Anal. Chem. 2000, 72 (3), 552–558. 10.1021/ac990809y. [DOI] [PubMed] [Google Scholar]
- Zenobi R.; Knochenmuss R. Mass Spectrom. Rev. 1998, 17, 337–366. 10.1002/(SICI)1098-2787(1998)17:5<337::AID-MAS2>3.0.CO;2-S. [DOI] [Google Scholar]
- Krause E.; Wenschuh H.; Jungblut P. R. Anal. Chem. 1999, 71 (19), 4160–4165. 10.1021/ac990298f. [DOI] [PubMed] [Google Scholar]
- Valero M.; Giralt E.; Andreu D. Lett. Pept. Sci. 1999, 6, 109–115. 10.1023/A:1008819923662. [DOI] [Google Scholar]
- Ryzhov V.; Fenselau C. Anal. Chem. 2001, 73 (4), 746–750. 10.1021/ac0008791. [DOI] [PubMed] [Google Scholar]
- Pashkova A.; Moskovets E.; Karger B. L. Anal. Chem. 2004, 76 (15), 4550–4557. 10.1021/ac049638+. [DOI] [PubMed] [Google Scholar]
- Beavis R. C.; Bridson J. N. J. Phys. D: Appl. Phys. 1993, 26 (3), 442–447. 10.1088/0022-3727/26/3/015. [DOI] [Google Scholar]
- Amado F. M. L.; Domingues P.; Graça Santana-Marques M.; Ferrer-Correia A. J.; Tomer K. B. Rapid Commun. Mass Spectrom. 1997, 11, 1347–1352. 10.1002/(SICI)1097-0231(199708)11:12<1347::AID-RCM974>3.0.CO;2-8. [DOI] [Google Scholar]
- Baumgart S.; Lindner Y.; Kühne R.; Oberemm A.; Wenschuh H.; Krause E. Rapid Commun. Mass Spectrom. 2004, 18, 863–868. 10.1002/rcm.1416. [DOI] [PubMed] [Google Scholar]
- Stavenhagen K.; Hinneburg H.; Thaysen-andersen M.; Hartmann L.; Silva V.; Fuchser J.; Kaspar S.; Rapp E.; Seeberger H.; Kolarich D. J. Mass Spec. 2013, 48, 627–639. 10.1002/jms.3210. [DOI] [PubMed] [Google Scholar]
- Legutki J. B.; Zhao Z.; Greving M.; Woodbury N.; Johnston S. A.; Stafford P. Nat. Commun. 2014, 5, 4785. 10.1038/ncomms5785. [DOI] [PubMed] [Google Scholar]
- Stadtman E. R.; Levine R. L. Amino Acids 2003, 25, 207–218. 10.1007/s00726-003-0011-2. [DOI] [PubMed] [Google Scholar]
- Gay S.; Binz P. A.; Hochstrasser D. F.; Appel R. D. Proteomics 2002, 2 (10), 1374–1391. 10.1002/1615-9861(200210)2:10<1374::AID-PROT1374>3.0.CO;2-D. [DOI] [PubMed] [Google Scholar]
- Fusaro V. A.; Mani D. R.; Mesirov J. P.; Carr S. A. Nat. Biotechnol. 2009, 27 (2), 190–198. 10.1038/nbt.1524. [DOI] [PMC free article] [PubMed] [Google Scholar]
- Sanders W. S.; Bridges S. M.; Mccarthy F. M.; Nanduri B.; Burgess S. C. BMC Bioinf. 2007, 8 (Suppl 7), S23. 10.1186/1471-2105-8-S7-S23. [DOI] [PMC free article] [PubMed] [Google Scholar]
- Scheler C.; Lamer S.; Pan Z.; Li X. P.; Salnikow J.; Jungblut P. Electrophoresis 1998, 19 (6), 918–927. 10.1002/elps.1150190607. [DOI] [PubMed] [Google Scholar]
- Silva J. C.; Gorenstein M. V.; Li G.-Z.; Vissers J. P. C.; Geromanos S. J. Mol. Cell. Proteomics 2006, 5 (1), 144–156. 10.1074/mcp.M500230-MCP200. [DOI] [PubMed] [Google Scholar]
- Svetnik V.; Liaw A.; Tong C.; Culberson J. C.; Sheridan R. P.; Feuston B. P. J. Chem. Inf. Comput. Sci. 2003, 43, 1947–1958. 10.1021/ci034160g. [DOI] [PubMed] [Google Scholar]
- Mei H.; Liao Z. H.; Zhou Y.; Li S. Z. Biopolymers 2005, 80 (2005), 775–786. 10.1002/bip.20296. [DOI] [PubMed] [Google Scholar]
- Svetnik V.; Liaw A.; Tong C.; Wang T. MCS 2004: Multiple Classifier Systems 2004, 3077, 334–343. 10.1007/978-3-540-25966-4_33. [DOI] [Google Scholar]
- Schüürmann G.; Ebert R.; Chen J.; Wang B.; Kühne R. J. Chem. Inf. Model. 2008, 48, 2140–2145. 10.1021/ci800253u. [DOI] [PubMed] [Google Scholar]
- Matheson I. B. C.; Lee J. Photochem. Photobiol. 1979, 29 (1976), 879–881. 10.1111/j.1751-1097.1979.tb07786.x. [DOI] [PubMed] [Google Scholar]
- Schoneich C. Biochim. Biophys. Acta, Proteins Proteomics 2005, 1703, 111–119. 10.1016/j.bbapap.2004.09.009. [DOI] [PubMed] [Google Scholar]
- Bobrowski K.; Schdneich C. J. Chem. Soc., Chem. Commun. 1993, 795–797. 10.1039/c39930000795. [DOI] [Google Scholar]
- Lusci A.; Pollastri G.; Baldi P. J. Chem. Inf. Model. 2013, 53, 1563–1575. 10.1021/ci400187y. [DOI] [PMC free article] [PubMed] [Google Scholar]
- Cedeño W.; Agrafiotis D. K. J. Comput.-Aided Mol. Des. 2003, 17 (1), 255–263. 10.1023/A:1025338411016. [DOI] [PubMed] [Google Scholar]
- Janes K. a; Kelly J. R.; Gaudet S.; Albeck J. G.; Sorger P. K.; Lauffenburger D. A. J. Comput. Biol. 2004, 11 (4), 544–561. 10.1089/cmb.2004.11.544. [DOI] [PubMed] [Google Scholar]
Associated Data
This section collects any data citations, data availability statements, or supplementary materials included in this article.