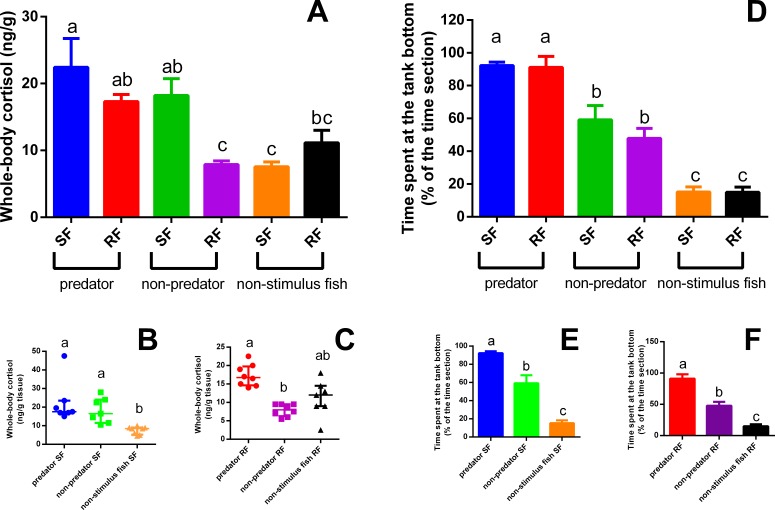
Figure 2. Whole-body cortisol response (mean + SEM) (A) and time spent in the tank bottom (mean ±SEM) (D) of SF (B and E) and RF (C and F).
Data of panels (A) and (D) were compared by two-way ANOVA followed by Tukey’s multiple range test. Data of panels B and C were compared by Kruskal Wallis complemented by a Dunn’s multiple comparisons test, while data of panels (E) and (F) by One-way ANOVA folowed by Tukey’s multiple range test (n = 7–8 for cortisol and 4 for behavioral analysis). Different letters above medians or means indicate statistical differences.

