



Abstract
Permethrin, a type 1 pyrethroid insecticide, was previously reported to promote adipogenesis in 3T3-L1 adipocytes and insulin resistance in C2C12 muscle cells; however, the effects of permethrin exposure on glucose and lipid metabolisms in vivo remain unknown. The purpose of this study was to investigate the effects of permethrin exposure on glucose and lipid homeostasis as well as voluntary movement in female mice in response to dietary fat. We tested three doses of permethrin (50, 500, & 5000 μg/kg body weight/day) in low fat diet-fed (4% w/w of diet) and high fat diet-fed (20% w/w of diet) female C57BL/6J mice for twelve weeks. Our results demonstrated that permethrin treatment potentiated high fat diet-induced insulin resistance as indicated by insulin tolerance tests, glucose tolerance tests, and homeostasis model assessment - insulin resistance (HOMA-IR) without altering weight or fat mass. Permethrin treatment significantly decreased voluntary movement and elevated blood glucose and insulin levels. Western blot results further showed that permethrin impaired insulin signaling via the Akt signaling pathway in the gastrocnemius muscle. Taken together, these results suggest that oral administration of permethrin potentiated high fat diet-induced insulin resistance, possibly increasing the risk of type 2 diabetes without altering weight gain in female C57BL/6J mice.
Keywords: Permethrin, insecticide, glucose metabolism, voluntary activities
Introduction
Permethrin [(±)-3-phenoxybenzyl 3-(2,2-dichlorovinyl)-2,2 dimethylcyclopropanecarboxylate] is a synthetic insecticide that belongs to the pyrethroid family, which possesses a structural resemblance to natural pyrethrins. Synthesized in 1973, permethrin was first registered for use by the U.S. by Environmental Protection Agency in 1979 (Elliott et al., 1973; Toynton et al., 2009). Permethrin demonstrates significantly improved photostability compared with the natural pyrethrins without sacrificing their potent insecticidal activities and low acute mammalian toxicity (Soderlund et al., 2002). Permethrin is one of the most widely-used synthetic pyrethroid insecticides in agricultural, veterinary, medical, and household settings (Tornero-Velez et al., 2012). Other applications of permethrin include public health mosquito control programs, hair treatment for head lice infestations, and clothing impregnation as an ectoparasite repellant. Thus, human exposure to permethrin is quite likely. The use of pyrethroids has dropped slightly since 1997 (Casida et al., 2013), but they are still the second largest insecticide class currently on the market, accounting for 16% of the global insecticides sales in 2015 (Sparks et al., 2015).
Permethrin was previously reported to promote adipogenesis and induce insulin resistance in cell culture models, similar to other types of membrane-depolarizing insecticides (Howell et al., 2011; J. Kim et al., 2013, 2014; Moreno-Aliaga et al., 2002; Park et al., 2013; Shen et al., 2017; Sun, Qi, et al., 2016). There is a lack of in vivo studies, however, determining the effect of low doses of permethrin on glucose and lipid metabolism. Thus, the purpose of this study was to investigate the effect of permethrin exposure on the development of dietary fat-induced obesity and type 2 diabetes using a mouse model.
Material and methods
Materials
Permethrin (98%, mixture of 38.7% cis and 59.4% trans isomers) and high-density lipoprotein (HDL)/low-density lipoprotein (LDL) cholesterol quantitation kits were purchased from Sigma Aldrich Co. (St. Louis, MO). Insulin (human recombinant) was acquired from Novo Nordisk Inc. (Princeton, NJ). D-Glucose solution (50%) was obtained from Hospira Inc. (Lake Forest, IL). Glucose, cholesterol and triglyceride kits were from Thermo Fisher Scientific (Rockford, IL). Insulin ELISA kit was purchased from Mercodia (Winston Salem, NC). Leptin ELISA kit was from R&D systems (Minneapolis, MN). Free fatty acid assay kit was purchased from Cell Biolabs Inc. (San Diego, CA). Pierce BCA protein assay kits (Thermo Fisher Scientific, Rockford, IL) was used for protein quantification. Rabbit anti-mouse antibodies of phosphorylated phosphoinositide-dependent kinase (pPDK), phosphorylated protein kinase B at threonine 308 (pAkt Thr308) and serine 473 (pAkt Ser473), Akt and glucose transporter 4 (GLUT4) were purchased from Cell Signaling Technology (Danvers, MA). Rabbit anti-mouse antibody of glyceraldehyde-3-phosphate dehydrogenase (GAPDH) was from Santa Cruz Biotechnology, Inc. (Santa Cruz, CA). Horseradish peroxidase-conjugated goat anti-rabbit secondary antibody was obtained from Cell Signaling Technology (Danvers, MA). All other chemicals were either purchased from Sigma Aldrich Co. (St. Louis, MO) or Fisher Scientific (Waltham, MA).
Animals and diet
All animal care and experimental procedures were approved by the Institutional Animal Care and Use Committee of the University of Massachusetts Amherst (protocol number 2013-0014). Female C57BL/6J mice were purchased from the Jackson Laboratory (Bar Harbor, ME) at three weeks of age and were housed at two mice per cage with a 12h light-dark cycle in a temperature and humidity controlled room. Semi-purified AIN-93-based diets from Harlan Laboratories (TD94048 for low fat and TD07518 for high fat diets, Madison, WI) in powdered form were used. The diet composition is shown in Table 1. Permethrin was dissolved in soybean oil and mixed with other ingredients in the diet. Diet and water were given to mice ad libitum throughout the experiment period except when fasting was conducted prior to glucose measurement. After a week of adaptation with the low fat diet (4 w/w % fat), all mice were given a baseline test for insulin tolerance in the second week of adaptation and a glucose tolerance test in the 3rd week of adaptation. Then, animals were randomly divided into two dietary groups: a low fat diet (4 w/w % fat) and a high fat diet group (20 w/w % fat). Within each dietary group, a control diet (no permethrin) and three different doses of permethrin-containing diet were given to mice for twelve weeks. Permethrin doses used in the current study were chosen based on the acceptable daily intake of permethrin, which is 50 μg/kg body weight (BW)/day, and the chronic no observed adverse effect level (NOAEL) of permethrin, which is 5000 μg/kg BW/day (CEPADP, 1987; WHO, 1990). Permethrin concentrations were 0.26, 2.6, and 26 μg/g in the low fat diet, and 0.36, 3.6, and 36 μg/g in the high fat diet to deliver 50, 500, and 5000 μg/kg BW/day. Since calorie densities are different between low and high fat diets, doses of permethrin were adjusted accordingly to achieve comparable permethrin doses delivered (Supplementary Figure 1). Body weight and food intake were measured weekly. Food intake was measured as the total food intake per cage. Estimated permethrin intake in low fat diet fed animals were 33 ± 1, 334 ± 2, and 3387 ± 93 μg/kg BW/day for 50, 500, and 5000 μg/kg BW/day, respectively. Estimated permethrin intake in high fat diet fed animals were 31 ± 2, 374 ± 11 and 3491 ± 100 μg/kg BW/day for 50, 500 and 5000 μg/kg BW/day, respectively. There were no significant differences in three permethrin doses delivered between low vs. high fat diets. At the end of the study, mice were fasted for four hours and sacrificed by CO2 asphyxiation. Blood was immediately collected by cardiac puncture and then sera were collected by centrifugation at 3,000 g for 20 mins at 4 °C. Internal organs (livers, heart, pancreas, kidneys, spleen, and white adipose tissues, including omental, retroperitoneal, and mesenteric) were weighed at sacrifice.
Table 1.
Composition of experimental diets
| Ingredient | Low fat diet | High fat diet |
|---|---|---|
| g/kg | ||
| Corn starch | 465.7 | 288.5 |
| Maltodextrin | 155 | 132 |
| Casein | 140 | 169.1 |
| Sucrose | 100 | 100 |
| Cellulose | 50 | 50 |
| Soybean oil | 40 | 200 |
| Mineral Mix, AIN-93M-MX (TD 94049) | 35 | 42.8 |
| Vitamin Mix, AIN-93-VX (TD 94047) | 10 | 12.4 |
| Choline bitartrate | 2.5 | 3 |
| L-Cystine | 1.8 | 2.2 |
| tert-Butylhydroquinone (TBHQ) | 0.008 | 0.04 |
| Total | 1000 | 1000 |
Permethrin concentrations in low fat diet were 0.26, 2.6, & 26 microgram per gram of diet to deliver 50, 500, & 5000 μg/kg BW/day. These concentrations were calculated based on estimated food intake for low fat diet is 4 g/mouse/day. Permethrin concentrations in high fat diet were 0.36, 3.6, & 36 μg per gram of diet to deliver 50, 500, & 5000 μg/kg BW/day based on estimated food intake 3 g/mouse/day.
Determination of glucose homeostasis
Insulin tolerance test (ITT) was conducted three times during the experiment (adaptation period, weeks 4 and 10). Animals were fasted for four hours before the test and tail-vein blood samples were obtained at 0, 15, 30, 60, and 120 min after intraperitoneal injection of insulin (0.75U/kg BW). Intraperitoneal glucose tolerance tests (GTT) were conducted in the adaptation period, at weeks 5 and 11. Mice were fasted for 6 hours prior to the test. A bolus of glucose solution (2 g/kg BW) was injected into the intraperitoneal cavity, and blood was obtained from the tail end to measure glucose level at 0, 15, 30, 60, and 120 min. All blood glucose levels were tested using a glucometer with test strips (Advocate, Pharma Supply Inc, Wellington, FL). The areas under the curve (AUC) were calculated using SigmaPlot 11.0 (Systat Software, Inc., San Jose, CA). Blood samples at 0, 30, 60, and 120 min were also used to determine insulin level based on a method described previously (Christensen et al., 2009). HOMA-IR was calculated using the HOMA2 calculator (Wallace et al., 2004).
Voluntary movement measurement (non-exercise physical activity test)
Voluntary movement (non-exercise physical activity) was measured in weeks 1 and 8 by using a method described previously (J. H. Kim et al., 2013; Y. Kim et al., 2015). Briefly, an individual mouse was put into a clear cage during the dark cycle (6:00 pm to 6:00 am). Diet and water (HydroGel, Portland, ME, USA) were provided ad libitum to mice during the measurements. Total travel distance (m) was recorded by an infrared camera with LoliTrack Quatro Video Tracking Software Version 1.0 (Loligo Systems, Tjele, Denmark). Data from early phase (6:00 pm to 8:00 pm, due to hyperactivity in adaptation to new environment) and late phase (4:00 am to 6:00 am, due to sedentary behavior) were excluded. Movement data as determined as the total travel distance (m) from 8:00 pm to 4:00 am were used for analysis. Change of travel distance (m) was calculated as the difference of travel distance found in week 8 versus week 1 of individual mice.
Western blot analysis
Immunoblots were conducted based on a method described previously (Y. Kim et al., 2015). Briefly, gastrocnemius skeletal muscle was frozen in liquid nitrogen and ground using a pestle and mortar. Sample was lysed using a radioimmunoprecipitation assay buffer containing protease and phosphatase inhibitor cocktail (Thermo Fisher Scientific, Rockford, IL). Sample lysates were centrifuged at 12,000g for 20 min at 4°C. Protein concentration was determined using the Pierce BCA protein assay kit (Thermo Fisher Scientific, Rockford, IL). Samples were then separated by sodium dodecyl sulfate–polyacrylamide gel electrophoresis and transferred to polyvinylidene fluoride membranes (Millipore, Bedford, MA). Visualization was achieved with an Image Station 4000MM Kodak Instrument (Carestream Health, New Heaven, CT) by using Clarity ECL Western blot substrate (Bio-Rad, Hercules, CA) after incubation with primary and horseradish peroxidase-conjugated secondary antibodies. The secondary antibody reaction was terminated before reaching the saturation point (5 min after incubation) to ensure the linear response of band intensity development. The protein band intensities were analyzed using ImageJ software (version 1.48, U.S. National Institutes of Health), normalized to that of GAPDH and used for protein quantification.
Statistical analysis
Data were analyzed by PROC MIXED using the SAS software (Version 9.3, SAS Institute Inc., Cary, NC, USA). Data of body weights (Fig. 1) and changes of travel distance (Fig. 2) were analyzed by two-way repeated measure Analysis of Variance (ANOVA) and the slice option in the Least Square (LS) means statement. All the other results were analyzed by two-way ANOVA with LS means statement. The Tukey-Kramer’s method was used for multiple comparisons among the experimental groups. Letters were used to present differences between each experimental group if there were significant interactions between the diet and permethrin. P-values less than 0.05 were reported as statistically significant.
Figure 1.
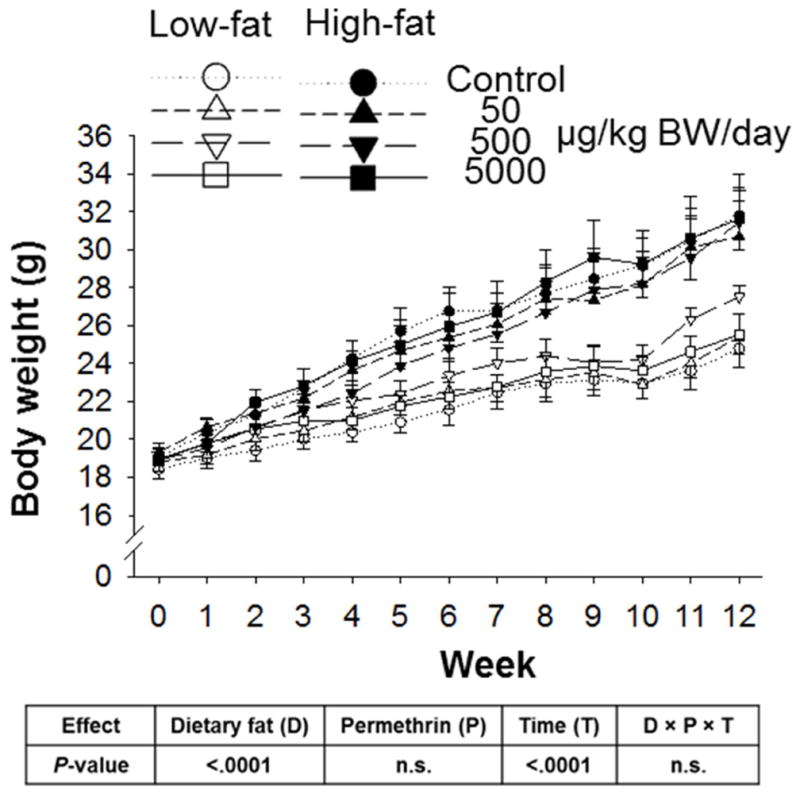
Effects of permethrin treatment on body weight in female C57BL/6J mice. Low fat or high fat diets, without or with permethrin [50, 500, or 5000 μg/kg body weight (BW)/day] were given to mice ad libitum for 12 weeks. Open symbols, low fat diet-fed mice; Filled symbols, high fat diet-fed mice: Circles, control; Up-triangles, 50 μg/kg BW/day; Down-triangles 500 μg/kg BW/day; and Squares, 5000 μg/kg BW/day. Values represent means ± S.E. (n= 5–6).
Figure 2.

Effects of permethrin on voluntary movements (non-exercise physical activity test) in female C57BL/6J mice. Low fat or high fat diets, without or with permethrin [50, 500, or 5000 μg/kg body weight (BW)/day] were given to mice ad libitum for 12 weeks. Voluntary movement was measured in week 1 (A) and week 8 (B) from 8:00 pm to 4:00 am. Travel distance change (C) was calculated based on the difference of travel distance in week 8 and week 1 of individual mice. Diet and water (HydroGel, Portland, ME, USA) were provided ad libitum to mice during the measurement. Total travel distances (m) were recorded by an infrared camera with LoliTrack Quatro Video Tracking Software Version 1.0 (Loligo Systems, Tjele, Denmark). Values represents means ±S.E. (n=5–6).
Result
Effects of permethrin on body weight, energy intake, and organ weights
Results of body weight and food intake as the total energy intake are shown in Fig. 1 and supplementary Fig. 1, respectively. There was a significant dietary fat effect on body weight; high fat diet-fed mice gained around 2-fold more body weight than low fat diet-fed mice (13.00 ± 3.27g for high fat vs 7.16 ± 1.61 g for low fat, P<0.0001). However, no significant permethrin and interaction effect (dietary fat × permethrin × time) was observed on weight. There was no significant difference in energy intake between high fat and low fat groups; 42.48–45.11 KJ/mouse/day in low fat vs. 42.39–44.74 KJ/mouse/day in high fat diet-fed animals (supplementary Fig. 1). There was no effect of permethrin treatment on energy intake.
Dietary fat significantly decreased the weight (as % body weight) of liver, heart, spleen, and kidney, but not pancreas (Table 2). However, no significant effects of permethrin or interaction effect were observed on any of the organ weights. Mice fed high fat diet showed significantly greater adipose tissue weight than low fat diet counterparts (80% increase over low fat groups, P<0.0001 for all), while no permethrin or interaction effects were observed for any of the adipose tissue weights.
Table 2.
Weights of organs from female mice
| Low fat diet | High fat diet | P-value | |||||||||
|---|---|---|---|---|---|---|---|---|---|---|---|
|
|
|
||||||||||
| Permethrin doses (μg/kg BW/day) | Permethrin doses (μg/kg BW/day) | ||||||||||
|
|
|
|
|||||||||
| Control | 50 | 500 | 5000 | Control | 50 | 500 | 5000 | Dietary fat | Permethrin | Interaction | |
| % of Body weight | |||||||||||
| Liver | 4.15±0.19 | 4.18±0.08 | 3.84±0.16 | 4.05±0.10 | 3.42±0.23 | 3.44±0.22 | 3.63±0.13 | 3.62±0.07 | < .0001 | n.s. | n.s. |
| Heart | 0.45±0.01 | 0.49±0.02 | 0.43±0.04 | 0.48±0.04 | 0.34±0.08 | 0.38±0.01 | 0.40±0.03 | 0.32±0.06 | 0.0010 | n.s. | n.s. |
| Spleen | 0.38±0.02 | 0.34±0.02 | 0.34±0.02 | 0.35±0.01 | 0.31±0.01 | 0.39±0.06 | 0.32±0.02 | 0.32±0.01 | 0.0002 | n.s. | n.s. |
| Kidney | 1.07±0.01 | 1.10±0.05 | 0.99±0.04 | 1.12±0.08 | 0.92±0.05 | 0.97±0.04 | 0.95±0.02 | 0.91±0.03 | 0.0002 | n.s. | n.s. |
| Pancreas | 0.55±0.04 | 0.51±0.02 | 0.41±0.02 | 0.55±0.07 | 0.60±0.09 | 0.56±0.05 | 0.50±0.05 | 0.52±0.04 | n.s. | n.s. | n.s. |
| Adipose tissue | |||||||||||
| Omental | 2.20±0.29 | 2.63±0.20 | 3.18±0.21 | 2.43±0.31 | 4.62±0.51 | 4.36±0.43 | 4.59±0.43 | 4.65±0.42 | <.0001 | n.s. | n.s. |
| Subcutaneous | 2.00±0.25 | 2.49±0.1 | 3.34±0.17 | 2.64±0.41 | 5.55±0.72 | 4.87±0.58 | 5.37±0.66 | 5.31±0.45 | <.0001 | n.s. | n.s. |
| Retroperitoneal | 0.46±0.07 | 0.57±0.07 | 0.67±0.08 | 0.55±0.11 | 1.09±0.15 | 1.10±0.06 | 1.21±0.11 | 1.16±0.12 | <.0001 | n.s. | n.s. |
| Mesenteric | 1.09±0.10 | 1.43±0.13 | 1.49±0.17 | 1.13±0.12 | 1.99±0.31 | 1.94±0.25 | 2.09±0.09 | 2.06±0.26 | <.0001 | n.s. | n.s. |
| Total | 5.75±0.65 | 7.12±0.53 | 8.68±0.52 | 6.75±0.94 | 13.25±1.65 | 12.26±1.26 | 13.25±1.17 | 13.18±1.17 | <.0001 | n.s. | n.s. |
Values represent means ± S.E. (n=5–6). Abbreviations: n.s., not significant.
Permethrin treatment decreased voluntary movement (non-exercise physical activity)
Results of voluntary movements in week 1 and week 8 are shown in Fig. 2A & 2B, respectively. In week 1, there was a significant effect of dietary fat on voluntary activities (P < 0.0001). High fat diet-fed mice showed significantly decreased (~45%) voluntary activities compared to the low fat diet-fed mice. There was no permethrin effect or interaction effect in week 1. In week 8, there was a significant effect of dietary fat (P<0.0001) and permethrin treatment (P=0.0158). High fat diet-fed mice showed significantly decreased voluntary activities compared to the low fat diet-fed mice (~45% decrease over low fat groups). Permethrin treatments significantly decreased voluntary activities compared to the controls (~16% decrease over controls). When changes of travel distances of individual mice between week 8 and week 1 were calculated (Fig. 2C), there was a significant effect of dietary fat (P<0.0001), permethrin (P=0.0377), and time (P=0.0004). High fat diet and permethrin treatments significantly decreased voluntary activities than low fat diet-fed mice and controls, respectively (Changes of travel distance as meter were -36.5±30 in low fat diet groups vs. −100.3±28.2 in high fat diet groups; 37.5±46.9 in control groups vs. −96.7±19.3 in permethrin treatment groups). Time was also an important factor in terms of change of travel distances; voluntary activities measured in week 8 were significantly less than week 1 (538.3±25.8m in week 1 vs. 467.4±30.4m in week 8). No significant interaction effect (dietary fat × permethrin × time) was observed on travel distance change.
Effects of permethrin on serum markers of glucose and lipid metabolism
Results of serum analyses are shown in Table 3. The high fat diet significantly increased insulin (60%), leptin (180%), cholesterol (10%) and high-density lipoprotein cholesterol (20%) levels compared to those of the low fat diet-fed animals, but failed to show any effects on glucose, free fatty acids, triglycerides, and low-density lipoprotein cholesterol levels. Permethrin treatment significantly increased blood insulin (~20%, P=0.0106) and glucose levels (~15%, P=0.0075) compared to the controls, but no effect was observed on leptin, free fatty acids, triglycerides, cholesterol, high-density lipoprotein, and low-density lipoprotein cholesterol levels. There were no significant interactions between diet and permethrin on any of the serum markers tested except for insulin. Permethrin treatment at 5000 μg/kg BW/day significantly increased the insulin level compared to the control in high fat dietary groups (90%), but not in low fat dietary groups.
Table 3.
Effects of permethrin on serum parameters
| Low fat diet | High fat diet | P-value | |||||||||
|---|---|---|---|---|---|---|---|---|---|---|---|
|
|
|
||||||||||
| Permethrin doses (μg/kg BW/day) | Permethrin doses (μg/kg BW/day) | ||||||||||
|
|
|
|
|||||||||
| Control | 50 | 500 | 5000 | Control | 50 | 500 | 5000 | Dietary fat | Permethrin | Interaction | |
| Insulin (ng/mL) | 1.27±0.22b | 1.06±0.11b | 1.27±0.15b | 1.11±0.09b | 1.47±0.11b | 1.21±0.10b | 2.04±0.34ab | 2.80±0.47a | 0.0002 | 0.0106 | 0.01 |
| Glucose (mg/dL) | 167.0±9.4 | 197.0±12.1 | 225.6±14.5 | 176.6±16.2 | 170.8±14.4 | 151.4±12.5 | 198.0±7.3 | 196.1±13.7 | n.s. | 0.0075 | n.s. |
| Leptin (ng/mL) | 14.60±3.83 | 18.80±4.35 | 17.85±5.39 | 15.24±6.86 | 48.80±8.66 | 36.29±7.58 | 57.53±9.62 | 48.83±9.45 | <0.0001 | n.s. | n.s. |
| FFA (mEq/mL) | 844±166 | 916±64 | 1051±170 | 904±160 | 935±146 | 853±335 | 973±115 | 590±188 | n.s. | n.s. | n.s. |
| TG (mmol/L) | 0.43±0.07 | 0.49±0.10 | 0.67±0.06 | 0.43±0.12 | 0.43±0.05 | 0.42±0.11 | 0.42±0.07 | 0.38±0.06 | n.s. | n.s. | n.s. |
| Cholesterol (mg/dL) | 126±5 | 155±11 | 155±10 | 149±19 | 151±8 | 162±8 | 163±8 | 173±6 | 0.0234 | n.s. | n.s. |
| HDL-C (mg/dL) | 109±4 | 117±10 | 113±8 | 116±3 | 115±12 | 129±7 | 132±9 | 145±8 | 0.0064 | n.s. | n.s. |
| LDL-C (mg/dL) | 26±2 | 26±4 | 27±3 | 29±7 | 28±4 | 26±2 | 28±4 | 19±2 | n.s. | n.s. | n.s. |
Values represent means ± S.E. (n=5–6). Means with different superscripts within the same row are significantly different at p < 0.05. Abbreviations: n.s., not significant; FFA, free fatty acids; HDL-C, high-density lipoprotein cholesterol; LDL-C, low-density lipoprotein cholesterol; TG, triglycerides.
Effects of permethrin on glucose homeostasis
To measure the effects of permethrin on glucose homeostasis, insulin tolerance tests (ITT), glucose tolerance tests (GTT) with insulin measurement, and HOMA-IR calculations were conducted. There were no significant effects of dietary fat or permethrin on insulin responsiveness measured by ITT, GTT, insulin levels, or HOMA-IR during adaptation period (Fig. 3A, 3D, 3G, & 4A, and Suppl. Fig. 2A, 3A, & 4A). In weeks 4 & 10, high fat diet-fed animals showed significantly increased insulin resistance compared to low fat diet-fed animals as demonstrated by ITT test (~20% increase of AUC in high fat groups with P<0.0001 for both weeks 4 & 10, Fig. 3B & 3C and Suppl. Fig. 2B & 2C). Permethrin treatments significantly increased insulin resistance compared to the controls as demonstrated by ITT in week 10 (~10% increase by permethrin, P=0.0473, Fig. 3C). However, no significant interaction between dietary fat and permethrin was found in weeks 4 & 10.
Figure 3.

Effects of permethrin treatments on insulin responsiveness in female C57BL/6J mice. Low fat or high fat diets, without or with permethrin [50, 500, or 5000 μg/kg body weight (BW)/day] were given to mice ad libitum for 12 weeks. Insulin tolerance test (ITT, Figure 3A–C), glucose tolerance test (GTT, Figure 3D–F), and insulin level during GTT (Figure 3G–I). Values represent means ± S.E. (n= 4–6). Means with different letters are significantly different (P<0.05).
Figure 4.

Effects of permethrin on homeostasis model assessment-insulin resistance (HOMA-IR) score in female C57BL/6J mice. Low fat or high fat diets, without or with permethrin [50, 500, or 5000 μg/kg body weight (BW)/day] were given to mice ad libitum for 12 weeks. HOMA-IR score was calculated during adaptation period, weeks 6, 11, and 12 with HOMA-IR calculator. Values represent means ± S.E. (n= 4–6). Means with different letters are significantly different (P<0.05).
In weeks 5 & 11, there was a significant effect of dietary fat (P=0.0008 for week 5 and P<0.0001 for week 11) on GTT results (Fig. 3E & 3F and Suppl. Fig. 3B & 3C). Permethrin significantly increased glucose intolerance compared to the controls in week 11 (~20% increase over controls, P=0.0369). In particular, permethrin treatments at 5000 μg/kg BW/day significantly increased glucose intolerance compared to the controls (~20% increase, P=0.0383). However, no significant interaction was found.
For insulin levels during the GTT, there was a significant effect of dietary fat on increasing blood insulin in weeks 5 & 11 (50 % and 100% increase over low fat diet groups for weeks 5 and 11, respectively, P<0.0001 for both, Fig. 3H & 3I and Suppl. Fig. 4B & 4C). There was a significant effect of permethrin on increasing blood insulin level (50% compared to controls, P=0.0271) and interaction effect (P=0.0344) in week 11 only (Fig. 3I). In the high fat diet, permethrin treatment at 5000 μg/kg BW/day significantly increased insulin level compared to the high fat diet control (~100% increase, P=0.0056). However, no significant effect of permethrin was observed in the low fat dietary groups on insulin level during the GTT.
To evaluate overall influence of permethrin on glucose homeostasis, we calculated HOMA-IR (Fig. 4). There was a significant effect of dietary fat on increasing HOMA-IR in weeks 5, 11, and 12 (30%, 80%, and 50% increase over low fat groups, P=0.0096, 0.0003, and 0.0015, respectively). There was a significant effect of permethrin on increasing HOMR-IR (20% increase over controls, P=0.0116) with interaction (P=0.0268) in week 12 only. Permethrin treatment at 5000 μg/kg BW/day significantly increased insulin resistance in high fat dietary group compared to the high fat control (P=0.0138), without any effect on low fat dietary groups.
Permethrin significantly decreased the activation of AKT in skeletal muscle
Skeletal muscle plays a major role in glucose uptake and account for up to 75% of insulin-dependent glucose uptake (Saltiel et al., 2001). In this study, we measured several key regulators in the insulin-stimulated glucose uptake pathway, including Akt, phosphoinositide-dependent kinase (PDK1), and GLUT4 in the gastrocnemius muscle. Our results showed that permethrin and dietary treatment showed no significant difference in the protein level of Akt and pAkt Ser473 as well as the pAktSer473 to Akt ratio (Fig. 5B, C&E). However, permethrin treatments significantly decreased the pAkt Thr308 (P=0.0386, Fig. 5A) and the pAkt Thr308 to Akt ratio compared to the controls (P=0.0176, Fig. 5D). Phosphorylated PDK1 (pPDK1) is one of the upstream regulators of Akt. Dietary fat showed no significant effect on pPDK1 level (Fig. 5F). Permethrin treatments had a significant effect of decreasing pPDK1 compared to the controls (~20%, Fig. 5F, P=0.0245) with a significant interaction (P=0.0122, Fig. 5F). Permethrin treatment at 5000 μg/kg significantly decreased pPDK1 in high fat diet group compared to the high fat control (~50%, P=0.0242). GLUT4 is the major glucose transporter in the skeletal muscle, which plays a significant role in mediating whole body glucose homeostasis (Huang et al., 2007). Permethrin treatments significantly decreased GLUT4 protein levels compared with the controls in the muscle (P=0.0078, Fig. 5G). However, no dietary effect or interaction effect was observed. Taken together, these results showed that permethrin may target the Akt signaling pathway to induce insulin resistance.
Figure 5.

Effects of permethrin treatments on molecular targets involved in Akt signaling pathway in gastrocnemius skeletal muscle of female C57BL/6J mice. Low fat or high fat diets, without or with permethrin [50, 500, or 5000 μg/kg body weight (BW)/day] were given to mice ad libitum for 12 weeks. (A) Protein levels of phosphorylated Akt (pAkt) Thr308; (B) pAkt Ser473; (C) Akt; (D) pAkt Thr308 to Akt ratio; (E) pAkt Ser473 to Akt ratio; (F) phosphorylated phosphoinositide-dependent kinase-1 (PDK1); and (G) Glucose transporter 4 (GLUT4). Values represent means ± S.E. (n= 4–6). Means with different letters are significantly different (P<0.05).
Discussion
This research is the first report investigating the potential link between permethrin exposure along with the interaction to dietary fat on the development of obesity and type 2 diabetes in female mice. The current results show that the daily administration of permethrin potentiated a high fat diet-induced insulin resistance without the significant induction of weight gain in female C57BL/6J mice. It is important to point out that permethrin doses used in the current study are relatively low (at or lower than NOAEL). Given the above, the current study is significant in that low-dose exposures, which are considered ‘safe’, may have significant implications in the metabolism of animals and potentially in humans when there are additional factors present, such as their diet or exposures to environmental contaminants.
Currently, it is not clear how permethrin worsened the high fat diet-induced insulin resistance in this model. When orally ingested, permethrin is quickly absorbed into the blood, distributed and subject to hydrolysis and degradation by esterase and cytochrome P450-dependent monooxygenase in the liver with an elimination half-life of approximately 12 h (Anadon et al., 1991; Gaughan et al., 1977; Soderlund et al., 2002). However, the elimination half-life of permethrin in adipose tissue is significantly longer, 5–56 h, compared to the liver, brain, and blood (Tornero-Velez et al., 2012). The actual doses of permethrin consumed in the current study were similar in both the low and high fat diets, thus we do not think the different effects of permethrin on insulin resistance in the low vs. high fat diets were due to a difference in doses of permethrin delivered. It is possible, nonetheless, that due to the highly lipophilic characteristics of permethrin, absorption and bioaccumulation may be more efficient with a high fat diet when compared with that of a low fat diet. In fact, it has been previously reported in acute oral toxicity studies that permethrin was much more toxic when dissolved in oil than in other vehicles or in its undiluted form (Soderlund et al., 2002).
The current results showed that there was a significant effect of permethrin on decreasing voluntary activities of mice (P=0.0069). It is known that pyrethroids can target neurons and influence physical activities in arthropods as well as mammals (Baatrup et al., 1993; Crofton et al., 1988; Frank et al., 2000; Nieradko-Iwanicka et al., 2015). It was previously shown that daily intraperitoneal injection of deltamethrin, at doses higher than we used in the current report (8.3–41.5 mg/kg body weights for 1–28 days), significantly decreased locomotive activity in female mice (Nieradko-Iwanicka et al., 2015). Because of its lipophilic nature, permethrin was found to accumulate in the nervous system at 1.5~7.5 times higher levels than in plasma after oral administration (Anadon et al., 1991). Based on these reports, we infer that permethrin likely accumulated in the nervous system where it exerted its neurotoxic effects, resulting in decreased voluntary activities. In addition, increased physical activity is known to improve insulin sensitivity (Borghouts et al., 2000; Mayer-Davis et al., 1998). Thus, it is possible that decreased activity caused by permethrin may have potentially contributed to its role on insulin insensitivity.
The development of insulin resistance is a major symptom for type 2 diabetes and Akt plays central role in the transmission of insulin signaling (Saltiel et al., 2001). Akt can be phosphorylated by PDK1 at Thr308 and by mTORC2 at Ser473 (Alessi et al., 1996; Jacinto et al., 2006; J. Kim et al., 2014; Sarbassov et al., 2005). Phosphorylation of both Thr308 and Ser 473 are required for Akt activation and the phosphorylation of Ser473 is not dependent upon the phosphorylation of Thr308 or vice versa (Alessi et al., 1996). Activated Akt increases the translocation of glucose transporter 4 (GLUT4) from the cytoplasm to the plasma membrane to facilitate glucose uptake (Saltiel et al., 2001). Thus, the role of Akt in insulin-stimulated glucose uptake is essential. Our results showed that permethrin impaired Akt activation by influencing Akt phosphorylation at Thr308, but not Ser473, in the gastrocnemius skeletal muscle. In support of this finding, it was previously reported that permethrin significantly reduced insulin-stimulated glucose uptake in C2C12 muscle cells by decreasing pAkt Thr308 via PDK1, but not Ser473 (J. Kim et al., 2014). These consistent findings indicated that permethrin may target PDK1 or upstream regulators of PDK1 to impair glucose uptake (J. Kim et al., 2014). Since we did not inject insulin before sacrificing the mice used in the current study to mimic the insulin-stimulating state, it is not possible to directly compare our current findings to those obtained in cell culture. Because of this, we can only speculate that permethrin can decrease pAKT Thr308 via PDK1 in female mice. Alternatively, it is known that insecticide induce oxidative stress, which may cause inflammatory responses that can subsequently result in disturbance in glucose metabolism (Abdollahi et al., 2004; Bagchi et al., 1995; Begum et al., 2011; Kalender et al., 2005; Sara Mostafalou et al., 2012; Mostafalou et al., 2013; S. Mostafalou et al., 2012; Slaninova et al., 2009; Soltaninejad et al., 2009; Teimouri et al., 2006; Yang et al., 1996). As permethrin was reported to cause oxidative stress and inflammation in a variety of cell types and organisms (Hossain et al., 2017; Neta et al., 2011; X. Wang et al., 2016), it is possible that permethrin caused insulin resistance in part via upregulation of oxidative stress and inflammation.
Links between exposures to organochlorine and organophosphorus insecticides and increased risk of the development of type 2 diabetes in both humans and animals have been reported previously (Amanvermez et al., 2010; Cox et al., 2007; Everett et al., 2010; J. Kim et al., 2013; Lee et al., 2006; Lee et al., 2007; Rignell-Hydbom et al., 2007; Ukropec et al., 2010). In addition, pyrethroid insecticides (allethrin, cismethrin, deltamethrin and prallethrin) were previously shown to disturb glucose homeostasis and potentially increase the risk of diabetes in human and animals (Cremer et al., 1982; Hansen et al., 2014; Narendra et al., 2008; Ray et al., 1979; Veerappan et al., 2012; J. Wang et al., 2011; Yousef et al., 2006). Two type I pyrethroids (allethrin and prallethrin) were previously reported to increase blood glucose levels in human male subjects (Narendra et al., 2008). Another study reported male pesticide sprayers exposed to pyrethroid mixture have a higher prevalence of developing prediabetes (Hansen et al., 2014). Similarly, Wang et al. (2011) reported an increased risk of diabetes among pyrethroid pesticide factory workers. Consistently, animal studies have reported a link between exposure to pyrethroids and the disturbance of glucose homeostasis: single dose exposure to decamethrin (deltamethrin) via intraperitoneal injection at 40 mg/kg BW was shown to increase blood glucose level in female rats (Ray et al., 1979); single dose exposure to deltamethrin (1.5 & 2.6 mg/kg BW) via intravenous injection was reported to increase blood glucose level in male rats (Cremer et al., 1982); daily oral exposure to deltamethrin at 1.28 mg/kg BW/day for 28 days was reported to increase blood glucose level in male rats (Yousef et al., 2006); and a single subcutaneous dose of a-cypermethrin at 0.06, 0.3, & 0.6 mg/kg BW elevated blood glucose in male rats (Veerappan et al., 2012). In addition, our group recently reported that daily oral administration of low-dose imidacloprid, a neonicotinoid insecticide, (at or lower than NOAEL) promoted the high fat diet-induced adiposity and insulin resistance in male mice (Sun, Xiao, et al., 2016). Although the majority of the studies conducted in humans and animals supported that exposure to the major classes of insecticides (organochlorines, organophosphates, pyrethroids, and neonicotinoids) disturbed glucose and lipid metabolism, the exact mechanism leading to this disruptions is not known and likely perplexed by other factors, such as dietary fat, sex, and the treatment duration of the study (Lassiter et al., 2008; Mugford et al., 1998; Slotkin et al., 2005).
In conclusion, the current results suggest that dietary low-dose exposure to permethrin can induce the high fat diet-induced insulin resistance without any influence on weight gain in female mice. Further mechanistic studies are needed to investigate the effects of permethrin, along with a high fat diet, on glucose and lipid metabolic pathways in male mice.
Supplementary Material
Permethrin promoted high fat diet-induced insulin resistance in female mice
Permethrin did not alter high fat diet-induced weight gain in female mice
Permethrin decreased voluntary activities in female mice
Permethrin caused insulin resistance via Akt in the skeletal muscle
Acknowledgments
This project is supported by NIH R21ES023676.
Footnotes
Publisher's Disclaimer: This is a PDF file of an unedited manuscript that has been accepted for publication. As a service to our customers we are providing this early version of the manuscript. The manuscript will undergo copyediting, typesetting, and review of the resulting proof before it is published in its final citable form. Please note that during the production process errors may be discovered which could affect the content, and all legal disclaimers that apply to the journal pertain.
References
- Abdollahi M, Mostafalou S, Pournourmohammadi S, Shadnia S. Oxidative stress and cholinesterase inhibition in saliva and plasma of rats following subchronic exposure to malathion. Comp Biochem Physiol C Toxicol Pharmacol. 2004;137(1):29–34. doi: 10.1016/j.cca.2003.11.002. [DOI] [PubMed] [Google Scholar]
- Alessi DR, Andjelkovic M, Caudwell B, Cron P, Morrice N, Cohen P, Hemmings BA. Mechanism of activation of protein kinase B by insulin and IGF-1. EMBO J. 1996;15(23):6541–6551. [PMC free article] [PubMed] [Google Scholar]
- Amanvermez R, Baydin A, Yardan T, Basol N, Gunay M. Emergency laboratory abnormalities in suicidal patients with acute organophosphate poisoning. Turk J Biochem. 2010;35(1):29–34. [Google Scholar]
- Anadon A, Martinez-Larranaga MR, Diaz MJ, Bringas P. Toxicokinetics of permethrin in the rat. Toxicol Appl Pharmacol. 1991;110(1):1–8. doi: 10.1016/0041-008x(91)90284-l. [DOI] [PubMed] [Google Scholar]
- Baatrup E, Bayley M. Effects of the pyrethroid insecticide Cypermethrin on the locomotor activity of the wolf spider Pardosa amentata: quantitative analysis employing computer-automated video tracking. Ecotoxicol Environ Saf. 1993;26(2):138–152. doi: 10.1006/eesa.1993.1046. [DOI] [PubMed] [Google Scholar]
- Bagchi D, Bagchi M, Hassoun EA, Stohs SJ. In vitro and in vivo generation of reactive oxygen species, DNA damage and lactate dehydrogenase leakage by selected pesticides. Toxicology. 1995;104(1–3):129–140. doi: 10.1016/0300-483x(95)03156-a. [DOI] [PubMed] [Google Scholar]
- Begum K, Rajini PS. Augmentation of hepatic and renal oxidative stress and disrupted glucose homeostasis by monocrotophos in streptozotocin-induced diabetic rats. Chem-Biol Interact. 2011;193(3):240–245. doi: 10.1016/j.cbi.2011.07.003. [DOI] [PubMed] [Google Scholar]
- Borghouts LB, Keizer HA. Exercise and insulin sensitivity: a review. Int J Sports Med. 2000;21(1):1–12. doi: 10.1055/s-2000-8847. [DOI] [PubMed] [Google Scholar]
- Casida JE, Durkin KA. Neuroactive insecticides: targets, selectivity, resistance, and secondary effects. Annu Rev Entomol. 2013;58:99–117. doi: 10.1146/annurev-ento-120811-153645. [DOI] [PubMed] [Google Scholar]
- CEPADP. California enviromental protection agency department of pesticide regulation medical toxicology branch summary of toxicology data pyrethrins 1987 [Google Scholar]
- Christensen SD, Mikkelsen LF, Fels JJ, Bodvarsdottir TB, Hansen AK. Quality of plasma sampled by different methods for multiple blood sampling in mice. Lab Anim. 2009;43(1):65–71. doi: 10.1258/la.2008.007075. [DOI] [PubMed] [Google Scholar]
- Cox S, Niskar AS, Narayan KMV, Marcus M. Prevalence of self-reported diabetes and exposure to organochlorine pesticides among Mexican Americans: Hispanic Health and Nutrition Examination Survey, 1982–1984. Environ Health Perspect. 2007;115(12):1747–1752. doi: 10.1289/ehp.10258. [DOI] [PMC free article] [PubMed] [Google Scholar]
- Cremer JE, Seville MP. Comparative effects of two pyrethroids, deltamethrin and cismethrin, on plasma catecholamines and on blood glucose and lactate. Toxicol Appl Pharmacol. 1982;66(1):124–133. doi: 10.1016/0041-008x(82)90067-9. [DOI] [PubMed] [Google Scholar]
- Crofton KM, Reiter LW. The effects of type I and II pyrethroids on motor activity and the acoustic startle response in the rat. Fundam Appl Toxicol. 1988;10(4):624–634. doi: 10.1016/0272-0590(88)90189-3. [DOI] [PubMed] [Google Scholar]
- Elliott M, Farnham AW, Janes NF, Needham PH, Pulman DA, Stevenson JH. A photostable pyrethroid. Nature. 1973;246(5429):169–170. doi: 10.1038/246169a0. [DOI] [PubMed] [Google Scholar]
- Everett CJ, Matheson EM. Biomarkers of pesticide exposure and diabetes in the 1999–2004 national health and nutrition examination survey. Environ Int. 2010;36(4):398–401. doi: 10.1016/j.envint.2010.02.010. [DOI] [PubMed] [Google Scholar]
- Frank JP, Kellner TP. Deltamethrin Risk Characterization Document. 2000:1. [Google Scholar]
- Gaughan LC, Unai T, Casida JE. Permethrin Metabolism in Rats. Journal of Agricultural and Food Chemistry. 1977;25(1):9–17. doi: 10.1021/jf60209a005. [DOI] [PubMed] [Google Scholar]
- Hansen MR, Jors E, Lander F, Condarco G, Schlunssen V. Is cumulated pyrethroid exposure associated with prediabetes? A cross-sectional study. J Agromedicine. 2014;19(4):417–426. doi: 10.1080/1059924X.2014.945708. [DOI] [PMC free article] [PubMed] [Google Scholar]
- Hossain MM, Liu J, Richardson JR. Pyrethroid Insecticides Directly Activate Microglia Through Interaction With Voltage-Gated Sodium Channels. Toxicol Sci. 2017;155(1):112–123. doi: 10.1093/toxsci/kfw187. [DOI] [PMC free article] [PubMed] [Google Scholar]
- Howell GIII, Mangum L. Exposure to bioaccumulative organochlorine compounds alters adipogenesis, fatty acid uptake, and adipokine production in NIH3T3-L1 cells. Toxicol In Vitro. 2011;25(1):394–402. doi: 10.1016/j.tiv.2010.10.015. [DOI] [PMC free article] [PubMed] [Google Scholar]
- Huang S, Czech MP. The GLUT4 glucose transporter. Cell Metab. 2007;5(4):237–252. doi: 10.1016/j.cmet.2007.03.006. [DOI] [PubMed] [Google Scholar]
- Jacinto E, Facchinetti V, Liu D, Soto N, Wei S, Jung SY, Huang Q, Qin J, Su B. SIN1/MIP1 maintains rictor-mTOR complex integrity and regulates Akt phosphorylation and substrate specificity. Cell. 2006;127(1):125–137. doi: 10.1016/j.cell.2006.08.033. [DOI] [PubMed] [Google Scholar]
- Kalender S, Ogutcu A, Uzunhisarcili M, Acikgoz F, Durak D, Ulusoy Y, Kalender Y. Diazinon-induced hepatotoxicity and protective effect of vitamin E on some biochemical indices and ultrastructural changes. Toxicology. 2005;211(3):197–206. doi: 10.1016/j.tox.2005.03.007. [DOI] [PubMed] [Google Scholar]
- Kim J, Park Y, Yoon KS, Clark JM, Park Y. Imidacloprid, a neonicotinoid insecticide, induces insulin resistance. J Toxicol Sci. 2013;38(5):655–660. doi: 10.2131/jts.38.655. [DOI] [PubMed] [Google Scholar]
- Kim J, Park Y, Yoon KS, Clark JM, Park Y. Permethrin alters adipogenesis in 3T3-L1 adipocytes and causes insulin resistance in C2C12 myotubes. J Biochem Mol Toxicol. 2014;28(9):418–424. doi: 10.1002/jbt.21580. [DOI] [PubMed] [Google Scholar]
- Kim JH, Park Y, Kim D, Good DJ, Park Y. Dietary conjugated nonadecadienoic acid prevents adult-onset obesity in nescient basic helix-loop-helix 2 knockout mice. J Nutr Biochem. 2013;24(3):556–566. doi: 10.1016/j.jnutbio.2012.02.005. [DOI] [PubMed] [Google Scholar]
- Kim Y, Kim D, Good DJ, Park Y. Effects of postweaning administration of conjugated linoleic acid on development of obesity in nescient basic helix-loop-helix 2 knockout mice. J Agric Food Chem. 2015;63(21):5212–5223. doi: 10.1021/acs.jafc.5b00840. [DOI] [PubMed] [Google Scholar]
- Lassiter TL, Ryde IT, Mackillop EA, Brown KK, Levin ED, Seidler FJ, Slotkin TA. Exposure of neonatal rats to parathion elicits sex-selective reprogramming of metabolism and alters the response to a high-fat diet in adulthood. Environ Health Perspect. 2008;116(11):1456–1462. doi: 10.1289/ehp.11673. [DOI] [PMC free article] [PubMed] [Google Scholar]
- Lee DH, Jacobs DR. A strong dose-response relation between serum concentrations of persistent organic pollutants and diabetes: Results from the National Health and Nutrition Examination Survey 1999–2002 - Response to Porta. Diabetes Care. 2006;29(11):2568–2568. doi: 10.2337/dc06-1531. [DOI] [PubMed] [Google Scholar]
- Lee DH, Lee IK, Porta M, Steffes M, Jacobs DR. Relationship between serum concentrations of persistent organic pollutants and the prevalence of metabolic syndrome among non-diabetic adults: results from the National Health and Nutrition Examination Survey 1999–2002. Diabetologia. 2007;50(9):1841–1851. doi: 10.1007/s00125-007-0755-4. [DOI] [PubMed] [Google Scholar]
- Mayer-Davis EJ, D’Agostino R, Jr, Karter AJ, Haffner SM, Rewers MJ, Saad M, Bergman RN. Intensity and amount of physical activity in relation to insulin sensitivity: the Insulin Resistance Atherosclerosis Study. JAMA. 1998;279(9):669–674. doi: 10.1001/jama.279.9.669. [DOI] [PubMed] [Google Scholar]
- Moreno-Aliaga MJ, Matsumura F. Effects of 1,1,1-trichloro-2,2-bis (p-chlorophenyl)-ethane (p, p ′-DDT) on 3T3-L1 and 3T3-F442A adipocyte differentiation. Biochem Pharmacol. 2002;63(5):997–1007. doi: 10.1016/s0006-2952(01)00933-9. [DOI] [PubMed] [Google Scholar]
- Mostafalou S, Abdollahi M. The role of environmental pollution of pesticides in human diabetes. Int J Pharmacol. 2012;8(2):139–140. [Google Scholar]
- Mostafalou S, Abdollahi M. Pesticides and human chronic diseases: evidences, mechanisms, and perspectives. Toxicol Appl Pharmacol. 2013;268(2):157–177. doi: 10.1016/j.taap.2013.01.025. [DOI] [PubMed] [Google Scholar]
- Mostafalou S, Eghbal MA, Nili-Ahmadabadi A, Baeeri M, Abdollahi M. Biochemical evidence on the potential role of organophosphates in hepatic glucose metabolism toward insulin resistance through inflammatory signaling and free radical pathways. Toxicol Ind Health. 2012;28(9):840–851. doi: 10.1177/0748233711425073. [DOI] [PubMed] [Google Scholar]
- Mugford CA, Kedderis GL. Sex-dependent metabolism of xenobiotics. Drug Metab Rev. 1998;30(3):441–498. doi: 10.3109/03602539808996322. [DOI] [PubMed] [Google Scholar]
- Narendra M, Kavitha G, Helah Kiranmai A, Raghava Rao N, Varadacharyulu NC. Chronic exposure to pyrethroid-based allethrin and prallethrin mosquito repellents alters plasma biochemical profile. Chemosphere. 2008;73(3):360–364. doi: 10.1016/j.chemosphere.2008.05.070. [DOI] [PubMed] [Google Scholar]
- Neta G, Goldman LR, Barr D, Apelberg BJ, Witter FR, Halden RU. Fetal exposure to chlordane and permethrin mixtures in relation to inflammatory cytokines and birth outcomes. Environ Sci Technol. 2011;45(4):1680–1687. doi: 10.1021/es103417j. [DOI] [PMC free article] [PubMed] [Google Scholar]
- Nieradko-Iwanicka B, Borzecki A. Subacute poisoning of mice with deltamethrin produces memory impairment, reduced locomotor activity, liver damage and changes in blood morphology in the mechanism of oxidative stress. Pharmacol Rep. 2015;67(3):535–541. doi: 10.1016/j.pharep.2014.12.012. [DOI] [PubMed] [Google Scholar]
- Park Y, Kim Y, Kim J, Yoon KS, Clark J, Lee J, Park Y. Imidacloprid, a neonicotinoid insecticide, potentiates adipogenesis in 3T3-L1 adipocytes. J Agric Food Chem. 2013;61(1):255–259. doi: 10.1021/jf3039814. [DOI] [PubMed] [Google Scholar]
- Ray DE, Cremer JE. Action of decamethrin (a synthetic pyrethroid) on the rat. Pestic Biochem Physiol. 1979;10(3):333–340. [Google Scholar]
- Rignell-Hydbom A, Rylander L, Hagmar L. Exposure to persistent organochlorine pollutants and type 2 diabetes mellitus. Hum Exp Toxicol. 2007;26(5):447–452. doi: 10.1177/0960327107076886. [DOI] [PubMed] [Google Scholar]
- Saltiel AR, Kahn CR. Insulin signalling and the regulation of glucose and lipid metabolism. Nature. 2001;414(6865):799–806. doi: 10.1038/414799a. [DOI] [PubMed] [Google Scholar]
- Sarbassov DD, Guertin DA, Ali SM, Sabatini DM. Phosphorylation and regulation of Akt/PKB by the rictor-mTOR complex. Science. 2005;307(5712):1098–1101. doi: 10.1126/science.1106148. [DOI] [PubMed] [Google Scholar]
- Shen P, Hsieh TH, Yue Y, Sun Q, Clark JM, Park Y. Deltamethrin increases the fat accumulation in 3T3-L1 adipocytes and Caenorhabditis elegans. Food Chem Toxicol. 2017;101:149–156. doi: 10.1016/j.fct.2017.01.015. [DOI] [PubMed] [Google Scholar]
- Slaninova A, Smutna M, Modra H, Svobodova Z. A review: oxidative stress in fish induced by pesticides. Neuro Endocrinol Lett. 2009;30(Suppl 1):2–12. [PubMed] [Google Scholar]
- Slotkin TA, Brown KK, Seidler FJ. Developmental exposure of rats to chlorpyrifos elicits sex-selective hyperlipidemia and hyperinsulinemia in adulthood. Environ Health Perspect. 2005;113(10):1291–1294. doi: 10.1289/ehp.8133. [DOI] [PMC free article] [PubMed] [Google Scholar]
- Soderlund DM, Clark JM, Sheets LP, Mullin LS, Piccirillo VJ, Sargent D, Stevens JT, Weiner ML. Mechanisms of pyrethroid neurotoxicity: implications for cumulative risk assessment. Toxicology. 2002;171(1):3–59. doi: 10.1016/s0300-483x(01)00569-8. [DOI] [PubMed] [Google Scholar]
- Soltaninejad K, Abdollahi M. Current opinion on the science of organophosphate pesticides and toxic stress: A systematic review. Med Sci Monitor. 2009;15(3):Ra75–Ra90. [PubMed] [Google Scholar]
- Sparks TC, Nauen R. IRAC: Mode of action classification and insecticide resistance management. Pestic Biochem Physiol. 2015;121:122–128. doi: 10.1016/j.pestbp.2014.11.014. [DOI] [PubMed] [Google Scholar]
- Sun Q, Qi W, Yang J, Yoon KS, Clark JM, Park Y. Fipronil promotes adipogenesis via AMPK alpha-mediated pathway in 3T3-L1 adipocytes. Food Chem Toxicol. 2016;92:217–223. doi: 10.1016/j.fct.2016.04.011. [DOI] [PubMed] [Google Scholar]
- Sun Q, Xiao X, Kim Y, Kim D, Yoon KS, Clark JM, Park Y. Imidacloprid promotes high fat diet-induced adiposity and insulin resistance in male C57BL/6J mice. J Agric Food Chem. 2016;64(49):9293–9306. doi: 10.1021/acs.jafc.6b04322. [DOI] [PMC free article] [PubMed] [Google Scholar]
- Teimouri F, Amirkabirian N, Esmaily H, Mohammadirad A, Aliahmadi A, Abdollahi M. Alteration of hepatic cells glucose metabolism as a non-cholinergic detoxication mechanism in counteracting diazinon-induced oxidative stress. Hum Exp Toxicol. 2006;25(12):697–703. doi: 10.1177/0960327106075064. [DOI] [PubMed] [Google Scholar]
- Tornero-Velez R, Davis J, Scollon EJ, Starr JM, Setzer RW, Goldsmith MR, Chang DT, Xue J, Zartarian V, DeVito MJ, Hughes MF. A pharmacokinetic model of cis- and trans-permethrin disposition in rats and humans with aggregate exposure application. Toxicol Sci. 2012;130(1):33–47. doi: 10.1093/toxsci/kfs236. [DOI] [PubMed] [Google Scholar]
- Toynton K, Luukinen B, Buhl K, Stone D. Permethirn Technical Fact Sheet. National Pesticide Information Center, Oregon State University Extension Services; 2009. http://npic.orst.edu/factsheets/archive/Permtech.html. [Google Scholar]
- Ukropec J, Radikova Z, Huckova M, Koska J, Kocan A, Sebokova E, Drobna B, Trnovec T, Susienkova K, Labudova V, Gasperikova D, Langer P, Klimes I. High prevalence of prediabetes and diabetes in a population exposed to high levels of an organochlorine cocktail. Diabetologia. 2010;53(5):899–906. doi: 10.1007/s00125-010-1683-2. [DOI] [PubMed] [Google Scholar]
- Veerappan M, Hwang I, Pandurangan M. Effect of cypermethrin, carbendazim and their combination on male albino rat serum. Int J Clin Exp Pathol. 2012;93(5):361–369. doi: 10.1111/j.1365-2613.2012.00828.x. [DOI] [PMC free article] [PubMed] [Google Scholar]
- Wallace TM, Levy JC, Matthews DR. Use and abuse of HOMA modeling. Diabetes Care. 2004;27(6):1487–1495. doi: 10.2337/diacare.27.6.1487. [DOI] [PubMed] [Google Scholar]
- Wang J, Zhu Y, Cai X, Yu J, Yang X, Cheng J. Abnormal glucose regulation in pyrethroid pesticide factory workers. Chemosphere. 2011;82(7):1080–1082. doi: 10.1016/j.chemosphere.2010.10.065. [DOI] [PubMed] [Google Scholar]
- Wang X, Martinez MA, Dai M, Chen D, Ares I, Romero A, Castellano V, Martinez M, Rodriguez JL, Martinez-Larranaga MR, Anadon A, Yuan Z. Permethrin-induced oxidative stress and toxicity and metabolism. A review. Environ Res. 2016;149:86–104. doi: 10.1016/j.envres.2016.05.003. [DOI] [PubMed] [Google Scholar]
- WHO. Permethrin (40:60 cis:trans isomer ratio) world health organization WHO specifications and evaluations for public health pesticides. 1990. [Google Scholar]
- Yang ZP, Dettbarn WD. Diisopropylphosphorofluoridate-induced cholinergic hyperactivity and lipid peroxidation. Toxicol Appl Pharmacol. 1996;138(1):48–53. doi: 10.1006/taap.1996.0096. [DOI] [PubMed] [Google Scholar]
- Yousef MI, Awad TI, Mohamed EH. Deltamethrin-induced oxidative damage and biochemical alterations in rat and its attenuation by Vitamin E. Toxicology. 2006;227(3):240–247. doi: 10.1016/j.tox.2006.08.008. [DOI] [PubMed] [Google Scholar]
Associated Data
This section collects any data citations, data availability statements, or supplementary materials included in this article.