

Abstract
Purpose
To assess breast cancer screening utilization in Medicare beneficiaries with colorectal and lung cancer versus cancer-free controls.
Methods
Female fee-for-service Medicare beneficiaries who were ≥67 years old and diagnosed with lung or colorectal cancer between 2000 and 2011 and who reported to a Surveillance, Epidemiology, and End Results (SEER) registry (case group) were followed for 2 years after their diagnoses, unless death, a diagnosis of breast cancer, or the end of 2013 came first. A similar number of cancer-free controls were individually matched to cases by age, race, registry region, and follow-up time. Screening utilization was defined as the percentage of women with ≥1 screening mammogram during follow-up.
Results
Overall, 104,164 cases (48% colorectal, 52% lung; 30% advanced cancer) and 104,164 controls were included. Among women with lung or colorectal cancer, 22% underwent ≥1 screening mammogram versus 26% of controls (odds ratio [OR] 0.80; 95% confidence interval [CI] 0.78–0.82). Stratified by cancer type, 28% of colorectal cancer cases versus 29% of controls (OR 0.98; 95% CI 0.95–1.01) and 17% of lung cancer cases versus 23% of controls (OR 0.63; 95% CI 0.60–0.65) received ≥1 mammogram. When stratified by stage, 8% with advanced cancer versus 18% of controls (OR 0.33; 95% CI 0.31–0.35) and 30% with early-stage cancer versus 30% of controls (OR 1; 95% CI 0.97–1.02) underwent ≥1 mammogram.
Conclusion
Screening mammography utilization rates are similar between Medicare beneficiaries with early-stage cancer versus controls. Although the majority of patients with advanced-stage cancer appropriately do not pursue screening mammography, a small number (8%) continue with screening.
Keywords: Screening mammography, cancer survivorship period, utilization, population-based
INTRODUCTION
Advances in early cancer detection and treatment have led to an approximate 20% decrease in mortality between 1991 and 2010 [1]. In general, cancer survivors are at increased risk of developing second primary malignancies [2] from genetic syndromes, shared etiologic factors, or late sequel of treatment. These second malignancies account for 16% of all cancer diagnoses [3]. Lung and colorectal cancer survivorship, however, does not seem to increase the risk of subsequent breast cancer [4–6]. Accordingly, breast cancer screening rates in survivors of early-stage lung and colorectal cancer are expected to be similar to those in a cancer-free population. However, life expectancy of cancer survivors varies by disease stage. Routine screening may not benefit those presenting with advanced cancer, driving unnecessary health care costs [7].
The utilization of cancer screening tests during cancer survivorship is multifactorial and involves considerable discretion by the treating physician [8], who needs to assess the patient’s life expectancy and communicate that prognosis to the patient. Sometimes, screening tests are performed at patients’ requests, even if contrary to guidelines. Patients sometimes use their primary cancer diagnosis as a behavior-changing event or use denial as a coping strategy [7,9]. Furthermore, variation and uncertainty exist among health care practitioners about the best use of cancer screening in patients with existing cancer diagnoses.
Studies from over two decades ago reported a slight but not significant increase in screening mammography utilization in colorectal cancer survivors after their cancer diagnosis [10,11]. Considerable interval changes in breast cancer screening utilization overall [12–15], breast cancer screening guidelines [16,17], increased breast cancer awareness [18], and decreased mortality of cancer survivors [1] warrants a re-evaluation of the rate, frequency, and interval of screening mammography utilization in the broad population of patients with a new cancer diagnosis (compared with a cancer-free population). In addition to understanding contemporary rates of screening utilization, information about the distribution of screening utilization by stage at diagnosis could guide initiatives to ensure more appropriate screening.
The purpose of this study was to compare utilization rates of breast cancer screening in women 67 years or older with a new diagnosis of colorectal or lung cancer to screening rates (1) in a cancer-free Medicare control group and (2) in the same patients in the 2 years before their primary cancer diagnosis. We further compared utilization rates for individuals with late- versus early-stage diagnoses and then explored predictors of screening mammography within the case population.
METHODS
Institutional Review Board approval and a waiver of informed consent were both obtained for this HIPAA-compliant retrospective review of linked Surveillance, Epidemiology, and End Results (SEER) Program and Medicare carrier claims data.
Data Source
We used SEER-Medicare, a cancer registry and claims-based database of medical care received by Medicare beneficiaries with cancer. The database includes SEER program information from cancer registries in 13 states or metropolitan areas (18 registries covering approximately 28% of the US population) and fee-for-service claims for covered health care services (both Parts A and B benefits) for all SEER registry Medicare beneficiaries from the time of a person’s Medicare eligibility until death [19,20]. The linkage of SEER with Medicare data used for this study was last updated in 2014 [19].
Study Population
Cancer Cases
All Medicare-enrolled women 67 years or older registered in SEER between 2000 and 2011 with a diagnosis of colorectal or lung cancer were assessed for eligibility. These specific cancers were selected because they represent the most common nonbreast malignancies in women [21]. We excluded all patients in whom colorectal or lung cancer was not their first primary cancer, as well as those with an unknown month of cancer diagnosis, a diagnosis reported only from autopsy or death certificate, a date of death before date of diagnosis, or a death or breast cancer diagnosis within the first 3 months after the colorectal or lung cancer diagnosis. To ensure complete claims capture, we only included patients continuously enrolled in Medicare Parts A and B and not enrolled in a Medicare HMO from 2 years before cancer diagnosis to a follow-up end date defined as 2 years and 3 months after diagnosis, a diagnosis of breast cancer, death, or the censoring date of December 31, 2013, whichever came first. We defined patients with advanced cancer as those with SEER-derived American Joint Committee on Cancer (AJCC) [22] stage IV colorectal cancer and IIIB-IV lung cancer, which have an estimated overall 5-year survival of 5% and 3%, respectively [7].
Cancer-Free Controls
A matched cohort of female fee-for-service Medicare enrollees without cancer with sufficiently complete demographic information was identified from a random 5% sample of Medicare fee-for-service beneficiaries residing in SEER areas. Each cancer patient was individually matched to a cancer-free control by birth year, race, and registry region. As with cancer cases, we only included controls continuously enrolled in Medicare Parts A and B between the date of the corresponding case diagnosis and case follow-up end date. Each control had exactly the same amount of follow-up time as her corresponding cancer case.
Screening Mammography Utilization
We restricted the analysis to billing codes that specifically identify screening (rather than diagnostic) mammography. Screening mammography services were identified using Current Procedural Terminology (CPT) codes 77057 and 76092 and Healthcare Common Procedure Coding System (HCPCS) codes G0202 and G0203 [23]. All duplicate claims were eliminated by matching patient identifier, examination date, and CPT or HCPCS code.
Screening utilization rates were defined as the percentage of women undergoing at least one screening mammogram between follow-up start and end dates. To help ensure a screening mammogram was not part of a colorectal or lung cancer diagnosis workup, the follow-up start date was defined as 3 months after cancer diagnosis for all study outcomes and extended for a maximum of 2 years beyond that date.
Study Outcomes
The primary outcome was the utilization of screening mammography in Medicare beneficiaries with colorectal and lung cancer versus a cancer-free control group between the follow-up start and end dates. We further performed time to event analysis to estimate screening rates over time.
A secondary outcome was the utilization of screening mammography in Medicare beneficiaries with colorectal or lung cancer within 2 years before versus 2 years after diagnosis.
Statistical Analysis
Screening mammography utilization was compared using McNemar’s test for cancer cases versus cancer-free controls (primary outcome) and before versus after cancer diagnosis (secondary outcome). Odds ratios (ORs) were calculated using the Mantel-Haenszel method for matched pairs [24]. A time to event analysis was further performed for the primary outcome by plotting the cumulative incidence of a screening event over a 2-year window after diagnosis for cases and controls. Estimated screening event rates and 95% confidence intervals (CIs) over time are reported.
Predictors of screening mammography utilization among cases was assessed using multivariable logistic regression analyses, modeling cancer site (lung, colon), stage (0-IV), age at diagnosis (65–69 years, 70–74 years, 75–79 years, >80 years), race or ethnicity (white, African American, other), geographic region (Northeast, Southeast, Midwest, West), marital status (married, not married), and SEER poverty index (0%–<5%, 5%–<10%, 10%–<20%, 20%–100%). Multicollinearity was checked using variance inflation factors.
Statistical analyses were conducted using SAS version 9.2 (SAS Institute Inc, Cary, North Carolina, USA). All significance tests were two-sided and used a 5% level of significance.
RESULTS
Study Population Characteristics
Overall, 104,164 cancer cases and 104,164 matched controls were included for the primary outcome analysis (Fig. 1). Baseline characteristics of cancer cases are shown in Table 1. Forty-eight percent of patients had colorectal and 52% had lung cancer. Mean age at diagnosis was 78 (standard deviation 7), ranging from 67 to 107, and did not vary remarkably by cancer site; 87% of patients were white and 35% were married. By study design, selected demographics (age, race, and region) of control cases mirrored those of cancer cases.
Fig 1.
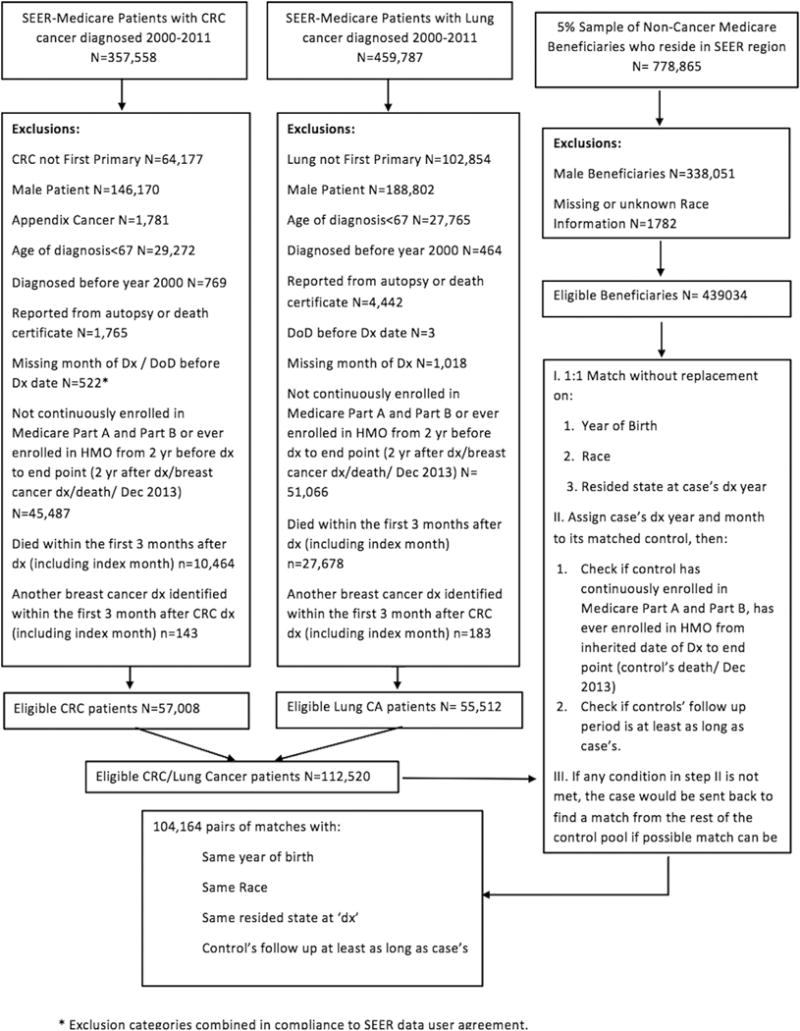
Study flowchart for primary outcome analysis. CRC = colorectal cancer; DoD = date of death; Dx = diagnosis; SEER = Surveillance, Epidemiology, and End Results.
Table 1.
Baseline characteristics of cancer cases
| Characteristics* | Both Cancers (N = 104,164) | Colorectal Cancer (N = 50,432) | Lung Cancer (N = 53,732) |
|---|---|---|---|
| Age at diagnosis, y (SD) | 78 (7) | 79 (7) | 76 (6) |
|
| |||
| Race, N (%) | |||
| White | 90,492 (87) | 43,124 (85) | 47,368 (88) |
| Black | 8,356 (8) | 4,372 (9) | 3,984 (7) |
| Other | 5,316 (5) | 2,936 (6) | 2,380 (5) |
|
| |||
| Marital status, N (%) | |||
| Married | 34,551 (35) | 16,384 (34) | 18,167 (35) |
| Not Married | 64,897 (65) | 31,478 (66) | 33,419 (65) |
|
| |||
| SEER registry, N (%) | |||
| Northeast | 24,113 (23) | 12,329 (25) | 11,784 (22) |
| Midwest | 23,284 (22) | 11,058 (22) | 12,226 (23) |
| Southeast | 35,296 (34) | 16,292 (32) | 19,004 (35) |
| West | 21,471 (21) | 10,753 (21) | 10,718 (20) |
|
| |||
| Poverty index, N (%) | |||
| 0–<5% | 27,019 (26) | 13,222 (26) | 13,797 (26) |
| 5–<10% | 28,595 (28) | 13,875 (28) | 14,720 (27) |
| 10–<20% | 29,129 (28) | 13,994 (28) | 15,135 (28) |
| 20–100% | 19,138 (18) | 9,182 (18) | 9,956 (19) |
|
| |||
| AJCC staging, N (%) | |||
| 0 or occult | 9,269 (10) | 5,203 (11) | 4,066 (8) |
| 1 | 21,988 (23) | 10,643 (22) | 11,345 (24) |
| 2 | 24,541 (25) | 17,668 (37) | 6,873 (14) |
| 3 | 15,983 (17) | 7,499 (16) | 8,484 (18) |
| 4 | 24,117 (25) | 6,625 (14) | 17,492 (36) |
|
| |||
| Advanced stage cancer,† N (%) | |||
| Yes | 28,669 (30) | 6,625 (14) | 22,044 (46) |
| No | 67,120 (70) | 41,013 (86) | 26,107 (54) |
AJCC = American Joint Committee on Cancer; SD = standard deviation; SEER = Surveillance, Epidemiology, and End Results.
There were missing data for variables marital status, poverty, AJCC staging, and presence of advanced-stage cancer.
Advanced-stage cancer includes stage IV colorectal cancer and stage IIIB-IV lung cancer.
Utilization of Screening Mammography in Cases Versus Controls
Utilization of screening mammography is shown in Table 2. Among women with newly diagnosed colorectal or lung cancer, 22% underwent at least one screening mammogram versus 26% of controls (OR 0.80; 95% CI 0.78–0.82) within the 2-year follow-up window. Stratified by cancer type, 28% of colorectal cancer cases versus 29% controls (OR 0.98; 95% CI 0.95–1.01) and 17% of lung cancer cases versus 23% controls (OR 0.63; 95% CI 0.60–0.65) received at least one mammogram. When further stratified by stage of the case, 8% with newly diagnosed advanced cancer versus 18% of controls (OR 0.33; 95% CI 0.31–0.35) and 30% with newly diagnosed early-stage cancer versus 30% of controls (OR 1; 95% CI 0.97–1.02) underwent at least one mammogram.
Table 2.
Utilization of screening mammography during follow-up period
| Both Cancers
|
Colorectal Cancer
|
Lung Cancer
|
||||||||||
|---|---|---|---|---|---|---|---|---|---|---|---|---|
| f/u (Months) |
Case, N (%) |
Ctrl, N (%) |
OR (95% CI) | f/u (Months) |
Case, N (%) |
Ctrl, N (%) |
OR (95% CI) | f/u (Months) |
Case, N (%) |
Ctrl, N (%) |
OR (95% CI) | |
| All stages | ||||||||||||
| N | 104,164 | 50,432 | 53,732 | |||||||||
| Screening rates | 19 | 23,278 (22) | 26,663 (26) | 0.80 (0.78–0.82) P < .001 |
24 | 14,338 (28) | 14,525 (29) | 0.98 (0.95–1.01) P = .15 |
10 | 8,940 (17) | 12,138 (23) | 0.63 (0.60–0.65) P < .001 |
|
| ||||||||||||
| Advanced stage (stage IV colorectal and stage IIIB-IV lung cancer) | ||||||||||||
| N | 28,669 | 6,625 | 22,044 | |||||||||
| Screening rates | 6 | 2,223 (8) | 5,122 (18) | 0.33 (0.31–0.35) P < .001 |
8 | 566 (9) | 1,253 (19) | 0.34 (0.30–0.38) P < .001 |
5 | 1,657 (8) | 3,869 (18) | 0.33 (0.30–0.35) P < .001 |
|
| ||||||||||||
| Early stage | ||||||||||||
| N | 67,120 | 41,013 | 26,107 | |||||||||
| Screening rates | 24 | 20,013 (30) | 20,021 (30) | 1 (0.97–1.02) P = .96 |
24 | 13,312 (32) | 12,737 (31) | 1.08 (1.05–1.12) P < .001 |
19 | 6,701 (26) | 7,284 (28) | 1.15 (1.10–1.20) P < .001 |
Case screening rates are similar to postdiagnosis screening rates in Table 3. CI = confidence interval; Ctrl = control; f/u = median follow-up; OR = odds ratio.
Appendix 1 and Figure 2 show time to event analysis for screening mammography rates at 6, 12, 18, and 24 months within the 2-year follow-up window. Screening rates in cancer patients are slightly lower than controls regardless of time interval. This gap in event rates is higher in lung cancer patients, but very minimal in colorectal cancer patients. In advanced cancer patients, the screening rate difference between cases and controls increases over time. In early-stage cancer, the difference is minimal and does not change over time.
Fig 2.
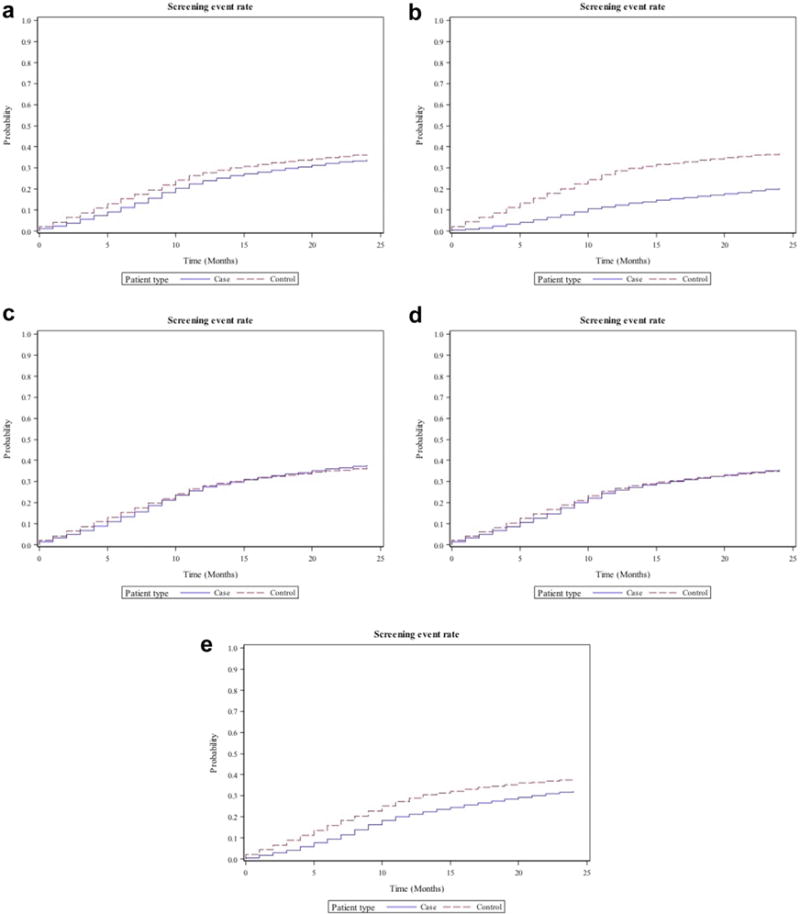
Plots showing time to event analysis for screening mammography in cases (continuous line) and control (interrupted line) patients for (a) all patients, (b) advanced cancer patients, (c) early-stage cancer patients, (d) colorectal cancer patients, and (e) lung cancer patients.
Utilization of Screening Mammography Changes Before and After Cancer Diagnosis
Receipt of at least one screening mammogram within 2 years after diagnosis of colorectal or lung cancer compared with 2 years before diagnosis was 22% versus 38% (OR 0.28; 95% CI 0.27–0.29). Stratified by cancer type, this was 28% versus 35% for colorectal (OR 0.59; 95% CI 0.57–0.61) and 17% versus 42% for lung cancer patients (OR 0.13; 95% CI 0.13–0.14). When stratified by stage, only 8% of patients with newly diagnosed advanced cancer received a screening mammogram within 2 years after diagnosis versus 40% within 2 years before diagnosis (OR 0.05; 95% CI 0.05–0.06). In comparison, 30% with newly diagnosed early-stage cancer received a screening mammogram within 2 years after diagnosis as opposed to 39% within 2 years before diagnosis (OR 0.48; 95% CI 0.47–0.50; Table 2).
Independent Predictors of Screening Mammography
Independent predictors of screening mammography are shown in Appendix 2. Higher screening mammography utilization within 2 years after cancer diagnosis was associated with colorectal compared with lung cancer (OR 2), lower AJCC stage (OR 4 for occult cancer, OR 8.1 for stage I, OR 4.3 for II, and OR 3.3 for III when compared with stage IV), younger age (OR 3.6 for <70; OR 3.1 for 70–74; OR 2.3 for 75–80 when compared with age > 80), white race (OR 1.2 compared with African American), being married (OR 1.5), lower poverty (OR 1.5 for poverty index <5%; OR 1.4 for index 5%–<10%; OR 1.1 for index 10%–<20% when compared with index 20%–100%), and geography (OR 1.2 for Southeast and West when compared with Northeast; all P < .05). Except for race and geography, similar independent predictors were identified when analyses were performed for colorectal and lung cancer.
DISCUSSION
In this study of screening mammography in fee-for-service Medicare beneficiaries with colorectal and lung cancer, cancer patients have slightly lower utilization rates compared with a cancer-free control population. In early-stage cancer patients, this difference is minimal. In patients with advanced cancer, utilization rates drop significantly over time compared with control patients. Nonetheless, 8% continue screening mammography, despite low 5-year survival likelihoods (5% for colorectal cancer and 3% for lung cancer) [7].
Prior studies have shown that some cancer survivors remain preoccupied about their health [25] and make positive health-protective changes (eg, adherence to follow-up tests and visits) and health-promoting behavior (eg, smoking cessation, healthy diet, exercise) after cancer diagnoses [25–28]. This preoccupation could also result in a desire for increased screening, even when additional cancer risk is not present. For example, overutilization of Pap smear screening was reported among women who have undergone hysterectomy [29]. Interestingly, among early-stage cancer survivors, we did not show increased screening rates, compared with matched cancer-free controls. Furthermore, when screening rates were compared with the same patient’s utilization of screening mammogram before her cancer diagnosis, utilization slightly decreased, which could be partly due to aging or death in the cases postdiagnosis, resulting in a shorter window for utilization assessment. Re-analyses of breast cancer screening utilization among early cancer patients should be conducted as additional SEER data become available to assess whether breast cancer screening continues to be appropriate in the late survivorship period.
In advanced cancer patients, screening rates were significantly lower than in a cancer-free population, and those rates diverged over time. Furthermore, screening rates after cancer diagnoses dropped significantly compared with patients’ prediagnosis screening rates. Both are likely mainly due to the predicted decreased survival as a result of advanced cancer, resulting in a median follow-up time of 6 months. Although the majority of advanced-stage cancer patients (92%) appropriately do not pursue screening mammography, a small proportion may continue to undergo screening mammography. Both the Society of Breast Imaging and the ACR recommend cessation of breast cancer screening in women with life expectancies shorter than 5 to 7 years [30]. A definitive explanation for our results cannot be gleaned from our retrospective analysis, but a variety of factors could be contributing. Ongoing screening in some advanced cancer patients might be due to fear of another cancer (enhancing their desire for screening even in the absence of evidence of potential benefit), denial of their primary cancer prognosis, using their primary cancer diagnosis as a behavior-changing event [7,9], or inadequate communication about life expectancy and the lack of screening benefit with referring physician [8].
Our results are thus consistent with prior reports of screening mammography rates ranging from 9% among Medicare beneficiaries with advanced cancers and median survival of less than 2 years [7] to 34% in National Health Institute Survey participants with more than 75% risk of mortality within 5 years, regardless of prior cancer [31]. Therefore, age alone is insufficient in determining appropriateness of screening [31]. However, whether guideline changes are sufficient to improve appropriate screening utilization is unclear. There are several reports of screening mammography utilization among women older than 75 years [32] despite lack of evidence for screening benefit and the possibility of overdiagnosis and overtreatment [17]. Both patients and referring physicians likely play a role in the choice to continue screening [33]. For many patients, screening cessation was seen as a major decision but continuing screening was not, and a physician’s recommendation to stop screening may in fact threaten patient trust [34]. For these reasons, referring physician surveys have shown that discussions about screening discontinuation can be uncomfortable and time-consuming [35].
The utilization of cancer screening in patients with short life expectancies could cause net harm to both the patients and their family or caregivers due to complications from subsequent diagnostic procedures, overtreatment of clinically unimportant cancers, psychological stress associated with overdiagnosis of a cancer that will not cause death or symptoms, and possibly temporary anxiety associated with false-positive results [32,36]. Studies estimate that 1 in 15 screening mammograms are false-positives [32,37] and 1 in 3 breast cancers detected are overdiagnosed [38]. For individuals with advanced cancer and short life expectancies, additional diagnostic workup, whether it ends up being a false-positive or true cancer that would likely never become clinically significant within 5 years, probably represents wasteful care and can also potentially result in psychological stress [39] in a patient with an already established cancer diagnosis.
Finally, cancer screening in patients with short life expectancies has health resource implications. More than 25% of Medicare dollars are spent at the end of life [40], and cancer consumes a great proportion of overall Medicare expenditures [41], with a 1- to 3-fold increase in monthly health care utilization rates starting from 3 to 5 months before a cancer diagnosis [42]. Mean 5-year net health care costs for Medicare-covered women with colorectal cancer have been estimated as $35,000 [43]. Furthermore, there are indirect costs associated with cancer screening and follow-up visits, such as cost of transportation to and from medical appointments, work absence and lost productivity, and child care coverage [44]. One strategy in limiting health care cost is to systematically identify unnecessary care that does not provide meaningful benefit [7]. Identification of wasteful care is challenging because each patient’s circumstances are unique, making it difficult to reliably define episodes of overuse [7]. Although costs are rarely the sole reason that guidelines set limits on screening [36], in cancer patients with short life expectancies, overscreening, overdetection, and overtreatment are examples of care unlikely to provide net benefit to patients. A more thoughtful decision to screen will likely partially reduce the costs of care in cancer patients.
When stratified by cancer type, we found that overall women with colorectal cancer are more likely to undergo screening mammography than those with lung cancer. This is likely partially due to later stages of cancer at diagnosis among patients with lung cancer compared with colorectal cancer. However, after adjusting the utilization based on staging and other patient demographics, screening mammography use remained 2-fold higher in colorectal cancer patients. As expected, factors associated with longer survival (such as younger age and lower AJCC stage) were associated with higher utilization rates of screening mammography. Furthermore, the sources of screening disparity among cancer survivors were similar to the general population, namely, race [45], marital [46] and economic status [47], as well as geography [45].
This study has several limitations due to use of the SEER-Medicare data source. First, screening mammography use was determined using CPT or HCPCS billing codes for screening mammography. Some studies suggest underestimation of screening mammography rates when solely using screening mammography codes, with uncertainty in distinguishing screening from diagnostic mammograms [48]. To avoid overestimating screening mammography utilization, this study thus focused only on screening billing codes. Second, the overall screening mammography rate is lower compared with other studies with younger mean age population [49,50], probably because it included only Medicare beneficiaries 67 years and older. Finally, although 8% of advanced cancer patients continue to undergo screening mammography, it is unclear what proportion are among the small percentage of advanced cancer patients surviving beyond the recommended 5 years for screening mammography by societal guidelines.
CONCLUSION
In summary, the study results show that although there is no difference in screening mammography utilization among women with early-stage cancer versus cancer-free controls, 8% of women with advanced cancer continue screening mammography after their diagnosis compared with 18% in a cancer-free control matched on follow-up time and 40% of women within 2 years before diagnosis. Furthermore, women with colorectal cancer (compared with lung cancer) and certain sociodemographic characteristics are more likely to undergo screening mammography. Identifying areas of potential inappropriate utilization could help target interventions to improve clinical practice. Efforts should be made in ensuring appropriate utilization of screening mammography in the small proportion of advanced cancer patients who undergo this test, based on their individual survival rates and response to therapy. Such information about screening test utilization in cancer patients with short life expectancy could guide cancer screening guidelines and Medicare coverage decisions to reduce the costs of cancer care.
Table 3.
Utilization of screening mammography before and after cancer diagnosis
| Both Cancers
|
Colorectal Cancer
|
Lung Cancer
|
|||||||
|---|---|---|---|---|---|---|---|---|---|
| Pre-dx, N (%) | Post-dx, N (%) | OR (95% CI) | Pre-dx, N (%) | Post-dx, N (%) | OR (95% CI) | Pre-dx, N (%) | Post-dx, N (%) | OR (95% CI) | |
| All stages | |||||||||
| N | 104,164 | 50,432 | 53,732 | ||||||
| Screening rates | 39,888 (38) | 23,278 (22) | 0.28 (0.27–0.29) P < .001 |
17,464 (35) | 14,338 (28) | 0.59 (0.57–0.61) P < .001 |
22,424 (42) | 8,940 (17) | 0.13 (0.13–0.14) P < .001 |
|
| |||||||||
| Advanced stage (stage IV colorectal and stage IIIB-IV lung cancer) | |||||||||
| N | 28,669 | 6,625 | 22,044 | ||||||
| Screening rates | 11,385 (40) | 2,223 (8) | 0.05 (0.05–0.06) P < .001 |
2,043 (31) | 566 (9) | 0.11 (0.09–0.13) P < .001 |
9,342 (42) | 1,657 (6) | 0.04 (0.03–0.04) P < .001 |
|
| |||||||||
| Early stage | |||||||||
| N | 67,120 | 41,013 | 26,107 | ||||||
| Screening rates | 26,120 (39) | 20,013 (30) | 0.48 (0.47–0.50) P < .001 |
14,710 (36) | 13,312 (32) | 0.75 (0.72–0.78) P < .001 |
11,410 (44) | 6,701 (26) | 0.25 (0.24–0.26) P < .001 |
Postdiagnosis screening rates are similar to case screening rates in Table 2. CI = confidence interval; dx = diagnosis; OR, odds ratio.
TAKE-HOME POINTS.
-
▪
There is appropriate utilization of screening mammography among early-stage cancer survivors.
-
▪
Eight percent of women with advanced cancer and short life expectancy continue screening mammography after their diagnosis compared with 18% in a matched cancer-free control and 40% of women within 2 years before diagnosis.
-
▪
Higher screening mammography utilization was associated with colorectal compared with lung cancer, lower AJCC stage, younger age, white race, being married, and more favorable economic status.
-
▪
The utilization of cancer screening in patients with short life expectancies has health resource implications and could cause net harm to patients due to complications from subsequent diagnostic procedures, overdiagnosis, and overtreatment.
-
▪
Identifying potential areas of overutilization may help target interventions to reduce low-yield care.
Acknowledgments
Funding: Research reported in this publication was supported by the Radiological Society of North America Research and Education Foundation under award number RR1553. Furthermore, this research was supported in part by the Biostatistics and Bioinformatics Shared Resource of Winship Cancer Institute of Emory University and National Institutes of Health/National Cancer Institute under award number P30CA138292. This study used the linked Surveillance, Epidemiology, and End Results (SEER)-Medicare database. The authors acknowledge the efforts of the Applied Research Program, National Cancer Institute; the Office of Research, Development, and Information, CMS; Information Management Services, Inc; and the SEER program tumor registries in the creation of the SEER-Medicare database. The interpretation and reporting of these data are the sole responsibility of the authors.
Appendix 1
Time to event analysis for screening mammography in cases and control patients
| Both Cancers
|
Colorectal Cancer
|
Lung Cancer
|
||||||||||||
|---|---|---|---|---|---|---|---|---|---|---|---|---|---|---|
| Case | Ctrl | Case | Ctrl | Case | Ctrl | |||||||||
| All stages | ||||||||||||||
| 6 months | 11.1 (10.9–11.3) | 15.3 (15–15.5) | 12.7 (12.4–13) | 14.7 (14.4–15.1) | 9.5 (9.2–9.8) | 15.9 (15.6–16.3) | ||||||||
| 12 months | 23.9 (23.6–24.3) | 27.9 (27.6–28) | 26 (25.6–26.5) | 27 (26.6–27.4) | 21.4 (21–21.9) | 29.1 (28.6–29.6) | ||||||||
| 18 months | 29.8 (29.5–30.1) | 33 (32.7–33.4) | 31.7 (31.3–32.2) | 31.9 (31.4–32.3) | 27.6 (27–28.1) | 34.6 (34–35.1) | ||||||||
| 24 months | 34 (33.7–34.4) | 36.3 (36–36.7) 35.7 | (35.2–36.2) | 35.2 (34.7–35.7) | 32.2 (32.6–32.8) | 37.9 (37.4–38.5) | ||||||||
|
| ||||||||||||||
| Advanced stage (stage IV colorectal and stage IIIB-IV lung cancer) | ||||||||||||||
| 6 months | 5.4 (5–5.7) | 15.4 (14.9–16) | 4.4 (3.9–5.1) | 14.9 (13.9–16) | 5.6 (5.3–6) | 16 (15.4–16.6) | ||||||||
| 12 months | 12.9 (12.3–13.5) | 27.9 (27.1–28.7) | 11.6 (10.6–12.7) | 27.1 (25.6–28.5) | 12.8 (12.1–13.5) | 29.2 (28.3–31.2) | ||||||||
| 18 months | 17.5 (16.7–18.3) | 32.4 (31.5–33.3) | 15.5 (14.2–16.8) | 31.5 (29.8–33.1) | 17.1 (16.2–18) | 34.3 (33.2–35.3) | ||||||||
| 24 months | 21.1 (20.2–22.1) | 35.7 (34.7–36.7) | 19.1 (17.6–20.7) | 35 (33.2–36.8) | 20.8 (16.7–21.9) | 37.6 (36.4–38.7) | ||||||||
|
| ||||||||||||||
| Early stage | ||||||||||||||
| 6 months | 13.9 (13.6–14.2) | 15.2 (14.9–15.5) | 13.9 (13.6–14.3) | 14.9 (14.5–15.2) | 12.5 (12.1–12.9) | 16.1 (15.6–16.6) | ||||||||
| 12 months | 28.2 (27.8–28.7) | 27.9 (27.5–28.3) | 27.9 (27.5–28.4) | 27.3 (26.8–27.7) | 26.7 (26–27.3) | 29.5 (28.8–30.1) | ||||||||
| 18 months | 34.4 (33.9–34.8) | 33.1 (32.7–33.6) | 33.7 (33.3–34.2) | 32.2 (31.7–32.7) | 33.6 (32.9–34.3) | 35.2 (34.5–35.9) | ||||||||
| 24 months | 38.5 (38–39) | 36.5 (36.1–37) | 37.7 (37.2–38.2) | 35.5 (35–36) | 38.4 (37.7–39.2) | 38.6 (37.9–39.3) | ||||||||
Cumulative screening rates at each time point are shown in percentage and 95% confidence intervals. Ctrl = control.
Appendix 2
Independent predictors of screening mammography in patients with newly diagnosed colorectal or lung cancers within 2 years after diagnosis
| Both Cancers, OR (95% CI) | Colorectal Cancer, OR (95% CI) | Lung Cancer, OR (95% CI) | |
|---|---|---|---|
| Cancer type | |||
| Colorectal vs lung | 2 (2–2.1) (P < .001) |
NA | NA |
|
| |||
| AJCC staging (reference “stage 4”) | |||
| 0 | 4 (3.8–4.4) (P < .001) |
6 (5.3–6.6) (P < .001) |
2.6 (2.3–2.9) (P < .001) |
| 1 | 8.1 (7.6–8.6) (P < .001) |
8 (7.2–8.8) (P < .001) |
8.8 (8.2–9.4) (P < .001) |
| 2 | 4.3 (4.1–4.6) (P < .001) |
5.5 (5–6) (P < .001) |
3.4 (3.1–3.7) (P < .001) |
| 3 | 3.3 (3.1–3.5) (P < .001) |
4.7 (4.2–5.2) (P < .001) |
2.4 (2.2–2.7) (P < .001) |
|
| |||
| Age (reference “age > 80”) | |||
| 65–69 | 3.6 (3.4–3.8) (P < .001) |
4.2 (3.9–4.5) (P < .001) |
2.8 (2.6–3) (P < .001) |
| 70–74 | 3.1 (3–3.2) (P < .001) |
3.6 (3.3–3.8) (P < .001) |
2.4 (2.2–2.6) (P < .001) |
| 75–79 | 2.3 (2.2–2.4) (P < .001) |
2.4 (2.3–2.6) (P < .001) |
1.9 (1.8–2.1) (P < .001) |
|
| |||
| Marital status (reference “not married”) | |||
| Married | 1.5 (1.5–1.6) (P < .001) |
1.5 (1.5–1.6) (P < .001) |
1.5 (1.4–1.6) (P < .001) |
|
| |||
| Race (reference “African American”) | |||
| White | 1.2 (1.1–1.2) (P < .001) |
1.3 (1.2–1.4) (P < .001) |
1 (0.9–1.1) (P .62) |
| Other | 1 (0.9–1.1) (P = .41) |
0.9 (0.8–1.1) (P = .49) |
1 (0.8–1.1) (P = .66) |
|
| |||
| Poverty index (reference “20–100%”) | |||
| 0%–<5% | 1.5 (1.4–1.6) (P < .001) |
1.5 (1.4–1.6) (P < .001) |
1.5 (1.4–1.7) (P < .001) |
| 5%–<10% | 1.4 (1.2–1.4) (P < .001) |
1.4 (1.3–1.5) (P < .001) |
1.3 (1.2–1.5) (P < .001) |
| 10%–<20% | 1.1 (1.1–1.2) (P < .001) |
1.2 (1.1–1.3) (P < .001) |
1.1 (1–1.2) (P = .009) |
|
| |||
| SEER Registry (reference “Northeast”) | |||
| Midwest | 1 (1–1.2) (P = .43) |
1.1 (1–1.2) (P < .001) |
0.9 (0.8–1) (P = .01) |
| Southeast | 1.2 (1.2–1.3) (P < .001) |
1.4 (1.3–1.5) (P < .001) |
1 (1–1.1) (P = .36) |
| West | 1.2 (1.2–1.3) (P < .001) |
1.3 (1.2–1.4) (P < .001) |
1.1 (1–1.2) (P = .02) |
AJCC = American Joint Committee on Cancer; CI = confidence interval; OR = odds ratio; SEER = Surveillance, Epidemiology, and End Results.
Footnotes
The authors have no conflicts of interest related to the material discussed in this article.
References
- 1.Siegel R, Ma J, Zou Z, Jemal A. Cancer statistics, 2014. CA Cancer J Clin. 2014;64:9–29. doi: 10.3322/caac.21208. [DOI] [PubMed] [Google Scholar]
- 2.Travis LB, Ng AK, Allan JM, et al. Second malignant neoplasms and cardiovascular disease following radiotherapy. J Natl Cancer Inst. 2012;104:357–70. doi: 10.1093/jnci/djr533. [DOI] [PMC free article] [PubMed] [Google Scholar]
- 3.Travis LB, Rabkin CS, Brown LM, et al. Cancer survivorship—genetic susceptibility and second primary cancers: research strategies and recommendations. J Natl Cancer Inst. 2006;98:15–25. doi: 10.1093/jnci/djj001. [DOI] [PubMed] [Google Scholar]
- 4.Evans HS, Moller H, Robinson D, Lewis CM, Bell CM, Hodgson SV. The risk of subsequent primary cancers after colorectal cancer in southeast England. Gut. 2002;50:647–52. doi: 10.1136/gut.50.5.647. [DOI] [PMC free article] [PubMed] [Google Scholar]
- 5.Buiatti E, Crocetti E, Acciai S, et al. Incidence of second primary cancers in three Italian population-based cancer registries. Eur J Cancer. 1997;33:1829–34. doi: 10.1016/s0959-8049(97)00173-1. [DOI] [PubMed] [Google Scholar]
- 6.McCredie M, Macfarlane GJ, Bell J, Coates M. Second primary cancers after cancers of the colon and rectum in New South Wales, Australia, 1972–1991. Cancer Epidemiol Biomarkers Prev. 1997;6:155–60. [PubMed] [Google Scholar]
- 7.Sima CS, Panageas KS, Schrag D. Cancer screening among patients with advanced cancer. JAMA. 2010;304:1584–91. doi: 10.1001/jama.2010.1449. [DOI] [PMC free article] [PubMed] [Google Scholar]
- 8.Snyder CF, Frick KD, Kantsiper ME, et al. Prevention, screening, and surveillance care for breast cancer survivors compared with controls: changes from 1998 to 2002. J Clin Oncol. 2009;27:1054–61. doi: 10.1200/JCO.2008.18.0950. [DOI] [PMC free article] [PubMed] [Google Scholar]
- 9.Rousseau P. Death denial. J Clin Oncol. 2000;18:3998–9. doi: 10.1200/JCO.2000.18.23.3998. [DOI] [PubMed] [Google Scholar]
- 10.Earle CC, Neville BA. Under use of necessary care among cancer survivors. Cancer. 2004;101:1712–9. doi: 10.1002/cncr.20560. [DOI] [PubMed] [Google Scholar]
- 11.Snyder CF, Earle CC, Herbert RJ, Neville BA, Blackford AL, Frick KD. Trends in follow-up and preventive care for colorectal cancer survivors. J Gen Intern Med. 2008;23:254–9. doi: 10.1007/s11606-007-0497-5. [DOI] [PMC free article] [PubMed] [Google Scholar]
- 12.Sadigh G, Hemingway J, Hughes D, Newell M, Duszak R. National specialty trends in breast imaging in Medicare beneficiaries over two decades. Paper presented at Association of University Radiologists (AUR) meeting; April 14–17, 2015; New Orleans, LA. [Google Scholar]
- 13.Centers for Disease Control and Prevention (CDC) Cancer screening—United States, 2010. MMWR Morb Mortal Wkly Rep. 2012;61:41–5. [PubMed] [Google Scholar]
- 14.Sprague BL, Bolton KC, Mace JL, et al. Registry-based study of trends in breast cancer screening mammography before and after the 2009 U.S. Preventive Services Task Force recommendations. Radiology. 2014;270:354–61. doi: 10.1148/radiol.13131063. [DOI] [PMC free article] [PubMed] [Google Scholar]
- 15.Dehkordy SF, Hall KS, Roach AL, Rothman ED, Dalton VK, Carlos RC. Trends in breast cancer screening: impact of U.S. Preventive Services Task Force recommendations. Am J Prev Med. 2015;49:419–22. doi: 10.1016/j.amepre.2015.02.017. [DOI] [PMC free article] [PubMed] [Google Scholar]
- 16.Force USPST. Screening for breast cancer: recommendations and rationale. Ann Intern Med. 2002;137:344–6. doi: 10.7326/0003-4819-137-5_part_1-200209030-00011. [DOI] [PubMed] [Google Scholar]
- 17.Force USPST. Screening for breast cancer: U.S. Preventive Services Task Force recommendation statement. Ann Intern Med. 2009;151:716–26, W-236. doi: 10.7326/0003-4819-151-10-200911170-00008. [DOI] [PubMed] [Google Scholar]
- 18.Fazeli Dehkordy S, Carlos RC, Hall KS, Dalton VK. Novel data sources for women’s health research: mapping breast screening online information seeking through Google trends. Acad Radiol. 2014;21:1172–6. doi: 10.1016/j.acra.2014.05.005. [DOI] [PMC free article] [PubMed] [Google Scholar]
- 19.National Cancer Institute. SEER-Medicare linked database. Available at: http://appliedresearch.cancer.gov/seermedicare/. Accessed June 14, 2016.
- 20.Warren JL, Klabunde CN, Schrag D, Bach PB, Riley GF. Overview of the SEER-Medicare data: content, research applications, and generalizability to the United States elderly population. Med Care. 2002:40. doi: 10.1097/01.MLR.0000020942.47004.03. IV-3-18. [DOI] [PubMed] [Google Scholar]
- 21.Centers for Disease Control and Prevention. Cancer Prevention and Control. Available at: http://www.cdc.gov/cancer/dcpc/data/women.htm. Accessed June 19, 2016.
- 22.Greene FL, Page DL, Fleming ID, et al. AJCC cancer staging manual. 7th. New York, NY: Springer; 2009. [Google Scholar]
- 23.CPT editorial panel. CPT standard edition: current procedural terminology. Chicago, IL: American Medical Association; [Google Scholar]
- 24.Fleiss JL, Levin B, Paik MC. Statistical methods for rates and proportions. 3rd. New York, NY: John Wiley & Sons; 2003. [Google Scholar]
- 25.Pinto BM, Eakin E, Maruyama NC. Health behavior changes after a cancer diagnosis: what do we know and where do we go from here? Ann Behav Med. 2000;22:38–52. doi: 10.1007/BF02895166. [DOI] [PubMed] [Google Scholar]
- 26.Park CL, Edmondson D, Fenster JR, Blank TO. Positive and negative health behavior changes in cancer survivors: a stress and coping perspective. J Health Psychol. 2008;13:1198–206. doi: 10.1177/1359105308095978. [DOI] [PubMed] [Google Scholar]
- 27.Newson JT, Huguet N, Ramage-Morin PL, et al. Health behaviour changes after diagnosis of chronic illness among Canadians aged 50 or older. Health Rep. 2012;23:49–53. [PMC free article] [PubMed] [Google Scholar]
- 28.Blanchard CM, Denniston MM, Baker F, et al. Do adults change their lifestyle behaviors after a cancer diagnosis? Am J Health Behav. 2003;27:246–56. doi: 10.5993/ajhb.27.3.6. [DOI] [PubMed] [Google Scholar]
- 29.Sirovich BE, Welch HG. Cervical cancer screening among women without a cervix. JAMA. 2004;291:2990–3. doi: 10.1001/jama.291.24.2990. [DOI] [PubMed] [Google Scholar]
- 30.Lee CH, Dershaw DD, Kopans D, et al. Breast cancer screening with imaging: recommendations from the Society of Breast Imaging and the ACR on the use of mammography, breast MRI, breast ultrasound, and other technologies for the detection of clinically occult breast cancer. J Am Coll Radiol. 2010;7:18–27. doi: 10.1016/j.jacr.2009.09.022. [DOI] [PubMed] [Google Scholar]
- 31.Royce TJ, Hendrix LH, Stokes WA, Allen IM, Chen RC. Cancer screening rates in individuals with different life expectancies. JAMA Intern Med. 2014;174:1558–65. doi: 10.1001/jamainternmed.2014.3895. [DOI] [PubMed] [Google Scholar]
- 32.Walter LC, Covinsky KE. Cancer screening in elderly patients: a framework for individualized decision making. JAMA. 2001;285:2750–6. doi: 10.1001/jama.285.21.2750. [DOI] [PubMed] [Google Scholar]
- 33.Soung MC. Screening for cancer: when to stop? A practical guide and review of the evidence. Med Clin North Am. 2015;99:249–62. doi: 10.1016/j.mcna.2014.11.002. [DOI] [PubMed] [Google Scholar]
- 34.Torke AM, Schwartz PH, Holtz LR, Montz K, Sachs GA. Older adults and forgoing cancer screening: “I think it would be strange”. JAMA Intern Med. 2013;173:526–31. doi: 10.1001/jamainternmed.2013.2903. [DOI] [PMC free article] [PubMed] [Google Scholar]
- 35.Schonberg MA, Ramanan RA, McCarthy EP, Marcantonio ER. Decision making and counseling around mammography screening for women aged 80 or older. J Gen Intern Med. 2006;21:979–85. doi: 10.1111/j.1525-1497.2006.00487.x. [DOI] [PMC free article] [PubMed] [Google Scholar]
- 36.Woolf SH, Harris R. The harms of screening: new attention to an old concern. JAMA. 2012;307:565–6. doi: 10.1001/jama.2012.100. [DOI] [PubMed] [Google Scholar]
- 37.Welch HG, Fisher ES. Diagnostic testing following screening mammography in the elderly. J Natl Cancer Inst. 1998;90:1389–92. doi: 10.1093/jnci/90.18.1389. [DOI] [PubMed] [Google Scholar]
- 38.Jorgensen KJ, Gotzsche PC. Overdiagnosis in publicly organised mammography screening programmes: systematic review of incidence trends. BMJ. 2009;339:b2587. doi: 10.1136/bmj.b2587. [DOI] [PMC free article] [PubMed] [Google Scholar]
- 39.Lerman C, Trock B, Rimer BK, Boyce A, Jepson C, Engstrom PF. Psychological and behavioral implications of abnormal mammograms. Ann Intern Med. 1991;114:657–61. doi: 10.7326/0003-4819-114-8-657. [DOI] [PubMed] [Google Scholar]
- 40.Riley GF, Lubitz JD. Long-term trends in Medicare payments in the last year of life. Health Serv Res. 2010;45:565–76. doi: 10.1111/j.1475-6773.2010.01082.x. [DOI] [PMC free article] [PubMed] [Google Scholar]
- 41.Meropol NJ, Schrag D, Smith TJ, et al. American Society of Clinical Oncology guidance statement: the cost of cancer care. J Clin Oncol. 2009;27:3868–74. doi: 10.1200/JCO.2009.23.1183. [DOI] [PubMed] [Google Scholar]
- 42.Hornbrook MC, Fishman PA, Ritzwoller DP, Elston-Lafata J, O’Keeffe-Rosetti MC, Salloum RG. When does an episode of care for cancer begin? Med Care. 2013;51:324–9. doi: 10.1097/MLR.0b013e3182731277. [DOI] [PMC free article] [PubMed] [Google Scholar]
- 43.Yabroff KR, Lamont EB, Mariotto A, et al. Cost of care for elderly cancer patients in the United States. J Natl Cancer Inst. 2008;100:630–41. doi: 10.1093/jnci/djn103. [DOI] [PubMed] [Google Scholar]
- 44.Alcusky M, Philpotts L, Bonafede M, Clarke J, Skoufalos A. The patient burden of screening mammography recall. J Womens Health (Larchmt) 2014;23(Suppl 1):S11–9. doi: 10.1089/jwh.2014.1511. [DOI] [PubMed] [Google Scholar]
- 45.Centers for Disease Control and Prevention. Breast cancer rates by race and ethnicity. Available at: https://www.cdc.gov/cancer/breast/statistics/race.htm. Accessed January 2, 2017.
- 46.Damiani G, Federico B, Basso D, et al. Socioeconomic disparities in the uptake of breast and cervical cancer screening in Italy: a cross sectional study. BMC Public Health. 2012;12:99. doi: 10.1186/1471-2458-12-99. [DOI] [PMC free article] [PubMed] [Google Scholar]
- 47.Nakamura A, Osonoi T, Terauchi Y. Relationship between urinary sodium excretion and pioglitazone-induced edema. J Diabetes Investig. 2010;1:208–11. doi: 10.1111/j.2040-1124.2010.00046.x. [DOI] [PMC free article] [PubMed] [Google Scholar]
- 48.Fenton JJ, Zhu W, Balch S, Smith-Bindman R, Fishman P, Hubbard RA. Distinguishing screening from diagnostic mammograms using Medicare claims data. Med Care. 2014;52:e44–51. doi: 10.1097/MLR.0b013e318269e0f5. [DOI] [PMC free article] [PubMed] [Google Scholar]
- 49.Ryerson AB, Miller JW, Eheman CR, Leadbetter S, White MC. Recent trends in U.S. mammography use from 2000–2006: a population-based analysis. Prev Med. 2008;47:477–82. doi: 10.1016/j.ypmed.2008.06.010. [DOI] [PubMed] [Google Scholar]
- 50.Miller JW, King JB, Joseph DA, Richardson LC, Centers for Disease C, Prevention Breast cancer screening among adult women—Behavioral Risk Factor Surveillance System, United States, 2010. MMWR Suppl. 2012;61:46–50. [PubMed] [Google Scholar]