

Abstract
Advanced hydrogen exchange (HX) methodology can now determine the structure of protein folding intermediates and their progression in folding pathways. Key developments over time include the HX pulse labeling method with nuclear magnetic resonance analysis, development of the fragment separation method, the addition to it of mass spectrometric (MS) analysis, and recent improvements in the HX MS technique and data analysis. Also, the discovery of protein foldons and their role supplies an essential interpretive link. Recent work using HX pulse labeling with HX MS analysis finds that a number of proteins fold by stepping through a reproducible sequence of native-like intermediates in an ordered pathway. The stepwise nature of the pathway is dictated by the cooperative foldon unit construction of the protein. The pathway order is determined by a sequential stabilization principle; prior native-like structure guides the formation of adjacent native-like structure. This view does not match the funneled energy landscape paradigm of a very large number of folding tracks, which was framed before foldons were known.
Keywords: protein folding, hydrogen exchange, HX MS, energy landscape theory
INTRODUCTION
The protein folding problem lies at the heart of protein biophysics and is important for much of cell biology. Yet, 55 years after Anfinsen’s seminal demonstration that proteins can fold all by themselves without outside help (1), no generally accepted folding model has emerged (6, 58). We now know that most proteins can fold spontaneously when they emerge from the ribosome in vivo, when they are diluted out of denaturant in vitro, and when they naturally unfold and refold during their lifetime both in the test tube and in the more complex cellular milieu. In order to understand how proteins transit from their unfolded state to their native state, it will be necessary to determine the changing structures of multiple transitional forms that are neither fully unfolded nor fully native, that cannot be isolated for study, and that may live for less than a second. This has long been the goal on which all else depends, but experimental and theoretical methodologies have not been up to the task.
Faced by this daunting situation, experimentalists have turned instead to the study of possible contributory factors—for example, the effect on protein folding of structure in the unfolded state, or the topology of the native state, or mutational and other modifications. In these efforts, one commonly uses a variety of methods, mainly spectroscopic, each of which measures some aspect of folding kinetics but reveals little about intermediate structures and pathways (8, 46). Trying to understand the effect of any factor on the folding process when one does not understand the folding process itself is problematic.
Theoretical efforts have followed a different course. Many years ago, Levinthal noted that proteins could not simply find their native state within any reasonable time by a random search through the vast conformational space available to them (34, 35). Yet proteins fold rapidly. He imagined that proteins must fold through some programmed structure formation pathway as shown in Figure 1. A different answer to the so-called Levinthal paradox is that a random search can suffice insofar as folding is directed by the natural energetically downhill gradient from the unfolded to the native state. In the absence of more specific direction, it is pictured that a refolding protein population converges through many pathways toward the native state in a funnel-like way as the proteins accumulate more and more native-like interactions (12, 33, 66). We do not propose to discuss the many enhancements attributed to the funnel picture over time but note that, as shown by many authors, the funneled landscape picture can be shaped to fit many different folding scenarios including the defined pathway model in Figure 1.
Figure 1.

The defined pathway view: a distinct folding pathway through distinct kinetic intermediates. The model implies the existence of a ladder of defined intermediates at equilibrium in the high free-energy space above N (right). The colors represent the set of five cytochrome c foldons common to the native protein (lower left), the equilibrium energy ladder of partially unfolded forms (right), and the kinetic folding pathway. The cooperative foldon units that compose native cytochrome c were first defined by native state hydrogen exchange (HX) studies (see Figure 3) (5). The corresponding ladder of partially unfolded forms was defined by stability labeling HX experiments (40, 41). The kinetic pathway is considered here and in other publications (27, 62). Abbreviations: U, unfolded state; TS, transition state; N, native state.
Recent technology has now finally been able to define, so far for a small number of proteins, the structures of transient folding intermediates and their formation and loss as kinetic folding progresses (21). So far, all show the same behavior. The picture that emerges is summarized in Figure 1. Separately cooperative units of the native structure, known as foldons, form in a reproducible kinetic sequence and are laid down side by side to sequentially build the native protein. In this view, folding intermediates are well-defined structures because the irreducible unit of folding is the cooperative native-like foldon and not separate amino acids. The Levinthal problem is solved by the fact that an initial foldon is sufficiently small that it can be quickly found by a random conformational search, even though the search may be energetically uphill. The subsequent folding pathway is reproducible because the addition of each native-like foldon is guided by prior native-like structure and native-like interactions, akin to well-known folding–upon-binding behavior. The technology that led to the defined pathway view depends on the exploitation of a natural biophysical process that is universally experienced by all proteins, known as hydrogen exchange (HX). This review recounts the development of these capabilities and their current application to the challenging protein folding problem.
HYDROGEN EXCHANGE
The main-chain amide hydrogens of proteins, one in every amino acid (except proline) in every protein molecule, can exchange with the hydrogens of solvent water. Their rate of exchange depends on the variety of protein parameters that interest the biophysicist—local and long-range protein structure, structure change, interactions, dynamics, and energetics. In a real sense, proteins continually emit signals in the language of hydrogen exchange, in a nonperturbing way resolved to the level of individual residues, about all of the things that the biophysicist wishes to know. We need only receive those signals and understand how to interpret them in structural language. These capabilities are now in hand. They depend on fundamental knowledge of the chemistry and structural physics of HX processes and on technological applications that can manipulate and measure protein HX even in difficult conditions such as during kinetic folding.
HX Chemistry
The basic chemistry of HX processes is known (7, 13, 48). The HX rate of unprotected amide hydrogens and its dependence on pH, temperature, neighboring residues, isotope effects, and ionic strength has been accurately calibrated (3, 11, 44). Especially pertinent to present considerations is the dependence of HX rate on pH, as shown in Figure 2. The extreme acid and base pK values of the main-chain amide ensure that exchange of the amide hydrogen can be catalyzed only by hydroxide and hydrogen ion. They have pKs that approach the more extreme amide group pKs and so can catalyze amide protonation and deprotonation reactions. As a result, amide HX rate is proportional to either OH− or H+ ion concentration depending on the pH range being considered, and rates change tenfold per pH unit. Quantitation in Figure 2 shows that the HX rate of the unprotected amide hydrogen is approximately 1 s−1 at pH 7 and 0°C, and the rate goes through a minimum just below pH 3 where exchange halftime at 0°C can be 1 h.
Figure 2.
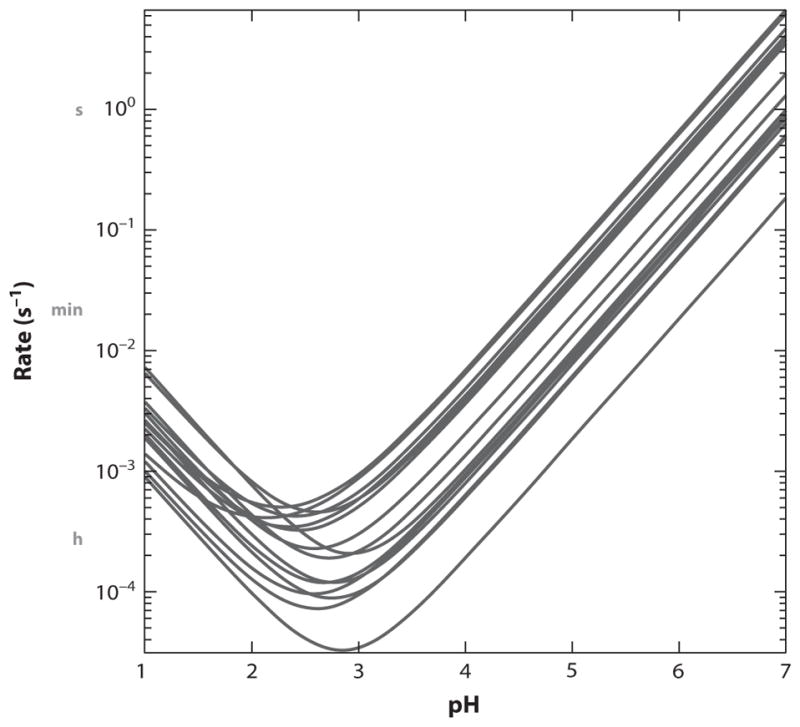
Amide hydrogen exchange (HX) chemistry. Main-chain amide HX is catalyzed by hydroxide ion (right limb) and hydrogen ion (left limb). The HX rate of any given amide hydrogen is modulated also by its two nearest neighbor side chains. The different V-shaped curves illustrate some alternative neighbor combinations (3).
More broadly, chemical HX rates are fortuitously well placed to meet the demands of protein experimentation. Variation from pH 5 to pH 10 leads to amide HX time constants that vary by 105-fold, from milliseconds to minutes (Figure 2). Temperature change between 0°C and 40°C extends the useful range 100-fold. Thus, although HX rates of amides in structured proteins vary from the free-peptide rate (Figure 2) to rates that can be slower by as much as 1010-fold, the easy manipulation of HX time, pH, and temperature through the range where proteins are stable and functional brings the broad extent of protein HX rates into the convenient lab window of milliseconds to one day. The fast rate at high pH makes possible the HX pulse labeling method (below). The slow rate at the pH minimum makes possible the fragment separation method for HX measurement, which reveals the protein folding results discussed here.
HX Structural Physics
The relationship between the structure-based slowing of HX rate and protein structural dynamics is understood in general. In his seminal HX studies, Linderstrøm-Lang set out to search for the reality of Pauling’s hydrogen bonds and the α-helix and β-strand structures that they might stabilize (36, 37). He suggested a simple view of protein HX slowing due to structural protection, as follows (29, 36):
| 1 |
| 2 |
| 3 |
| 4 |
Reaction Scheme 1 assumes that protecting hydrogen bonds dynamically make and break, with opening (kop) and closing (kcl) rate constants as shown. Exchange can occur only in the transient unprotected H-bond broken state and then with a rate approximated by the chemical HX rate kch. The measurable exchange rate is then given by Equation 2. When kcl ≫ kch (EX2 or bimolecular exchange condition), opening is a preequilibrium step and HX rate is given by Equation 2, revealing the equilibrium constant and free energy of the structural opening reaction. This is reasonably correct for unfolding reactions insofar as unfolding brings amides into free solution, as for the reference calibration of kch for fully exposed amides (3). It is not necessarily true for local fluctuations in which exchange in the locally open form may not accurately match kch (38). When kcl ≪ kch (EX1 or monomolecular exchange condition), HX occurs at each opening (Equation 4) and reveals kop. One consequence is that, in the EX2 case, measured HX rates are slower by far than the protein dynamics that determine them.
This apparently simplistic concept of protection and deprotection turns out, with some later extension, to adequately describe protein HX behavior. Structural protection almost always reflects H-bonding (43, 56, 57), and “opening” means H-bond separation and exposure to solvent where normal HX chemistry can occur. Protection by structural burial without H-bonding seems unlikely because such a situation would cost ~4 kcal in unfavorable free energy for each buried but unsatisfied amide (24). Protective H-bond acceptors can include main-chain and side-chain groups and also structurally bound water molecules (not just solvent water) that cannot be easily replaced by OH− or H3O+ ions (56, 57).
HX Prediction
Various workers have attempted theoretical calculations that might predict protein HX rates and describe the detailed structure of the operative open states. Results so far have been unsatisfying, with r2 between observed and predicted HX rates less than 0.5 (57). A fundamental problem is that one does not know how to instruct the calculation to define HX competence. Also, these efforts have tended to focus on HX determined either by local fluctuations or by unfolding reactions, whereas both are usually present.
PROTEIN OPENING REACTIONS
H-bond opening reactions that determine and can therefore be studied by HX are known to include local fluctuations, whole-molecule global unfolding, and subglobal unfolding reactions.
Local Fluctuations
In stable proteins where unfolding reactions are rare, most HX is governed by local fluctuations (26, 38, 43, 56, 57, 67). For example, immediately neighboring protein residues often show very different rates. An earlier view based on studies of allosteric change in hemoglobin was that HX commonly depended on local unfolding (19). In that work, a selective functional labeling method found a number of allosterically sensitive protein segments that experienced locally cooperative unfolding reactions (51). The potentially interesting relationship of that observation to allostery has not been reconciled with more recent site-resolved nuclear magnetic resonance (NMR) studies of non-allosteric proteins, which show that most protein HX is dominated by smaller fluctuations.
Local fluctuations can involve the difficult deformation of a small number of residues rigidly held in secondary structural elements (38) and so can generate surprisingly slow HX, whereas faster HX depends on the easier deformation of residues in more flexible regions. The local fluctuation HX mode is pervasive and probably explains why the patterns of faster and slower sequences of protein residues commonly track the alternating sequence pattern of flexible protein loops and more rigidly structured secondary structural elements. Whether difficult or easy, local fluctuations are small and are insensitive to added denaturant and temperature because they expose little new surface to solvent.
Global Unfolding
The slowest HX in proteins is governed by transient whole-molecule unfolding. After earlier suggestions supported mainly by temperature dependence studies (53, 54), the calibration of unprotected HX rates (3, 11, 45) (kch in Equation 1) made it possible to compute unfolding free energy based on HX rates of the slowest hydrogens in any given protein (Equation 3). The agreement of these values with global stability measured by standard methods as well as their large dependence on denaturant and temperature revealed that proteins experience transient global unfolding/refolding reactions even under stable native conditions (4, 20, 28). One consequence is that proteins may spontaneously unfold and refold many times, in whole or in part, during their lifetime, as considered below. This behavior has numerous implications—for example, transient unfolding may serve as a bridge to certain protein interactions including amyloid formation, chaperonin interactions, domain swapping, and even drug binding.
Subglobal Unfolding
The global unfolding insight (4) led to analogous so-called native state HX experiments that revealed a surprising result. Contrary to their supposed two-state nature, proteins can experience reversible unfolding reactions that are smaller than the global unfolding (5).
Figure 3 summarizes the initial demonstration. The figure plots ΔGop calculated (Equation 3) from NMR-measured HX rates of many cytochrome c (cyt c) residues against denaturant concentration far below the melting transition. Low levels of added denaturant are seen to have no effect on many residues, which are therefore judged to exchange by way of small local fluctuations. As denaturant increases, several sizable unfolding reactions, which previously occurred at an invisibly low level and made no contribution to the measured exchange, are increasingly promoted and come to dominate the HX of the residue amides that they expose. Ultimately, at sufficiently high denaturant, all exchange will become dominated by the global unfolding reaction, but in the present case, a set of subglobal unfoldings, lower on the energy ladder, intervene and come to dominate measurable HX (see the energy ladder in Figure 1).
Figure 3.

Native state hydrogen exchange (HX) results for cytochrome c distinguish subglobal foldon unfolding reactions (high denaturant dependence) from local fluctuational HX (zero denaturant dependence) (2, 5). Unfolding free energy was computed from HX rates measured by 2D nuclear magnetic resonance as a function of low levels of denaturant (Equation 3) and extrapolated to zero denaturant. The different panels show the residues that identified the (a, b) blue and (c) green foldons, and less definitively the (d) yellow and red foldons. The lower-lying foldons were better defined in later work.
In summary, the study of protein HX identifies several kinds of dynamic protein behavior, ranging in size from small fluctuations up through partial and whole-molecule unfolding reactions. Here we are especially interested in the subglobal unfolding units known as foldons, which now appear to play an integral role in the protein folding process.
FOLDONS AND PARTIALLY UNFOLDED FORMS
Discovery
What are the subglobal unfolding reactions? Site-resolved HX measurement by two-dimensional (2D) NMR can identify the amino acids in each concerted unfolding and thus reveal the segments that unfold. Reading upward from the lowest energy unfolding in Figure 3 (see also cyt c structure in Figure 1), the cyt c unfolding units are the large bottom omega loop (black), another omega loop (red), a short stretch of two beta strands (yellow), a sizeable loop plus helix (green), and at the highest unfolding energy a pair of helices (blue). The cooperative unfolding unit shown in blue consists of the paired N-terminal and C-terminal helices, which, although very far apart in the amino acid sequence, dock against each other in the native protein. This is the same foldon unit seen as the first folding step in the initial HX pulse labeling kinetic folding experiments (50). Subsequent work identified one more, lowest energy foldon (infrared, shown as gray, the large bottom omega loop of cyt c (32), which escaped previous measurement owing to its fast exchange and was initially thought to form part of the yellow foldon.
These five cooperative subglobal unfolding units together account for all the secondary structural elements of the cyt c molecule (Figure 1). Analogous results have been found for other proteins studied by HX as a function of denaturant, temperature, and pressure (9, 10, 22, 25, 55, 68). From these results, a whole new concept of the construction of protein molecules emerges with implications for folding and function.
The initial discovery of protein foldons and their possible role in protein folding came from the native state HX results for cyt c just described. The increasingly high-energy unfolding reactions, measured in Figure 3 by ΔGop (Equation 3), also increase in physical extent (surface exposed to solvent), indicated by (d(ΔGop)/d[denaturant]). This was taken to suggest that cyt c unfolding might progress up a ladder of increasingly unfolded states in a sequential stepwise foldon unfolding pathway, as implied in Figure 1 (5, 20).
To test this hypothesis, we performed so-called stability labeling experiments to determine the composition of the partially unfolded forms (PUFs) produced by the various foldon unfolding reactions (41). Stabilizing and destabilizing modifications were placed within each of the different foldons, and the native state HX analysis was repeated. Results show that the infrared foldon, the lowest unit on the energy ladder, unfolds separately. The next higher-energy PUF has the infrared plus red foldon unfolded. Next, the yellow and then the green foldon unfolds. Finally, they are all unfolded together to reach the globally unfolded state. The structure of each foldon and the sequential PUFs are indicated in Figure 1.
These results reveal an equilibrium ladder of PUFs arrayed in the high free-energy space above the native state. Each step up the ladder concertedly unfolds one more cooperative foldon unit. Does the folding process simply represent a reverse progression that steps, one foldon at a time, down the energy ladder?
Foldons and Folding
At equilibrium under native conditions, the native state is obviously the lowest free-energy state available to the protein, and it is the most highly populated. However, it contributes nothing to the measured exchange of protected hydrogens. Structurally protected hydrogens can exchange only when proteins dynamically explore transiently unprotected states that populate the high-energy space above the native protein (Equations 1–4). Thermodynamic principle requires that all possible high-energy states—locally distorted and/or partially unfolded, native-like or misfolded—must be represented in the high-energy space, each at a level governed by its Boltzmann free energy. Among these are all of the intermediate states that govern HX and all that coordinate protein folding. HX measurements provide a unique experimental tool for exploring the high-energy conformational space and for determining the flow-through that defines the major folding flux.
The native state HX results in Figure 3 make visible and define the composition of a small subset of the high-energy states of cyt c. These experiments were done under equilibrium, not kinetic, conditions. A most interesting implication then arises. Each energetically uphill foldon unfolding step must be matched by an equivalent reverse molecular flow down the free-energy ladder (as in Figure 1) or else equilibrium would not be maintained. The downhill sequence can be considered to represent a stepwise kinetic folding pathway (5, 20).
However, this argument needs to be carefully examined. Just as the high-energy space contains all possible nonnative states, it also contains all possible folding pathways. Which among the vast number of possible tracks carries the major share of the folding flux? To address this question, one will have to determine the progression of structures that proteins actually experience during real kinetic folding. The ability to accomplish that goal experimentally had to await the development of a more advanced HX capability.
Foldon Prediction
It is surprising that the great number of theoretical efforts over the years directed at understanding the high-energy protein states and their possible role in protein folding have, in general, not found cooperative foldon units. Two attempts to identify foldons are notable. Soon after the discovery of foldons, Panchenko et al. (47) attempted to compute foldons in many proteins by defining an arbitrary criterion for their existence, reasoning from an inferred requirement of the minimal frustration idea. Foldons might be identified in terms of the maxima in a scan of the ratio of a contiguous segment’s energy stability to the energy variance of that segment’s molten globule states. This approach has not been repeated, and its validity is untested.
More recently Weinkam and Wolynes (65) tested the ability of a modified Gō model simulation to reproduce the known foldons in cyt c, with some success. The Gō model approach used was to inform the computer what the target structure looks like (single associative memory Hamiltonian) and instruct it to promote moves according to the distance from the target. All side chains have the same course-grained structure (Cα, Cβ, O) and contact potential. With respect to understanding protein folding principles, the reasons for this success would be of great interest. The authors attribute the partial success of the calculation to the covalently bound cyt c heme and to the smooth funneled landscape idea. The smooth landscape enters only in a negative way in that nonnative interactions are ignored. The heme did have a major influence in the calculation because it was arbitrarily given outsized influence in its ability to attract every residue throughout the protein to its correct position. However, this property seems unlikely in native cyt c. Further, the folding of other proteins without prosthetic groups is known to depend on the same kind of foldon behavior (27, 62).
HX TECHNOLOGY
The modern capability for experimentally defining the structure and behavior of intermediate protein forms during kinetic folding is rooted in a long history of development of the manipulation and measurement of protein HX. Significant advances along the way have been the HX pulse labeling method (50), the fragment-separation technology (14), and the addition to it of mass spectrometric analysis (69).
Historical Notes
Linderstrøm-Lang and his colleagues (36, 37) initially developed a rather cumbersome method for measuring hydrogen-deuterium (H-D) exchange that depended on extracting protein-bound deuterons into solvent water and determining the density of the water. Soon after, the commercial availability of the radioisotope tritium (from hydrogen-bomb development) together with the development of gel filtration and liquid scintillation technologies made possible the simpler and more accurate hydrogen-tritium (H-T) exchange/gel filtration method (15, 16), which dominated the field for the next 20 years. These methods were limited to HX measurement at the whole molecule level.
The effort to obtain higher resolution took advantage of the slow HX at the pH of minimum rate (Figure 2) to construct a fragmentation-separation analysis designed to read out protein HX behavior at a segment-resolved level (14, 18, 52). In this method, one exposes a protein to H-T exchange, takes samples in time, then drops pH and temperature to the minimum exchange rate condition (pH ~ 2.5, 0°C; Figure 2) where the slow HX loss rate allows some time for sample manipulation and analysis. The protein is quickly fragmented using an acid protease, and the fragments are separated and analyzed for carried tritium. However, the best peptide separation method available at the time, high-performance liquid chromatography (HPLC) alone, was inadequate to separate the many peptides produced by nonspecific acid proteases. Efforts to improve the fragmentation-separation method by adding a mass spectrometry (MS) step to the HPLC peptide separation protocol (17) foundered until the development of electrospray technology (23) made this possible (69). In the meantime, interest in the further development of the fragmentation technology was preempted by the advent of 2D NMR and its ability to measure H-D exchange directly in real time at residue resolution (61, 64). In very recent years, a growing appreciation of the power of HX MS approaches has led to an explosion of interest in its application to many areas of protein science (49).
Pulse Labeling
The usual protein folding study measures some structure-sensitive parameter continuously, such as change in fluorescence as folding proceeds, and then attempts to infer folding events indirectly from the measured kinetic phases, the effect on kinetics of added denaturant, and the like. The HX pulse labeling method can more unambiguously define the extreme structural events that occur during kinetic folding by providing a time series of structurally revealing snapshots of the population of partially folded intermediates as they form and go forward, or revert, during the milliseconds to minutes timescale of the folding process.
Initial applications used H-D exchange pulse labeling to discern the identity of transiently formed intermediates during the folding of ribonuclease A (59, 60) and cyt c (50). The folding experiment starts with the test protein unfolded and fully deuterated in D2O. As diagrammed in Figure 4a, the sample is diluted into folding conditions in H2O. At a folding pH of 5 and 10°C, the HX halftime of unprotected amides is ~30 s, so that, as folding proceeds, little background D-to-H exchange occurs in the still unfolded population. After any given folding time, the sample is labeled in a structure-sensitive way in a second mixing step that imposes a short exposure to a fast HX condition. For example, in a high-pH pulse at pH 10 and 10°C, the HX halftime of unprotected amides is ~0.5 ms. During a brief pulse (10 to 50 ms), amides not yet protected by reforming H-bonded structure become H-labeled, whereas amides protected in already refolded regions tend to remain D-labeled.
Figure 4.

Hydrogen exchange (HX) mass spectrometry (MS) pulse labeling experiments with apoflavodoxin (Z-Y Kan, W.K. Lim, L. Mayne, S.W. Englander, unpublished data). (a) Experimental setup. (b) Peptide fragments obtained. Note that the high degree of peptide overlap provides many internal consistency checks, both in verification of peptide identity and in HX data checking. Also, any given residue is presented redundantly in many different peptide-overlapping regions and peptide overhangs, promoting the ability of the HDsite analysis (31) to obtain near-single residue resolution. (c) The time evolution of three illustrative peptide envelopes. (d) Kinetic folding seen for many peptides distinguishes five different folding units; a sixth group remains unprotected in the native protein. The peptides shown in black and red exhibit back unfolding during the labeling pulse, which transfers amplitude from the heavier to the lighter envelope (EX1 HX), and independently demonstrates their separately cooperative unfolding nature. Abbreviations: DL, delay line; ESI-MS, electrospray ionization mass spectrometry; HPLC, high-performance liquid chromatography.
Analysis
The analysis of pulse-labeled samples by NMR can identify H-labeled amides and thus reveal the specific residues that have become protected in structure formed during the test folding period. However, routine NMR analysis is limited to proteins that are fairly small, are highly soluble, can be prepared in quantity, can be labeled with stable isotopes, and produce many clear spectral cross peaks. Further, the selectively labeled protein must be allowed to complete folding to its native state, and then must be concentrated (~100-fold) for the NMR analysis. During this extended period, fast exchanging H-label will be lost.
Alternatively, one can use the fragment-separation method supplemented by MS separation and analysis. This approach requires four orders of magnitude less protein per sample than is required for NMR, and it is applicable to large proteins. Pulse labeling is done as before, but then exchange labeling is quenched in a third mix to pH ~2.5 (Figure 2, minimum loss rate during the analysis) and the sample is immediately injected into an online flow system at 0°C. Passage through the online system proteolyzes the protein into many peptides (immobilized pepsin column, ~30 s), roughly separates the peptides by fast reverse phase HPLC (<15 min total), and continually injects the eluting peptides into a mass spectrometer by electrospray. Analysis of the many resulting MS spectra (~1,000) taken through the HPLC elution can then identify (30) hundreds of different peptides (Figure 4b) and measure the amount of D-label on each one (Figure 4c). Each peptide fragment monitors the folding kinetics of that peptide segment in the refolding protein in terms of the increasing population fraction that is protected at the folding time points selected by the labeling pulse.
The analysis described here profited from recent advances in HX MS technology. Good technique (42) and advanced data analysis [the ExMS program (30)] can capture many sequentially overlapping peptide fragments (e.g., Figure 4b). Proper attention to the details of HX chemistry reduces information loss owing to back exchange during sample analysis (63). A special site-resolution analysis can interpret the data to near single amino acid resolution [HDsite program (31)].
PROTEIN FOLDING
From Mass Spectrometry to a Pathway
Figure 4c shows some typical peptide mass envelopes from HX MS pulse labeling folding experiments, in this case with the 169 residue α + β protein apoflavodoxin. The MS spectrum for each peptide appears as an isotopic envelope composed of peptide molecules that carry differing numbers of 13C atoms (constant) and 2H atoms (variable with folding time). The monoisotopic mass, with no 13C or 2H atoms, is set at zero on the mass axis. As folding time proceeds in a series of D-to-H pulse labeling experiments, the envelopes move (top to bottom) from a lighter mass, indicating complete 2H- to 1H-labeling in the pulse (no protection), to a heavier folded condition that protects a number of the initially deuterated sites.
The time-dependent behavior of the peptide mass envelopes provides direct information on the character of the protein folding process. If HX protection occurred in one or a few residues at a time, this would be seen as a slide of each mass envelope in time from an unprotected (lighter) state to more protected (heavier) states. Rather, the conversion is seen as a bimodal envelope. D-occupancy jumps from the lighter initially unprotected state to the folded and well-protected D-labeled state. Thus, for any given protein segment, folding protects multiple amides all together in a concerted structure formation step. The bottom frames in Figure 4c show results from an equivalent experiment in which the fully folded native protein was passed through the pulse labeling experiment and then analyzed by fragment separation. For each peptide, the number of sites that become protected in its concerted folding step is closely equal to the number that is naturally protected from pulse labeling in the folded native protein. This suggests that the structure formed in each concerted folding step is locally native like.
If different molecules in the protein population folded through different routes, as in the multipath energy landscape model, any given protein segment would be seen to fold fractionally over time. Rather, for any given segment, the data show a single concerted structure formation step. All protein molecules fold any given segment at the same rate. At the other extreme, if the whole protein folded in a stepwise two-state manner, all the peptides throughout the protein would become protected in the same concerted kinetic step. Rather, peptides that represent different protein segments fold at different times, and the entire protein population (>95%) experiences the same step. The halftime for folding of the three segments displayed in Figure 4c is 300 ms (blue), 1 s (green), and 5 s (yellow). Any segment once folded remains in place through later folding steps elsewhere in the protein.
In summary, primary unprocessed peptide-level HX MS results for apoflavodoxin folding directly show that any given protein segment folds in a concerted stepwise way, each folding step engages the entire refolding protein population, different regions fold at different times, and they follow in a defined order. Many overlapping peptides consistently confirm each of these behaviors. These are the characteristics of a sequential step-by-step population-wide folding pathway.
From Peptides to Foldons
Figure 4d plots the time-dependent appearance of native-like protection in many flavodoxin peptides. Similar kinetic folding traces for RNase H (27), maltose binding protein (MBP) (62), cyt c, and a variant of cellular retinoic acid binding protein (CRABP) P85A are shown in Figure 5. The primary HX MS pulse labeling data for the individual peptides in these proteins have the same character as just described for apoflavodoxin and thus independently repeat the defined pathway demonstration. The kinetic folding plots for many peptides in Figures 4d and 5a–e display the protein segments that fold together and thus indicate apparent foldon units.
Figure 5.

Hydrogen exchange mass spectrometry pulse labeling results for peptides from (a, b) RNase H (27), (c) MBP (62), (d) cyt c (W. Hu, Z-Y Kan, L. Mayne, S.W. Englander, unpublished data), and (e) CRABP P85A (W. Hu, Z-Y Kan, L. Mayne L. Gierasch, A.K. Thakur, S.J. Eyles & S.W. Englander, unpublished data). The energy ladder of states follows the same color coding as above, arranged in spectral order of increasing energy. The black curves for MBP trace the late-stage folding of sites that showed significant protection in the initial prefolding protein collapse. Removal of the single CRABP proline (P85A) makes folding appear to be two-state. For all proteins, the colors show the time course for folding of the blue, green, yellow, red, and infrared foldons, named in spectroscopic order of decreasing unfolding free energy. Abbreviations: CRABP, cellular retinoic acid binding protein; cyt c, cytochrome c; MBP, maltose binding protein; RNase H, ribonuclease H.
The different peptides for any given protein fall into recognizably distinct kinetic groupings (foldons), emphasized by the color coding. The ability to distinguish different kinetic groups that follow closely in time requires high data accuracy. Analytic accuracy is promoted by the fact that one needs to quantify only the relative amplitude of protected and unprotected envelopes that appear in the same HX MS spectrum (e.g., Figure 4c). Note, however, that any given peptide can present with greater or lesser accuracy depending on how well separated the heavy and light fractions are (see Figure 4c). In the kinetic traces shown here, the most accurate data are plotted. Peptides that are poorly separated or span more than one concerted foldon and so would contribute higher levels of noise are easily identified by visual inspection of the primary MS data, and excluding them is proper.
Comparison with the native protein finds that each colored kinetic set represents one or more segments that may be widely separated in the primary structure but form contiguous structure in the native protein. Thus, they define foldon units throughout the protein and specify their formation kinetics. In agreement with implications drawn from the primary peptide-level HX MS results, the behavior seen for these proteins points to straightforward classical pathways that sequentially assemble foldon elements of the native protein.
On Kinetic Discrimination
These results also reveal surprisingly idiosyncratic kinetic patterns. This unpredictable variability more broadly informs why the interpretation of less revealing kinetic folding experiments (fluorescence, etc.) has been so difficult. It appears that the kinetic separation of pathway steps can reflect condition-dependent kinetic barriers rather than differences in the structural intermediate-formation steps themselves, which are hard-wired into the foldon organization of the native protein.
In the early expression of the defined pathway model based on cyt c results (39), a proposed principle known as sequential stabilization suggested that prior structure can be expected to guide and stabilize the folding of incoming neighboring segments in assisted-search folding steps. In this view, one might expect that the first pathway step, dependent on an unguided random search, is the most difficult and that subsequent assisted-search steps should go faster. When the rate constant for an earlier kinetic step is slower than for later steps, this can lead to apparent two-state folding as is often noted in the literature, especially for small proteins. See, for example, CRABP P85A in Figure 5e. In such cases, the inability to kinetically distinguish intermediate folding steps is often (mis)interpreted in terms of the supposed absence of folding intermediates rather than in terms of the more likely mutability in the size of kinetic barriers.
In some of the present cases, discrimination of different folding steps is prohibited by poor kinetic separation (e.g., MBP in Figure 5c), but it can be fortuitously aided by other kinetic effects. For cyt c (Figure 5d), the foldon shown in blue is set off from later steps by a kinetic barrier that requires reversal of a known histidine to heme misligation. Later steps are kinetically separated by effects due to partial proline mis-isomerization. A previously unforeseen effect can cause already formed structures to experience partial transient unfolding during the labeling pulse. A segment can then become labeled (EX1 HX behavior), artifactually contribute to the amplitude of the unprotected population fraction, and so appear not to reach 100% protected amplitude. The back unfolding effect is seen for the later folding steps in apoflavodoxin (Figure 4d) and for the foldon shown in yellow in RNase H (Figure 5a). The same effect can be demonstrated in experiments with the native protein. These cases provide an independent avenue for distinguishing foldon units and determining their identity and their kinetic properties.
SUMMARY POINTS.
Advanced HX MS methodology can now detect the structural events that govern protein folding in real time during kinetic folding.
This review describes these advances and shows current results for a number of proteins.
Results show that proteins fold through distinct native-like intermediates in a distinct pathway and point to the determining principles.
Proteins fold in a stepwise way because they are constructed of cooperative foldon units that experience a concerted transition from their unfolded conformation to their near-native conformation.
The sequence of folding pathway steps is determined by a sequential stabilization principle; prior native-like structure promotes the formation of interacting native-like structure mediated by native-like interactions.
Energy landscape models of protein folding, framed before the discovery of the cooperative foldon unit structure of proteins, envision a dependence on smaller noncooperative folding units and therefore many alternative independent pathways. Present results project a different picture of the energy landscape, namely some variant of Figure 1. The not-yet-folded regions broaden each basin and account for the uphill search-dependent kinetic barriers.
FUTURE ISSUES.
The generality of the defined pathway model needs to be tested through the application of these and related techniques to proteins over a range of sizes, topologies, and conditions.
Foldons in various proteins and structural contexts need to be defined and their determining principles understood.
The kinetic events that promote and often separate folding pathway steps need to be worked out.
The great amount of previous experimental and theoretical research on the protein folding problem needs to be reconciled with the conclusions described here.
Acknowledgments
This work is supported by research grants from the NIH (GM31847), NSF (MCB1020649), and The Mathers Charitable Foundation (to S.W.E.).
Footnotes
DISCLOSURE STATEMENT
The authors are not aware of any affiliations, memberships, funding, or financial holdings that might be perceived as affecting the objectivity of this review.
LITERATURE CITED
- 1.Anfinsen CB, Haber E, Sela M, White FH., Jr The kinetics of formation of native ribonuclease during oxidation of the reduced polypeptide chain. PNAS. 1961;47:1309–14. doi: 10.1073/pnas.47.9.1309. [DOI] [PMC free article] [PubMed] [Google Scholar]
- 2.Bai Y, Englander SW. Future directions in folding: the multi-state nature of protein structure. Proteins. 1996;24:145–51. doi: 10.1002/(SICI)1097-0134(199602)24:2<145::AID-PROT1>3.0.CO;2-I. [DOI] [PubMed] [Google Scholar]
- 3.Bai Y, Milne JS, Mayne L, Englander SW. Primary structure effects on peptide group hydrogen exchange. Proteins. 1993;17:75–86. doi: 10.1002/prot.340170110. [DOI] [PMC free article] [PubMed] [Google Scholar]
- 4.Bai Y, Milne JS, Mayne L, Englander SW. Protein stability parameters measured by hydrogen exchange. Proteins. 1994;20:4–14. doi: 10.1002/prot.340200103. [DOI] [PubMed] [Google Scholar]
- 5.Bai Y, Sosnick TR, Mayne L, Englander SW. Protein folding intermediates: native-state hydrogen exchange. Science. 1995;269:192–97. doi: 10.1126/science.7618079. [DOI] [PMC free article] [PubMed] [Google Scholar]
- 6.Baldwin RL. The search for folding intermediates and the mechanism of protein folding. Annu Rev Biophys. 2008;37:1–21. doi: 10.1146/annurev.biophys.37.032807.125948. [DOI] [PubMed] [Google Scholar]
- 7.Baldwin RL. Early days of protein hydrogen exchange: 1954–1972. Proteins. 2011;79:2021–26. doi: 10.1002/prot.23039. [DOI] [PubMed] [Google Scholar]
- 8.Bieri O, Wildegger G, Bachmann A, Wagner C, Kiefhaber T. A salt-induced kinetic intermediate is on a new parallel pathway of lysozyme folding. Biochemistry. 1999;38:12460–70. doi: 10.1021/bi9909703. [DOI] [PubMed] [Google Scholar]
- 9.Bollen YJ, Kamphuis MB, van Mierlo CP. The folding energy landscape of apoflavodoxin is rugged: Hydrogen exchange reveals nonproductive misfolded intermediates. PNAS. 2006;103:4095–100. doi: 10.1073/pnas.0509133103. [DOI] [PMC free article] [PubMed] [Google Scholar]
- 10.Chamberlain AK, Marqusee S. Comparison of equilibrium and kinetic approaches for determining protein folding mechanisms. Adv Protein Chem. 2000;53:283–328. doi: 10.1016/s0065-3233(00)53006-x. [DOI] [PubMed] [Google Scholar]
- 11.Connelly GP, Bai Y, Jeng MF, Englander SW. Isotope effects in peptide group hydrogen exchange. Proteins. 1993;17:87–92. doi: 10.1002/prot.340170111. [DOI] [PubMed] [Google Scholar]
- 12.Dill KA, Chan HS. From Levinthal to pathways to funnels. Nat Struct Biol. 1997;4:10–19. doi: 10.1038/nsb0197-10. [DOI] [PubMed] [Google Scholar]
- 13.Eigen M. Proton transfer, acid-base catalysis, and enzymatic hydrolysis. Angew Chem Int Ed Engl. 1964;3:1–19. [Google Scholar]
- 14.Englander JJ, Rogero JR, Englander SW. Protein hydrogen exchange studied by the fragment separation method. Anal Biochem. 1985;147:234–44. doi: 10.1016/0003-2697(85)90033-8. [DOI] [PMC free article] [PubMed] [Google Scholar]
- 15.Englander SW. A hydrogen exchange method using tritium and Sephadex. Application to ribonuclease. Biochemistry. 1963;2:798–807. doi: 10.1021/bi00904a030. [DOI] [PMC free article] [PubMed] [Google Scholar]
- 16.Englander SW. Protein folding intermediates and pathways studied by hydrogen exchange. Annu Rev Biophys Biomol Struct. 2000;29:213–38. doi: 10.1146/annurev.biophys.29.1.213. [DOI] [PubMed] [Google Scholar]
- 17.Englander SW. Hydrogen exchange and mass spectrometry: a historical perspective. J Am Soc Mass Spectrom. 2006;17:1481–89. doi: 10.1016/j.jasms.2006.06.006. [DOI] [PMC free article] [PubMed] [Google Scholar]
- 18.Englander SW, Calhoun DB, Englander JJ, Kallenbach NR, Liem RKH, et al. Individual breathing reactions measured in hemoglobin by hydrogen exchange methods. Biophys J. 1980;32:577–89. doi: 10.1016/S0006-3495(80)84991-5. [DOI] [PMC free article] [PubMed] [Google Scholar]
- 19.Englander SW, Englander JJ. Functional labeling in hemoglobin. In: Clementi E, Sarma RH, editors. Structure and Dynamics: Nucleic Acids and Proteins. Guilderland, NY: Adenine; 1983. pp. 421–34. [Google Scholar]
- 20.Englander SW, Kallenbach NR. Hydrogen exchange and structural dynamics of proteins and nucleic acids. Q Rev Biophys. 1983;16:521–655. doi: 10.1017/s0033583500005217. [DOI] [PubMed] [Google Scholar]
- 21.Englander SW, Mayne L. The nature of protein folding pathways. PNAS. 2014;111:15873–80. doi: 10.1073/pnas.1411798111. [DOI] [PMC free article] [PubMed] [Google Scholar]
- 22.Feng H, Zhou Z, Bai Y. A protein folding pathway with multiple folding intermediates at atomic resolution. PNAS. 2005;102:5026–31. doi: 10.1073/pnas.0501372102. [DOI] [PMC free article] [PubMed] [Google Scholar]
- 23.Fenn JB, Mann M, Meng CK, Wong SF, Whitehouse CM. Electrospray ionization for mass spectrometry of large biomolecules. Science. 1989;246:64–71. doi: 10.1126/science.2675315. [DOI] [PubMed] [Google Scholar]
- 24.Fleming PJ, Rose GD. Do all backbone polar groups in proteins form hydrogen bonds? Protein Sci. 2005;14:1911–17. doi: 10.1110/ps.051454805. [DOI] [PMC free article] [PubMed] [Google Scholar]
- 25.Fuentes EJ, Wand AJ. Local stability and dynamics of apocytochrome b562 examined by the dependence of hydrogen exchange on hydrostatic pressure. Biochemistry. 1998;37:9877–83. doi: 10.1021/bi980894o. [DOI] [PubMed] [Google Scholar]
- 26.Hernandez G, LeMaster DM. NMR analysis of native-state protein conformational flexibility by hydrogen exchange. Methods Mol Biol. 2009;490:285–310. doi: 10.1007/978-1-59745-367-7_12. [DOI] [PubMed] [Google Scholar]
- 27.Hu W, Walters BT, Kan ZY, Mayne L, Rosen LE, et al. Stepwise protein folding at near amino acid resolution by hydrogen exchange and mass spectrometry. PNAS. 2013;110:7684–89. doi: 10.1073/pnas.1305887110. [DOI] [PMC free article] [PubMed] [Google Scholar]
- 28.Huyghues-Despointes BM, Scholtz JM, Pace CN. Protein conformational stabilities can be determined from hydrogen exchange rates. Nat Struct Biol. 1999;6:910–12. doi: 10.1038/13273. [DOI] [PubMed] [Google Scholar]
- 29.Hvidt A, Nielsen SO. Hydrogen exchange in proteins. Adv Protein Chem. 1966;21:287–386. doi: 10.1016/s0065-3233(08)60129-1. [DOI] [PubMed] [Google Scholar]
- 30.Kan ZY, Mayne L, Chetty PS, Englander SW. ExMS: data analysis for HX-MS experiments. J Am Soc Mass Spectrom. 2011;22:1906–15. doi: 10.1007/s13361-011-0236-3. [DOI] [PMC free article] [PubMed] [Google Scholar]
- 31.Kan ZY, Walters BT, Mayne L, Englander SW. Protein hydrogen exchange at residue resolution by proteolytic fragmentation mass spectrometry analysis. PNAS. 2013;110:16438–43. doi: 10.1073/pnas.1315532110. [DOI] [PMC free article] [PubMed] [Google Scholar]
- 32.Krishna MMG, Lin Y, Rumbley JN, Englander SW. Cooperative omega loops in cytochrome c: role in folding and function. J Mol Biol. 2003;331:29–36. doi: 10.1016/s0022-2836(03)00697-1. [DOI] [PubMed] [Google Scholar]
- 33.Leopold PE, Montal M, Onuchic JN. Protein folding funnels: a kinetic approach to the sequence-structure relationship. PNAS. 1992;89:8721–25. doi: 10.1073/pnas.89.18.8721. [DOI] [PMC free article] [PubMed] [Google Scholar]
- 34.Levinthal C. Are there pathways for protein folding? J Chim Phys. 1968;65:44–45. [Google Scholar]
- 35.Levinthal C. How to fold graciously. Presented at Mossbauer Spectrosc. in Biol. Syst; Monticello, IL: University of Illinois Bulletin; 1969. [Google Scholar]
- 36.Linderstrøm-Lang K. Deuterium exchange and protein structure. In: Neuberger A, editor. Symposium on Protein Structure. London: Methuen; 1958. pp. 23–34. [Google Scholar]
- 37.Linderstrøm-Lang KU, Schellman JA. Protein structure and enzyme activity. In: Boyer PD, Lardy H, Myrback K, editors. The Enzymes. New York: Academic; 1959. pp. 443–510. [Google Scholar]
- 38.Maity H, Lim WK, Rumbley JN, Englander SW. Protein hydrogen exchange mechanism: local fluctuations. Protein Sci. 2003;12:153–60. doi: 10.1110/ps.0225803. [DOI] [PMC free article] [PubMed] [Google Scholar]
- 39.Maity H, Maity M, Englander SW. How cytochrome c folds, and why: submolecular foldon units and their stepwise sequential stabilization. J Mol Biol. 2004;343:223–33. doi: 10.1016/j.jmb.2004.08.005. [DOI] [PubMed] [Google Scholar]
- 40.Maity H, Maity M, Krishna MM, Mayne L, Englander SW. Protein folding: the stepwise assembly of foldon units. PNAS. 2005;102:4741–46. doi: 10.1073/pnas.0501043102. [DOI] [PMC free article] [PubMed] [Google Scholar]
- 41.Maity M, Maity H, Englander SW. A stepwise sequential folding/unfolding pathway in cytochrome c. Biophys J. 2004;86(Suppl):498A. [Google Scholar]
- 42.Mayne L, Kan ZY, Chetty PS, Ricciuti A, Walters BT, Englander SW. Many overlapping peptides for protein hydrogen exchange experiments by the fragment separation-mass spectrometry method. J Am Soc Mass Spectrom. 2011;22:1898–905. doi: 10.1007/s13361-011-0235-4. [DOI] [PMC free article] [PubMed] [Google Scholar]
- 43.Milne JS, Mayne L, Roder H, Wand AJ, Englander SW. Determinants of protein hydrogen exchange studied in equine cytochrome c. Protein Sci. 1998;7:739–45. doi: 10.1002/pro.5560070323. [DOI] [PMC free article] [PubMed] [Google Scholar]
- 44.Molday RS, Englander SW, Kallen RG. Primary structure effects on peptide group hydrogen exchange. Biochemistry. 1972;11:150–58. doi: 10.1021/bi00752a003. [DOI] [PubMed] [Google Scholar]
- 45.Molday RS, Kallen RG. Substituent effects on amide hydrogen exchange rates in aqueous solution. J Am Chem Soc. 1972;94:6739–45. [Google Scholar]
- 46.Nickson AA, Wensley BG, Clarke J. Take home lessons from studies of related proteins. Curr Opin Struct Biol. 2013;23:66–74. doi: 10.1016/j.sbi.2012.11.009. [DOI] [PMC free article] [PubMed] [Google Scholar]
- 47.Panchenko AR, Luthey-Schulten Z, Wolynes PG. Foldons, protein structural modules, and exons. PNAS. 1996;93:2008–13. doi: 10.1073/pnas.93.5.2008. [DOI] [PMC free article] [PubMed] [Google Scholar]
- 48.Perrin CL, Lollo CP. Mechanisms of NH proton exchange in amide and proteins: solvent effects and solvent accessibility. J Am Chem Soc. 1984;106:2754–57. [Google Scholar]
- 49.Pirrone GF, Iacob RE, Engen JR. Applications of hydrogen/deuterium exchange MS from 2012 to 2014. Anal Chem. 2015;87:99–118. doi: 10.1021/ac5040242. [DOI] [PMC free article] [PubMed] [Google Scholar]
- 50.Roder H, Elöve GA, Englander SW. Structural characterization of folding intermediates in cytochrome c by H-exchange labelling and proton NMR. Nature. 1988;335:700–4. doi: 10.1038/335700a0. [DOI] [PMC free article] [PubMed] [Google Scholar]
- 51.Rogero JR, Englander JJ, Englander SW. Individual breathing reactions measured by functional labeling and hydrogen exchange methods. Methods Enzymol. 1986;131:508–17. doi: 10.1016/0076-6879(86)31053-x. [DOI] [PubMed] [Google Scholar]
- 52.Rosa JJ, Richards FM. An experimental procedure for increasing the structural resolution of chemical hydrogen exchange measurements on proteins: application to ribonuclease S peptide. J Mol Biol. 1979;133:399–416. doi: 10.1016/0022-2836(79)90400-5. [DOI] [PubMed] [Google Scholar]
- 53.Rosenberg A, Chakravarti K. Studies of hydrogen exchange in proteins. I The exchange kinetics of bovine carbonic anhydrase. J Biol Chem. 1968;243:5193–201. [PubMed] [Google Scholar]
- 54.Rosenberg A, Enberg J. Studies of hydrogen exchange in proteins. II The reversible thermal unfolding of chymotrypsinogen A as studied by exchange kinetics. J Biol Chem. 1969;244:6153–59. [PubMed] [Google Scholar]
- 55.Silverman JA, Harbury PB. The equilibrium unfolding pathway of a (β/α)8 barrel. J Mol Biol. 2002;324:1031–40. doi: 10.1016/s0022-2836(02)01100-2. [DOI] [PubMed] [Google Scholar]
- 56.Skinner JJ, Lim WK, Bedard S, Black BE, Englander SW. Protein dynamics viewed by hydrogen exchange. Protein Sci. 2012;21:996–1005. doi: 10.1002/pro.2081. [DOI] [PMC free article] [PubMed] [Google Scholar]
- 57.Skinner JJ, Lim WK, Bedard S, Black BE, Englander SW. Protein hydrogen exchange: testing current models. Protein Sci. 2012;21:987–95. doi: 10.1002/pro.2082. [DOI] [PMC free article] [PubMed] [Google Scholar]
- 58.Sosnick TR, Barrick D. The folding of single domain proteins—have we reached a consensus? Curr Opin Struct Biol. 2011;21:12–24. doi: 10.1016/j.sbi.2010.11.002. [DOI] [PMC free article] [PubMed] [Google Scholar]
- 59.Udgaonkar JB, Baldwin RL. Early folding intermediate of ribonuclease A. PNAS. 1990;87:8197–201. doi: 10.1073/pnas.87.21.8197. [DOI] [PMC free article] [PubMed] [Google Scholar]
- 60.Udgaonkar JB, Baldwin RL. Nature of the early folding intermediate of ribonuclease A. Biochemistry. 1995;34:4088–96. doi: 10.1021/bi00012a027. [DOI] [PubMed] [Google Scholar]
- 61.Wagner G, Wüthrich K. Amide proton exchange and surface conformation of BPTI in solution: studies with 2D NMR. J Mol Biol. 1982;160:343–61. doi: 10.1016/0022-2836(82)90180-2. [DOI] [PubMed] [Google Scholar]
- 62.Walters BT, Mayne L, Hinshaw JR, Sosnick TR, Englander SW. Folding of a large protein at high structural resolution. PNAS. 2013;110:18898–903. doi: 10.1073/pnas.1319482110. [DOI] [PMC free article] [PubMed] [Google Scholar]
- 63.Walters BT, Ricciuti A, Mayne L, Englander SW. Minimizing back exchange in the hydrogen exchange-mass spectrometry experiment. J Am Soc Mass Spectrom. 2012;23:2132–39. doi: 10.1007/s13361-012-0476-x. [DOI] [PMC free article] [PubMed] [Google Scholar]
- 64.Wand AJ, Roder H, Altman S, Englander SW. Amide proton exchange in reduced and oxidized cytochrome c by 2-dimensional NMR. Presented at Annu. Meet. Biophys. Soc., 29th; Feb. 24–28; Baltimore, MD. 1985. [Google Scholar]
- 65.Weinkam P, Zong C, Wolynes PG. A funneled energy landscape for cytochrome c directly predicts the sequential folding route inferred from hydrogen exchange experiments. PNAS. 2005;102:12401–6. doi: 10.1073/pnas.0505274102. [DOI] [PMC free article] [PubMed] [Google Scholar]
- 66.Wolynes PG, Onuchic JN, Thirumalai D. Navigating the folding routes. Science. 1995;267:1619–20. doi: 10.1126/science.7886447. [DOI] [PubMed] [Google Scholar]
- 67.Woodward CK, Hilton BD, Tuchsen E. Hydrogen exchange and the dynamic structure of proteins. Mol Cell Biochem. 1982;48:135–60. doi: 10.1007/BF00421225. [DOI] [PubMed] [Google Scholar]
- 68.Yan S, Kennedy SD, Koide S. Thermodynamic and kinetic exploration of the energy landscape of Borrelia burgdorferi OspA by native-state hydrogen exchange. J Mol Biol. 2002;323:363–75. doi: 10.1016/s0022-2836(02)00882-3. [DOI] [PubMed] [Google Scholar]
- 69.Zhang Z, Smith DL. Determination of amide hydrogen exchange by mass spectrometry: a new tool for protein structure elucidation. Protein Sci. 1993;2:522–31. doi: 10.1002/pro.5560020404. [DOI] [PMC free article] [PubMed] [Google Scholar]