

SUMMARY
A complete, 52-protein, 2.5 million Dalton, Mediator-RNA polymerase II pre-initiation complex (Med-PIC) was assembled and analyzed by cryo-electron microscopy and by chemical cross-linking and mass spectrometry. The resulting complete Med-PIC structure reveals two components of functional significance, absent from previous structures, a protein kinase complex and the Mediator-activator interaction region. It thereby shows how the kinase and its target, the C-terminal domain of the polymerase, control Med-PIC interaction and transcription.
ETOC BLURB
Visualizing a complete Mediator-RNA polymerase II pre-initiation complex highlights the importance of the pol II C-terminal domain (CTD) on complex formation, suggesting a model of the CTD choreography during transcription initiation.

INTRODUCTION
Mediator, an assembly of more than 20 proteins, is required for the regulation of RNA polymerase II (pol II) transcription ((Flanagan et al., 1991; Kim et al., 1994; Thompson and Young, 1995), reviewed in (Kornberg, 2005)). Mediator interacts with transcriptional activator proteins and also directly contacts pol II, which assembles with the general transcription factors (GTFs) TFIIA, -B, -D, -E, -F, -H, and -S in a pre-initiation complex (PIC). Mediator binds to the CTD, a seven-amino-acid sequence repeated 26 times at the C-terminus of the largest subunit of pol II. Phosphorylation of the CTD by TFIIK (a subcomplex of TFIIH) prevents Mediator-binding (Feaver et al., 1994; Svejstrup et al., 1997; Wong et al., 2014). A cycle of CTD phosphorylation and dephosphorylation controls Mediator-pol II interaction and the regulation of transcription.
Insight into the molecular basis of Mediator activity has been sought from structural studies. Mediator is divided in three modules, termed Head, Middle, and Tail (Asturias et al., 1999). High-resolution structures of the Head module (Imasaki et al., 2011; Lariviere et al., 2012), of a Head-CTD complex (Robinson et al., 2012), and of small domains of the Middle module (Baumli et al., 2005; Koschubs et al., 2009) have been determined by X-ray crystallography. An electron density map of the entire Mediator at about 18 Å resolution was determined by cryo-electron microscopy (cryo-EM) (Tsai et al., 2014). Protein-protein contacts were identified by chemical cross-linking (Lariviere et al., 2013; Robinson et al., 2015). The high-resolution structures, cryo-EM map, and cross-linking data were combined in a comprehensive manner with the use of Integrative Modeling Platform software. The resulting architectural model of the complete Mediator (Robinson et al., 2015) was consistent not only with the input data but with all information available from other sources, including immunolabeling (Tsai et al., 2014; Wang et al., 2014), two-hybrid analysis (Guglielmi et al., 2004; Ito et al., 2001; Uetz et al., 2000) and subcomplex isolation (Beve et al., 2005; Zhang et al., 2004).
Structural information on Mediator-pol II interaction is limited to cryo-EM of subcomplexes: the Head module bound to pol II and the small GTFs (Cai et al., 2012); and the Head module and small subunits of the Middle module bound to pol II and the small GTFs (“core Med-pol II complex” (Plaschka et al., 2015)). These complexes contained about half the mass of the Mediator and about half the mass of the PIC. They lacked the Tail module, involved in transcriptional regulation, and they lacked the large GTFs, including the CTD kinase TFIIK. The previous structures have therefore given little insight into Mediator function. The mechanism of transcriptional regulation by Mediator and the molecular basis of the CTD cycle have remained obscure.
We report here on the assembly and structure determination of a complete Mediator-PIC complex. Assembly was accomplished by modification of a procedure that was previously developed for the PIC, and which led to a cryo-EM map of the PIC at 6–11 Å resolution (Murakami et al., 2015). Notably absent from the map was TFIIK, presumably due to motion or disorder. Our complete Mediator-PIC structure reveals all components of both Mediator and the PIC and elucidates their roles in the regulation of transcription.
RESULTS
Assembly of a complete Mediator-PIC (Med-PIC) complex and cryo-EM analysis
Mediator was isolated from yeast as a complete 21-subunit complex and incorporated in the procedure previously developed for assembly of the pol II PIC (Figure 1A). The procedure entails combining all GTFs except TFIIF with promoter DNA in a solution of high ionic strength, dialysis to moderate ionic strength, addition of a pol II – TFIIF complex, dialysis to physiologic conditions, and isolation by glycerol gradient sedimentation. Mediator was introduced after the first dialysis step, and in some preparations, TFIIS and the transcriptional activator protein Gcn4 were added as well. The resulting Med-PIC complex sedimented faster than the PIC alone (Figure 1B), contained equimolar amounts of all 52 Mediator and PIC polypeptides (Figure 1C, Table S2), and exhibited transcriptional activity comparable to that obtained with the PIC alone (Figure 1D).
Figure 1. Assembly and characterization of the Med-PIC complex.

(A) Assembly pathway of the Med-PIC complex. Color scheme here and throughout: Mediator Head (aquamarine), Middle (gold), Tail (brown) as well as Pol II (grey), TFIIA (cyan), TFIIB (red), TFIIH (orange), TFIIE (magenta), TFIIF (blue) and TBP (green). (B) Glycerol gradient sedimentation of Med-PIC (upper) and PIC (lower). SDS-PAGE of gradient fractions and of Mediator, TFIIH and TBP-IIB-IIA are shown. (C) SDS-PAGE of the 52-subunit yeast Med-PIC complex (left) and the 21-subunit yeast Mediator complex for reference (right). (D) Transcripts produced from peak gradient fractions for Med-PIC complex and PIC, with and without TBP as indicated, analyzed by gel electrophoresis and autoradiography. Major transcripts are slightly larger than a 73 residue marker (position indicated on the left)
Cryo-EM images of 253,000 particles were collected in pairs, the first image with a minimal electron dose, close to focus, and the second with higher electron dose, further from focus (Figure S1C). A structure computed from the high-dose images was used to initiate processing of the low-dose images. Classification of the high-dose images revealed a constant central region, well ordered in all classes, and two large, apparently mobile, flanking regions, better ordered in some classes than others (Figure S2A). It was apparent, and was confirmed by the analysis described below, that one flanking region contained the TFIIE-TFIIH region of the PIC (also mobile in the cryo-EM structure of the PIC alone, (Murakami et al., 2015)) and the other flanking region contained the Mediator Tail module. Two masks were created, one containing the central and TFIIE-TFIIH regions, and the other containing the central and Mediator Tail regions. Processing of the low-dose images with these masks resulted in two maps, one lacking the Mediator Tail and the other lacking the TFIIE-TFIIH region, at resolutions of about 15 and 17 Å (Figure S2B). As both masks contained the central region, the two maps could be aligned and recombined to yield a map of the complete Med-PIC complex (Figures 2 and S2A). Support for the map was obtained by cryo-EM tomography (Figure S1A).
Figure 2. Cryo-EM structure of the Med-PIC complex.
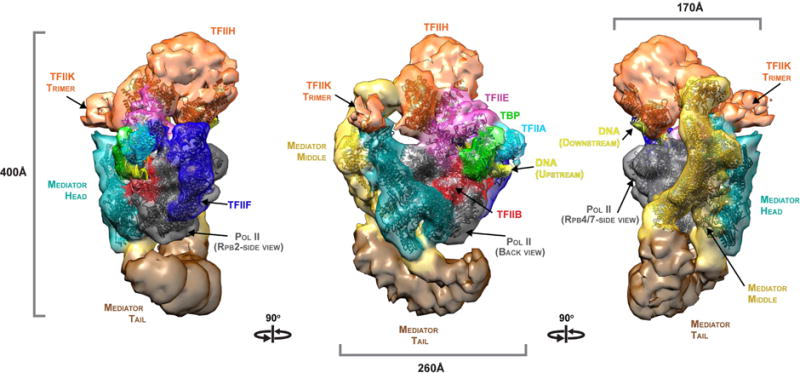
A surface representation of the cryo-EM map is shown, with views related by successive 90° rotations about a vertical axis, colored accord ing to the scheme in Figure 1A. Atomic models, computationally docked to the map as described, are shown superimposed in the same colors. See also Figures S1, S2, S4 and S6.
Mediator-PIC complex structure
The complete Med-PIC map was interpreted in three steps. First, X-ray crystal structures were fit to the map by an automated docking procedure that matched atomic coordinates to values of electron density throughout the map (Pettersen et al., 2004). Crystal structures of Mediator Head module and pol II, and a crystallographic model of pol II with TFIIA, TFIIB, the TATA box-binding protein (TBP), a homology model of the TFIIF dimerization domain, and DNA, were docked in this way (Figures 2 and S4A, B, D). Second, the previously determined cryo-EM structures of the “core Med-pol II complex” (Plaschka et al., 2015) and of the complete PIC (Murakami et al., 2015) were placed and computationally refined to locations consistent with one another and with the docked crystal structures (Figure S7). Finally, the architectural model of the complete Mediator was placed consistent with the location of the docked Head module crystal structure (Figure 7A).
Figure 7. Tail module architecture and dynamics.

(A) The architectural model of free Mediator (colored subunit map) can be docked unambiguously into the Med-PIC structure (grey semi-transparent density) showing the position of the three Mediator modules and a novel connection between the Middle and Tail (dashed red oval). (B) Revised Tail module architectural map showing the position of Tail subunits and their colocalization with the Med14 C-terminus at Tail interface 1 and with Med1 at Tail interface 2. (C) Cross-links supporting the revised Tail module architecture. (D) Alternate Tail module conformations. Whereas most particles show the Tail well separated from pol II (Tail-down), a subpopulation reveal a movement of the Tail towards the upstream DNA and in close association of Tail with pol II (Tail-up). See also Figure S7.
The fit of the previous structures to the Med-PIC map showed little conformational change of Mediator or pol II and GTFs upon interaction with one another. Fitting the Head module required modest domain movements (Figure S4E), but no alteration of domain structure as previously suggested (Plaschka et al., 2015). A model for the Middle module, previously available only from Integrative Modeling with a cryo-EM map of Mediator alone, was produced with the Med-PIC map. Crystal structures of Med7C-21 (Baumli et al., 2005) and Med7N-31 (Koschubs et al., 2009), and a homology model of Med4-9 (Lariviere et al., 2013), were placed in the Middle module density and refined by automatic docking (Figure S4C). The refined positions, together with cross-linking results and the previous Integrative Modeling results, served to identify regions of electron density due to Med1, 10, 19 and the unmodeled C-terminal 160 and 20 amino acids of Med4 and 7, respectively.
Density attributable to DNA could be discerned along a path through the complex, with a sharp bend at the upstream end at the location of TFIIB and TBP, a second bend close to the center of the pol II cleft (position −37), and contact with TFIIH at the downstream end (Figures 2, S4B). Homology models for Ssl2, Rad3 and a Tfb2-5 dimerization domain were placed as in the previous complete PIC structure (Figure 2)(Murakami et al., 2015). Interaction between TFIIH and the Mediator Middle module in the Med-PIC complex caused a shift in the position of TFIIH subunits and a shift in position of a DNA bend at −33 to −37, with an increase in the degree of DNA bending compared with the complete PIC structure.
Med-PIC cross-linking
The Med-PIC structure was confirmed and extended by chemical cross-linking and Integrative Modeling. Med-PIC containing the Gcn4 transcriptional activator protein and TFIIS was subjected to cross-linking, mass spectrometry, assignment and quality filtration of cross-links as described (Robinson et al., 2015). A total of 1221 cross-links, comprising 353 within Mediator, 797 within the PIC, and 71 between the Mediator and PIC, were obtained (Figure 3, Table S1). Cross-linking of a Med-pol II complex yielded 421 further cross-links, and for Integrative Modeling, 928 additional cross-links were derived from published studies of various Med-PIC subcomplexes (Chen et al., 2010; Lariviere et al., 2013; Luo et al., 2015; Muhlbacher et al., 2014; Murakami et al., 2013; Plaschka et al., 2015; Robinson et al., 2015), to give a combined dataset of 2570 cross-links (Figure S3A, B). The significance of the cross-links was first assessed by comparison to crystal structures of individual Med-PIC components. Of the 1642 cross-links determined here, 397 could be validated in this way and 40 were between residues more than 35 Å apart in the crystal structures (the maximum distance of cross-linking), corresponding to a violation rate of 10% (Figure 3B). The cross-links were then used to assess the validity of the complete Med-PIC structure, which contains not only crystal structures but also many homology models. From our dataset of 1642 cross-links, 514 could be mapped to the structure, and 58 were in violation (11%) (Figure S3C, D). All but one of the published cross-link datasets were consistent with the Med-PIC structure to similar extents (4–12% violation rates) (Figures S3C, D). Further validation came from comparison with published yeast two-hybrid results. Of 78 two-hybrid interactions between Med-PIC subunits, 74 were between neighboring subunits in our structure, 2 were inconsistent with our structure, and 2 involved TFIIH subunits whose locations remain to be determined (Table S1). Not only our structure but also our cross-link dataset was consistent with yeast two-hybrid results. We found cross-links corresponding to 59 of the 74 two-hybrid interactions consistent with our structure and no cross-links for the two interactions inconsistent with the structure.
Figure 3. Cross-linking and Mass Spectrometry of the Med-PIC complex.
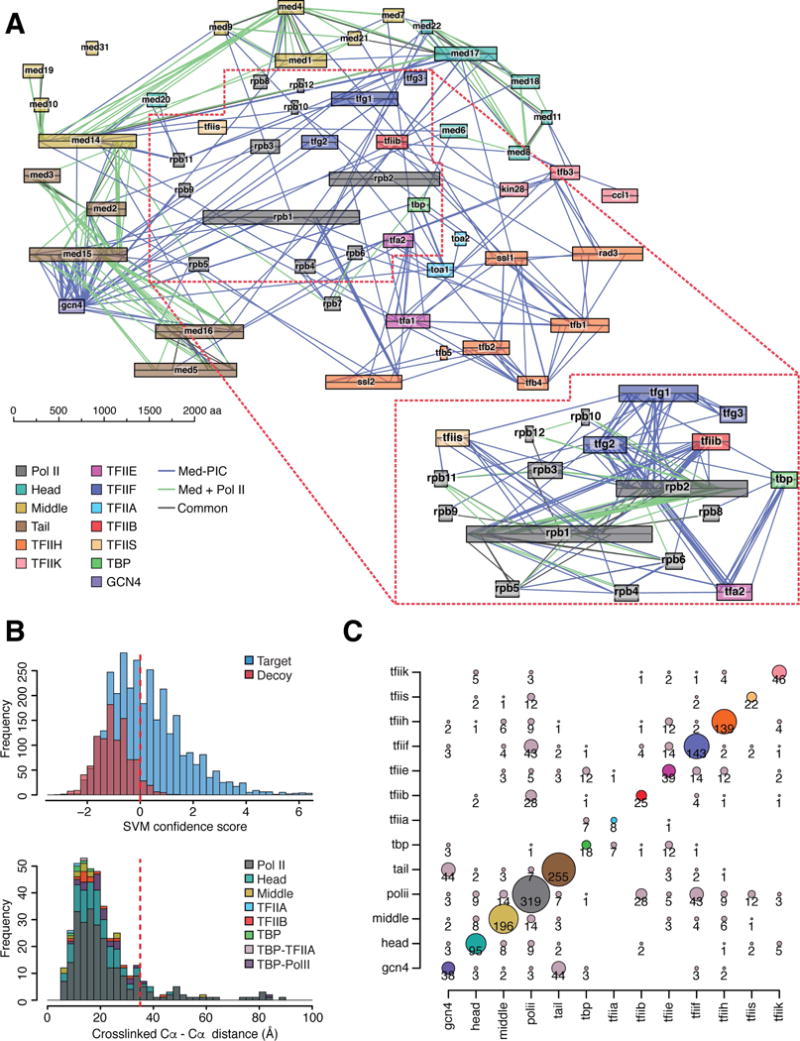
(A) Network diagram of cross-links between subunits of the Med-PIC complex (676 of the 1642 total cross-links identified here). Subunits are colored as in Figure 1A and as indicated. Blue lines represent cross-links formed in the Med-PIC complex, including Gcn4 and TFIIS (total of 54 subunits). Green lines represent cross-links formed in a Mediator - pol II complex (33 subunits). Cross-links formed in both complexes are indicated in black. Cross-links between pol II subunits and between pol II and TFIIB, -E, -F, -S and TBP are shown in the inset. (B) Validation of cross-links. Upper panel: scoring of matches (SVM confidence score) to the sequence database (target) and to a scrambled sequence database (decoy), showing a 4% “false discovery rate” (percentage of decoy matches exceeding the acceptance threshold in this work [red line])). Lower panel: validation against near atomic structures; 397 of 1642 cross-links could be mapped to Cα-Cα distances in crystal structures of pol II (pdb:1wcm), Mediator Head module (pdb:4gwp), pol II - TFIIB (pdb:4bbr), pol II – TFIIA - TBP (pdb:1rm1), Med7C/21 and Med7N/31 dimers (pdb:1yke, pdb:3fbi). Almost all (357, or 90%) of the mappable cross-links were consistent with the 35 Å upper limit. (C) Distribution of 1642 cross-links between the 13 proteins and subcomplexes defined by the color code in panel A. The area of each bubble is proportional to the number of cross-links found between the pair of proteins and subcomplexes indicated. See also Figure S3.
The cross-links were distributed over all domains of the Med-PIC structure, and included all domain interfaces apparent in the structure (Figure 3). Nearest neighbors (most extensively cross-linked) of Mediator Head were pol II and Mediator Middle; of Mediator Middle were pol II and Head; of Mediator Tail were Gcn4 and pol II; of TFIIA was TBP; of TFIIB was pol II; of TBP was TFIIE; of TFIIE were TFIIF, TFIIH, and TBP; of TFIIF were pol II and TFIIE; of TFIIH were TFIIE and pol II; and of TFIIS was pol II. Thus seven of eleven components make primary contacts with pol II.
Extended PIC structure
The large cross-link dataset was combined with the cryo-EM map and additional structural information by Integrative Modeling to extend the previous PIC structure (Murakami et al., 2015), in particular regarding the Tfg3 subunit of TFIIF and TFIIK. Atomic models were included for parts of TFIIE (homology models of the Tfa1 N-term and the Tfa2 WH1 and 2 domains (Murakami et al., 2015)) and for parts of TFIIF [a homology model of the Tfg2 C-term WH domain, a crystal structure of the Tfg3 N-term (PDB ID: 3QRL), and a homology model of the Tfg3 C-term]. The resulting structure displays details not previously resolved, especially regarding Tfg3, absent from complexes formed with recombinant TFIIF (Plaschka et al., 2015). Tfg3 and the Tfg1 C-terminal domain (residues 418–735) are located adjacent to promoter DNA, with the Tfg3 C-terminal domain at a position immediately downstream of the DNA bend at −37 (Figure S6). The Tfg3 N-terminus interacts with Tfg1 residues (350–400) within the Tfg1-Tfg2 dimerization domain, and with the Rpb9 N-terminal zinc ribbon motif (residues 7–35) (Figure S6B, D).
Contacts with GTFs cover much of the surface of pol II (Figure 4). Contacts with Mediator dominate the surface of Rpb1, the largest subunit of pol II, from which emanate the RNA transcript and the CTD. Subunits Rpb4 and Rpb7, which protrude from the Rpb1 side of the molecule, formed many cross-links to Mediator as well. Extensive contact between Mediator and the pol II surface is seemingly paradoxical, because phosphorylation of the unstructured CTD is believed to drive dissociation of Mediator from pol II (Max et al., 2007; Svejstrup et al., 1997; Wong et al., 2014). We investigated the relative contributions of the CTD and the rest of pol II to the binding of Mediator, by the use of surface plasmon resonance. Whereas Mediator bound to immobilized pol II with nanomolar affinity, there was no detectable interaction with pol II bearing a mutant CTD or pol II with no CTD (Figures 5A, E and S5A). Control experiments using immobilized Mediator confirmed a dependence on CTD for pol II binding (Figure S5E). Deletion of the CTD from pol II did not affect binding of TFIIF and so did not appear to have a general effect on interactions with the pol II surface (Figures 5B and S5D). Deletion of subunits Rpb4 and Rpb7 was also without effect (Figure 5E). We conclude that Mediator-pol II interaction depends entirely upon binding to the CTD. The contributions of the individual Mediator modules to pol II interaction were investigated as well. Deletion of the Tail module did not affect the affinity for pol II (Figures 5D and S5B), whereas deletion of both Middle and Tail reduced the affinity to micromolar levels (Figures 5C and S5C). We conclude that the interaction of Mediator with pol II occurs primarily through binding of the CTD to the Head module, with a modest contribution from the Middle module.
Figure 4. Map of transcription factor – pol II interactions.

Pol II is shown in standard views with its surface colored according to interactions with Mediator and GTFs. Interaction data include EM and cross-link results from this study and earlier ones (Figures 3 and S3), as well as published crystal structures.
Figure 5. CTD contacts drive the Mediator – pol II interaction.

The binding kinetics of complete Mediator, Mediator modules, and TFIIF (analytes) to immobilized RNA polymerase II and pol II variants (surface ligands) were determined by surface plasmon resonance. (A) Single-cycle kinetic analysis of the interaction of Mediator with immobilized pol II, pol II with mutated CTD, and pol II lacking the CTD. (B) Binding of TFIIF to pol II lacking the CTD, as a control to confirm that this pol II is capable of functionally important interactions. (C) Binding of the Mediator Head module to immobilized pol II variants. (D) Binding of Mediator lacking the Tail module to immobilized pol II variants. (E) Table summarizing the data from multiple measurements of interactions between Mediator complexes and pol II variants. All kinetic data were processed using double reference subtraction (blank analyte injection and Dligand reference lane). For a subset of the data (*), binding curves were fit using a ‘Heterogeneous Ligand’ model, consistent with the availability of multiple equivalent CTD heptad repeats, otherwise a Langmuir model (1:1 binding) was used. Analyses showing no detectable binding are indicated (☥). See also Figure S5.
TFIIK and CTD phosphorylation
The molecular basis of CTD phosphorylation, leading to disruption of Mediator-pol II interaction, could be discerned from the Med-PIC structure. The previously determined cryo-EM structures of the “core Med-pol II complex” (Plaschka et al., 2015) and of the complete PIC (Murakami et al., 2015) were docked to the Med-PIC cryo-EM map, as mentioned above (Figure S7A, B). The consistency of the docked positions with the Med-PIC structure and with one another attests to the validity of the structure. Density for TFIIS in the complete PIC structure was absent from the Med-PIC map, as expected because TFIIS was not included in the Med-PIC complex analysed by EM, further supporting the validity of the Med-PIC structure (Figure S7A). Subtraction of the “core Med-pol II complex” and the complete PIC from the Med-PIC map identified two regions of significant difference density (Figure S7C), one of which could be attributed to the Mediator Tail module (see below). The other region of difference density was attributed to the TFIIK subcomplex of TFIIH, based on the position and volume of the density (Figure 6A) and on six cross-links between the Tfb3 subunit of TFIIK and the Rad3 subunit of TFIIH (Figure 6B), consistent with previous evidence for this interaction between TFIIK and TFIIH (Luo et al., 2015). The location of TFIIK differed from that proposed previously (Plaschka et al., 2015); it was confirmed by extensive cross-linking and Integrative Modeling, which placed homology models of Kin28, the cyclin-dependent protein kinase subunit of TFIIK, and Ccl1, the cyclin subunit (Figure 6A, B).
Figure 6. Position of TFIIK and CTD and stimulation of CTD phosphorylation.

(A) Position of TFIIK density in the Med-PIC structure. TFIIK difference density calculated by subtraction of core Med-Pol II and PIC maps from the Med-PIC structure (Figure S7 and Materials and Methods) is shown after filtration and at the appropriate map threshold (orange density). (B) Integrative modeling reveals TFIIK subunit localizations (solid transparent density) within the Med-PIC EM map (blue mesh) that are consistent with the calculated TFIIK difference density and cross-links between TFIIK and Rad3 surface lysine residues (red spheres). (C) Model for the path of the CTD through the initiation complex. The CTD path is constrained by multiple anchor points provided by pol II and CTD-Med Head crystal structures, positioning the CTD kinase (Kin28) and cross-links obtained between a C-terminal CTD and N-terminal Med19 lysine residues (Plaschka et al., 2015; Robinson et al., 2015) (Figure 3A). (D) Close association between the Med7N-31 and Neck domain of the Head module at the Head-Middle interface forms a CTD channel that directs the CTD towards interaction with TFIIK. The stimulation of CTD phosphorylation by Mediator is explained by the role of Mediator in positioning both TFIIK and CTD for interaction. See also Figure S7.
Having determined the location of TFIIK, we could model the path of the CTD through the Med-PIC structure. The CTD path may be divided in three parts, the first of which extends from the last structured C-terminal residue of Rpb1 (P1455) to the Head module. The second part of the path is a groove for binding the seven-residue (heptad) repeat on the surface of the Head module, and the last part leads from the Head module to TFIIK (Figure 6C). The first part of the CTD path may be occupied by the CTD linker, a 79 amino-acid - region, that does not contain a heptad sequence. The linker may be entirely flexible (shown by absence from crystal structures of S. cerevisiae pol II), or it may be partially constrained by interaction with Rpb4 and Rpb7 (noted in crystal structure of S. pombe pol II (Spahr et al., 2009)) and approach the Head module along a trajectory suggested by electron density in the cryo-EM map of the core Med-pol II complex (Plaschka et al., 2015). The second part of the CTD path, the groove in the Head module, was revealed by a Head module-CTD cocrystal structure (Robinson et al., 2012), showing 25 CTD residues, or nearly four heptad repeats, bound on the surface of the Head. The last part of the CTD path passes through a channel between the Head and a subcomplex of the N-terminal region of Med7 and Med 31 of the Middle module (Figure 6C, D). Whereas TFIIK is disordered and missing from cryo-EM maps of the PIC, it is stabilized by interactions with Mediator in the Med-PIC complex, and lies directly in the path of the CTD as it emerges from the channel between Head and Middle modules. The location of the CTD at this point was shown by multiple cross-links formed between a lysine residue at the C-terminus of the CTD and multiple residues in Middle module subunit Med19 (K56,59 & 62) (Plaschka et al., 2015; Robinson et al., 2015) (Figure 6C). The continuous path through the groove in the Head module and channel between Middle and Head, unequivocally demonstrated by crystallography and cross-linking, thus bring the CTD into proximity with TFIIK, positioning it for phosphorylation, as discussed further below.
Mediator Tail module architecture and dynamics
Density for the Mediator Tail module was revealed by difference between previous cryo-EM structures and the present map, as noted above. The location conformed with that of the Tail in our architectural model of the complete Mediator (Robinson et al., 2015), but the density included an additional interface between the Middle and Tail modules, a connection between Med1 of the Middle with Med5 of the Tail (Figure 7A, B). This second interface between Middle and Tail was supported by a set of Med1-Med5 cross-links (Figure 7C), and explains the observation of a Med1-Med5 interaction in yeast two-hybrid studies (Guglielmi et al., 2004). The Med2-3-15 triad, a common binding target of transcriptional activator proteins (Brzovic et al., 2011; Jedidi et al., 2010; Zhang et al., 2004), is positioned closest to the DNA upstream of the PIC, where activator-binding sites typically occur. Indeed, we observe a large number of Gcn4-Med15 cross-links in the context of Med-PIC (Figure 3A, C). In a small subset of the Med-PIC particles analyzed here, the Tail was rotated upwards towards pol II (“Tail-up state”), coming 50 Å closer to the upstream DNA than in the more abundant “Tail-down” state (Figure 7D). A number of Tail-pol II cross-links were obtained with Med-PIC preparations including Gcn4 that are consistent with a Tail-up state (Figure 3A, C).
DISCUSSION
Mediator is required for all transcription and for regulation of the process in vivo ((Thompson and Young, 1995), reviewed in (Carlson, 1997)). Mediator exhibits three functional activities in vitro, the stimulation of CTD phosphorylation by TFIIK, the stimulation of transcription by pol II and GTFs, and the further stimulation of transcription in the presence of an activator protein (Kim et al., 1994). The complete Med-PIC structure enables an understanding of all three functional activities: the structure and results of surface plasmon resonance explain the entire CTD phosphorylation – dephosphorylation cycle; the structure and results of biochemical analysis suggest how Mediator controls transcription.
The CTD plays a central role in Mediator activity. It binds in the unphosphorylated state to Mediator, bringing pol II to the promoter. Upon assembly of the PIC, every heptad repeat of the CTD is phosphorylated by TFIIK, leading to the release of Mediator, as shown by studies of Mediator-pol II interaction in vitro and in vivo (Max et al., 2007; Svejstrup et al., 1997). A number of questions arise: Why does the CTD contain so many heptad repeats, 26 in yeast pol II, and a minimum of about 10 in truncation mutants of the enzyme (Nonet et al., 1987)? How do all repeats gain access to TFIIK for phosphorylation in the PIC? Why does phosphorylation suffice for the release Mediator, when additional interactions of Mediator with Rpb1, Rpb4 and Rpb7 are suggested by the Med-PIC structure? Answers to these questions lie in the length and flexibility of the CTD linker, and the path of the CTD through the Med-PIC structure. We have modeled the CTD path with the first four heptad repeats after the linker bound in the groove in the Head module. Sliding of the CTD in steps of seven residues or dissociation and rebinding, together with flexibility of the linker, would allow all heptad repeats to enter the groove. The affinity of CTD-Mediator interaction would be greatly increased in this way. Sliding or dissociation, and flexibility of the linker, would also allow all heptad repeats to reach TFIIK for phosphorylation. The length of the linker when fully extended, approximately 236 Å, is more than sufficient for the first heptad repeat after the linker to reach the active center of TFIIK, a distance of 214 Å along the path we have modeled, or only 165 Å along the most direct path. It may be noted that CTD phosphorylation by TFIIK is processive (Feaver et al., 1991), so the CTD may be drawn into the kinase active center in the course of the reaction, ensuring complete phosphorylation of all heptad repeats, as required for complete Mediator-pol II dissociation. Finally, regarding the relative contributions of the CTD and the rest of the pol II surface to Mediator-pol II interaction, the results of SPR measurement are clear-cut: affinity of Mediator for pol II with the CTD is nanomolar, whereas affinity for pol II lacking the CTD is undetectable. This does not mean that Mediator fails to interact with the pol II surface. Rather the affinity of such interaction is at least two orders of lower than that for the CTD. Mediator-pol II interaction is therefore controlled by the phosphorylation state of the CTD, in keeping with the evidence regarding the interaction in vivo. At the same time, Mediator binding to pol II through contact with the CTD creates a high local concentration, driving interaction with low affinity sites on the pol II surface, and resulting in the fixed geometry observed in the cryo-EM structure. The requirement of Mediator-CTD interaction for entry of Mediator in the transcription initiation complex explains the longstanding observation that the CTD is required for transcriptional regulation (Allison and Ingles, 1989; Gerber et al., 1995; Scafe et al., 1990).
The Med-PIC structure thereby provides a rationale for the existence of the linker, as well as indicating its minimum length. The CTD path leading to TFIIK explains why Mediator enhances the rate of phosphorylation by TFIIH in vitro (Kim et al., 1994). Further consistent with the structure, splicing the CTD onto either Rpb4 or Rpb6 near its point of exit from the surface of the wild type enzyme rescued a lethal Rpb1-ΔCTD phenotype in yeast, whereas splicing onto Rpb9, on the opposite side of the enzyme, failed to rescue the lethal phenotype (Suh et al., 2013). These CTD variants, which contained a modified linker region, showed diminished levels of phosphorylation by TFIIK, possibly due to an influence of linker length and topology on the kinetics of CTD phosphorylation.
As regards the stimulation of transcription by Mediator, it is notable what we do not observe: in many experiments, including the example shown here (Figure 1D), we find no effect of Mediator on the initiation of transcription by a fully formed PIC; and we find no marked effect of Mediator on the structure of the PIC, at the resolution of our analysis, except for a movement of TFIIH towards the Middle module and an accompanying small change in the angle of bend of the promoter DNA. The stimulation of transcription by Mediator has been seen only in mixtures of pol II and GTFs in vitro, or in the nuclear milieu in vivo. These findings are consistent with stimulation by Mediator of PIC assembly, due to interaction with pol II and with TFIIH in the Med-PIC complex. However, the possibility of stimulation due to a conformational change, such as the movement of TFIIH, is not ruled out as yet.
The role of Mediator in transcriptional activation may also relate to multiprotein complex assembly. Mediator conformation may be affected by activator protein binding, for example by a transition between the “Tail-down” and “Tail-up” states described above, but our preliminary analysis has revealed no effect on PIC conformation. Consistent with this, we have found no effect of the Gcn4 transcriptional activator protein on transcription initiation by a fully formed Med-PIC (not shown). Rather, Mediator may activate transcription by bringing together multiple components required for transcription of genes in chromatin in vivo.
The Med-PIC structure extends previous studies in regard to scale and biological significance. It combines a large number of crystal structures and homology models, with precision due to an unprecedented number, over 1500, of chemical cross-links. It goes beyond previous partial structures to reveal the regulated RNA pol II pre-initiation complex in its entirety. And it addresses key biological questions, left open by previous studies, regarding CTD phosphorylation and transcriptional activation.
One outstanding question has long been how CTD phosphorylation releases Mediator from pol II for another round of regulation; the more specific question has been how Mediator stimulates CTD phosphorylation, remarkable for both the magnitude of the effect (greater than 10-fold (Kim et al., 1994), and up to 50-fold in our experience) and the extent (complete in the Med-PIC complex, whereas only partial in the absence of a complex, due to the omission of promoter DNA - see Figure 6 in (Laybourn and Dahmus, 1990)). Answers to these questions are found in the path of the CTD, defined by the placement of the Head module and thus of the CTD-binding groove in the Med-PIC structure, and by the cross-linking of the CTD to Med19 in the Middle module. As explained above, these features direct the CTD to the TFIIK kinase, which is also stabilized and positioned by Mediator interactions. Flexibility of the linker and movement of the CTD enable both high affinity and high processivity.
The question of transcriptional activation has long been whether Mediator serves primarily as a platform for assembly of the PIC, enhancing its rate of formation and stability, or whether it provokes a conformation change in the PIC conducive to transcription. Our findings argue against the latter possibility of a conformational effect. Whereas Mediator stimulates “basal” transcription, observed in mixtures of pol II and GTFs (Kim et al., 1994; Takagi and Kornberg, 2006), we find no stimulation of transcription by a fully assembled PIC. And we observe no conformational change of the PIC at the resolution of our analysis. It will be of great interest to pursue this observation at higher resolution.
METHODS AND RESOURCES
EXPERIMENTAL MODEL AND SUBJECT DETAILS
Saccharomyces cerevisiae
The endogenous yeast transcription proteins used in Med-PIC assembly and analysis (see below) were isolated from S. cerevisiae strains with CB010 (Matα pep4::HIS3 prb1::LEU2 prc1::HISG can1 ade2 trp1 ura3 his3 leu2–3,112 cir-o GAL+ RAF+ SUC+) and modified S288C (his3Δ200 leu2Δ0 or 1 ura3-52 lys2-128δ trp1Δ63) backgrounds. The CB010 strain, closely related to CB023 (Brenner and Fuller, 1992), was a gift of C. Brenner (Univ. Iowa) and has been described previously (Bushnell et al., 1996). The modified S288C strains, generated by Winston and colleagues (Winston et al., 1995), were a gift of the C. Kaplan lab (Texas A&M). Standard cell growth conditions were 30°C incubation in YPD liquid media (1% w/v Yeast Extract, 2% w/v Peptone, 2% w/v Dextrose). Yeast transformants were selected using synthetic minimal dropout media (Each amino acid at 82μg/ml except ±0.41mg/ml Leucine and selected dropouts, 8.2μg/ml p-Aminobenzoic acid, 0.34mg/ml Thiamine, 0.3mg/ml Succinic acid, 10μg/ml Adenine sulphate, 80μg/ml Inositol, 1.45mg/ml yeast nitrogen base w/o (NH4)2SO4, 5mg/ml (NH4)2SO4, 2% w/v Dextrose and ± 82μg/ml Uracil). Selection for stable transformants harboring the KanMX marker gene was performed by supplementing media with 200ug/ml Geneticin. Counter-selection for loss of a functional Ura3 marker gene (orotine-5′-monophosphate decarboxylase), was performed by supplementing media with 5-Fluoroorotic Acid (5FOA) at a final concentration of 1mg/ml.
METHOD DETAILS
Med-PIC Assembly
A subset of Med-PIC factors (TBP, TFIIA, TFIIB, TFIIE, TFIIS and GCN4) were produced in recombinant form and endogenous yeast Pol II, Mediator, TFIIF and TFIIH were purified as previously described (Murakami et al., 2013; Murakami et al., 2012; Robinson et al., 2012). The Med-PIC complex was assembled using a salt dialysis protocol adapted from that used for the PIC (Murakami et al., 2013): 0.5nmol of a His4 promoter fragment (−92/+16) was mixed with 0.7nmol TFIIE, 0.3nmol TFIIH, 0.5nmol TBP, 1.0nmol TFIIA and 1.0nmol TFIIB +/− 0.85nmol GCN4 in 70ul buffer (800/0) [20mM Hepes (pH 7.6), 5% glycerol, 2mM Mg(OAc)2 and 5mM DTT] with the millimolar concentration of KOAc/(NH4)2SO4 shown in parentheses. 3-(Decyldimethylammonio) propanesulfonate inner salt was included in the initial sample buffer at 0.25% w/v but omitted from all subsequent buffers. The mixture was dialyzed into buffer (500/100) before the addition of 0.3nmol Mediator complex. Next the mixture was dialyzed into buffer (350/80), (200/60), (70/40) and buffer (70/20) before 0.3nmol pol II-TFIIF +/− 1.0nmol TFIIS were added and the sample further dialysed to buffer (20/20) and loaded on a 10–40% (v/v) glycerol gradient containing 80mM KOAc, 20mM Hepes (pH 7.6), 2mM Mg(OAc)2 and 5mM DTT and centrifuged for 2h at 60,000 rpm in a Beckman SW60 Ti rotor. For cryo-EM, samples were chemically stabilized by fixation in glycerol gradients with increasing concentrations of glutaraldehyde (0–0.1%, Electron Microscopy Sciences). Peak gradient fractions (~0.2mg/ml) containing glutaraldhyde were quenched upon the addition of 50mM Tris-HCl (pH 7.5) before flash-freezing and storage under liquid nitrogen. Preparations of PIC-alone control were assembled as described (Murakami et al., 2013).
EM Specimen Preparation
Prior to the preparation of cryo grids, Med-PIC peak gradient fractions were dialysed into 80mM KOAc, 20mM Tris (pH 7.5), 2mM Mg(OAc)2 and 5mM DTT to remove glycerol and concentrated to ~0.1mg/ml. Electron microscopy grids (Quantifoil R2/2 or R2/1) were glow discharged for 30 sec prior to the application of 3ul Med-PIC sample (50 ug/ml) and plunge-freezing in liquid ethane using a Vitrobot mark IV (FEI) with 100% chamber humidity at 22°C. For cryo-electron tomography Med-PIC was diluted to final 50 ug/ml in sample buffer (80mM KOAc, 20mM Tris (pH 7.5), 2mM Mg(OAc)2 and 0.5mM DTT) containing 10nm gold fiducials (Sigma).
Cryo-electron Tomography Data Acquisition and Processing
Tilt-series were collected on a FEI Tecnai F20 microscope operating at 200KeV with single-axis tilts ranging from −60 to +60 degrees, with a total electron dose of ~60 e−Å2 and 5–7μm defocus using UCSF tomography software (Zheng et al., 2007). Tomograms were reconstructed using IMOD (Kremer et al., 1996) and subtomographic volumes extracted and aligned using BSOFT (Heymann et al., 2008) with the application of a fourier-space mask of the missing wedge. 509 Med-PIC particles were extracted from 8 tomographic volumes and iteratively aligned for multiple rounds to reach stable convergence of the cryo-electron tomography reference.
Single-particle Cryo-EM Data Acquisition and Preliminary Processing
Med-PIC particles were imaged using a FEI Tecnai F20 microscope operating at 200KeV, equipped with Ultrascan 4000 camera (Gatan), and at a magnification of 65495× (2.29 Å/pixel sampling). Micrographs were collected in defocal pairs were an initial low-dose (15e−Å2)/close-to-focus (0.8 – 2.5 μm defocus) exposure was followed by a second high-dose (~40 e−Å2)/high-defocus (5 μm) exposure. First, ~20,000 high-dose particles were manually picked to produce 2D class averages using an unsupervised classification routine within Relion (Scheres, 2012). A small group of these references were used to generate a de novo reference structure using EMAN2 (Tang et al., 2007)(Figure S1B). This EMAN2 reference structure was used to perform unsupervised 3D classification of the 20,000 particle set, which produced a low-resolution Med-PIC model into which both the PIC and core Med-Pol II initiation complexes could be unambiguously fitted (Figure S1B). Automatic particle picking was performed in Relion as follows; First, the initial 3D Relion model was reprojected with 10° angular spacing to give ~200 2D reference projections using EMAN2. Next, each reference projection image and micrograph were normalized to mean=0, S.D.=1. Automatic picking was performed using a correlation search of the normalized references within the normalized micrographs using Relion. Particle coordinates obtained from autopicking were applied to the unnormalized versions of the high-defocus micrographs for particle extraction. Extracted high-defocus particles were sorted according to the autopicking particle select Z-score and membership in high-quality classes resulting from iterative rounds of unsupervised 2D image classification. The sorted particle dataset comprised 253,500 particles. 3D classification was performed on the high-dose particle set using the Relion initial model as reference. The Med-PIC maps resulting from these classifications showed density clearly attributable to the Mediator Head, Middle and Tail modules, a central region attributable to pol II- core GTFs and a domain attributable to TFIIH-E. Whilst the central pol II- core GTF core was well-ordered in all structural classes, the flanking Mediator Tail and TFIIH-E domains showed a high level of mobility, consistent with the observation of TFIIH mobility in PIC reconstructions (Murakami et al., 2015). Classes showing better particle alignment and structural order in the TFIIH-E domain showed weaker Mediator Tail density and vice versa. Specifically, 33% particles showed well ordered TFIIH-E density with weaker Tail module density (Fig. S2A left panel), 19% particles showed better ordered Tail module density (Fig. SA right panel) and 48% particles formed a class in which TFIIH-E and Tail module were present but poorly ordered (Fig. SA middle panel).
Focused Refinement
To best resolve the highly mobile TFIIH-E and Mediator Tail domains, a focused refinement approach was used. Focused refinement of the Mediator Tail module involved multiple steps: The first step involved generating a Med-PIC reference lacking the mobile TFIIH-E domain (ΔTFIIH-E Med-PIC). Subsequent refinement of the ΔTFIIH-E Med-PIC template was carried out using a ΔTFIIH-E Med-PIC mask in order to avoid the effects of TFIH-E variability on particle alignment. The next step involved performing 3D classification of high-dose/defocus particles considering only the density within the ΔTFIIH-E Med-PIC mask. From the starting dataset (253500 particles), 34% particles showed well resolved Tail density positioned away from the surface of pol II (termed ‘Tail-down’), 24% showed Tail density closely associated with pol II (termed ‘Tail-up’) and 42% showed no clear Tail density. As the ‘Tail-down’ density was the best resolved of the two Tail classes, we next sub-classified the Tail-down particle set, producing a single high-quality class (~43500 particles) in which the Tail density was well localized. Refinement of this density proceeded by applying the alignment parameters for the high-dose/defocus particles to the equivalent set of close-to-focus particles. This was done by continuing a one-model high-defocus particle 3D classification run in Relion with the close-to-focus particle set. Upon convergence of the close-to-focus particle set in the 3D classification run, the resulting model was filtered back to 20 Å as input to the Relion auto-refine procedure and calculation of the gold-standard Fourier shell correlation (FSC=0.143).
Focused refinement of the complex containing TFIIH-E was carried out with a similar approach by first generating a ΔTail Med-PIC reference model and mask. First, the high-dose/defocus dataset (253500 particles) was used to perform 3D classification considering only the density within the ΔTail Med-PIC mask, which revealed a subset of particles (27%) showing good alignment accuracies. This particle subset was refined further by switching from the high-dose/defocus particles to the equivalent close-to-focus particles by continuing a high-dose/defocus one-model Relion 3D classification run with the substituted particle set. Upon convergence, the refined ΔTail Med-PIC map was used to generate a refined ΔTail Med-PIC mask for subsequent refinement cycles. After exploring many alternative targeted refinement schemes, we found that we were able to generate the highest quality ΔTail Med-PIC maps by aligning the full close-to-focus dataset (253500 particles) to the refined ΔTail Med-PIC reference and selecting the subset of particles with the highest Relion per-image ‘MaxValueProbDistribution’ values. In the case of one-model refinement, these values indicate how broadly distributed each particle is over all orientations with higher values indicating a narrow angular distribution, i.e. better alignment. Particles with ‘MaxValueProbDistribution’ values above 0.1 were selected (170600 particles) for Relion auto-refine and calculation of the ‘gold-standard’ Fourier shell correlation (FSC=0.143). Since ΔTail and ΔTFIIH-E Med-PIC maps both contained the central pol II-core GTF density, they could be aligned and recombined to generate the full Med-PIC complex structure. Sub-complex recombination was achieved by first generating a hard-edged mask for the extra Tail density in the ΔTFIIH-E map. This was done by subtracting a ΔTail mask (hard-edged) from a ΔTFIIH-E mask (hard-edged) followed my manual removal of mask regions outside of the Tail. This Tail mask was then multiplied by the ΔTFIIH-E map density to recover Tail density, which was next added to the ΔTail map to recover the full complex. As the ΔTail map was resolved at the highest resolution, this recombination scheme preserved the higher resolution density for the common map regions.
Med-PIC and Med-PolII Cross-linking
Med-PIC samples were exchanged into 80 mM KOAc, 25 mM HEPES, 3 mM dithiothreitol, 2 mM Mg(OAc)2, pH 7.4 for crosslinking. Med-PolII samples were exchanged into 150 mM KOAc, 150 mM Na2HPO4, 2 mM dithiothreiotol, 5% glycerol, pH 7.5. Approximately 300–400 μg of protein complex were used for each crosslinking trial. For each trial, half of the sample was crosslinked using a single-step protocol, while half was crosslinked using a two-step protocol. Both protocols were designed to maximize the yield of crosslinks between Med-PIC modules (Figure 3) by using the highly-reactive 1-hydroxy-7-azabenzotriazole analog of DSS, 1,1′-(suberoyldioxy)bisazabenzotriazole (SBAT) (Bich et al., 2010). The two-step protocol added a substiochiometric formaldehyde fixation step prior to SBAT crosslinking to freeze the configurational dynamics of the assembly. SBAT was synthesized using the method of Bich et al. One-step crosslinking involved reacting with 1–3 mM SBAT (added from 100× DMSO stock) for one hour followed by quenching with 25 mM Tris-Base. For the two-step protocol, the concentration of lysine residues of the complex was first calculated (typically between 0.15 and 1.5 mM), and formaldehyde was added at a 1:10 molar ratio below that, to leave the majority of lysines free for SBAT crosslinking. Formaldehyde pre-treatment proceeded for 10–20 minutes on ice after which SBAT was added identically to the one-step procedure. Excess reagents were removed by ultrafiltration (Amicon 10 kDa cutoff) against water. The samples were then dried, brought up in 25 ul of 8 M urea, 10 mM TCEP, and heated for 30 min at 55 °C to reduce and denature protein, and reverse formaldehyde crosslinks. Cysteines were alkylated with 20 mM iodoacetamide (RT for 45 minutes) followed by 10× dilution with 100 mM ammonium bicarbonate and digestion with 1:20 (w:w) trypsin for 4 hours at 37 °C. A second aliquot of trypsin was then added and the samples digested overnight. Digests were desalted and fractionated by size-exclusion chromatography (SEC) as described previously (Robinson et al., 2015).
SEC fractions eluting between 0.9 and 1.4 ml were dried, resuspended in 0.1% formic acid and then analyzed with a Q-Exactive Plus mass spectrometer (Thermo Scientific) coupled with a Flex nanoelectrospray ion source (Proxeon) and NanoAcquity UPLC system (Waters). Enriched fractions were separated on a 100 μm I.D., 2 meter long monolithic column (MonoCap C18 HighResolution 2000, GL Sciences). Samples were loaded for 20 minutes at 600 μl/min at 5% B (A: 0.1% formic acid in water, B: 0.1% formic acid in acetonitrile). A quick gradient was then run to 15% B over 40 minutes at 400 μl/min, followed by a slow gradient to 33% B over 300 minutes at 400 μl/min. The column was then washed at 80% B and re-equilibrated. Total run times were 450 minutes. Other experiments employed a 15 cm × 75 μm ID PepMap C18 column (Thermo) using 120–150 minute gradients from 3–27% solvent B coupled to an EasySpray nanospray ion source (Thermo). Precursor MS scans were measured in the Orbitrap scanning from 350–1800 m/z (mass resolution: 70,000). The ten most intense triply charged or higher precursors were isolated in the quadrupole (isolation window: 4 m/z), dissociated by HCD (normalized collision energy: 24.5), and the product ion spectra were measured in the Orbitrap (mass resolution: 17,500). A dynamic exclusion window of 60 or 30 sec was applied (depending on the chromatography) and the automatic gain control targets were set to 3e6 (precursor scan) and 5e4 (product scan).
Peaklists were generated using Proteome Discoverer 1.4 (Thermo) and searched for cross-linked peptides with Protein Prospector 5.14.4 (Trnka et al., 2014) against a database containing 54 Med-PIC sequences (including TFIIS and Gcn4, Table S2) concatenated with 540 randomized sequences. Protein sequences were taken from UniProtKB (see Table S1). Crosslink searches and classification were performed essentially as described previously (Robinson et al., 2015). A minimum length requirement of 4 amino acid residues was used due to the high number of identical and isomeric tryptic peptides of length three in the database. Eleven ambiguous, inter-protein crosslink assignments were still present in the results. In most cases, one answer could be manually selected due to consistency with crystallographic information or with the overall architectural model of Med-PIC. Remaining ambiguity came exclusively through unknown site localization of the crosslink within the same peptides and proteins. In these cases, all possible crosslinks were reported. Only intra-modular crosslinks were kept from Med-PolII experiments due to the global conformation of Med-PolII being different from GTF containing preparations (Robinson et al., 2015). Classification, parsing, and distance measurement of crosslinking data was performed with in-house programs. Crosslink network figures were made using Cytoscape 3.3 with an in-house plugin.
Literature data sets were compiled using the same selection criteria when possible. Tfb6 hits were removed from the Luo 2015 data (Luo et al., 2015). Muhlbacker 2014 (Muhlbacher et al., 2014) and Plaschka 2015 (Plaschka et al., 2015) used Tfg1 from S. mikatae with 87% sequence identity to S. cerevisiae. Their results were renumbered by adding 5-positions to hits within residues 252 and 730 of Tfg1. Additionally, 10 positions were subtracted from their Med14 results and 1 position was added to Med4, 8, 19, 20, 22 to account for minor sequence and numbering differences with the sequence database used here. Inter-modular crosslinks were removed from the Robinson 2015 (Robinson et al., 2015) data, as above. Chen 2010 (Chen et al., 2010) only reported intermodular hits between polII and TFIIF.
Surface Plasmon Resonance (SPR) Studies
SPR studies were performed with multiple Mediator complexes (Full-length Mediator, ΔTail Mediator and Head Module) and RNA polymerase II variants (WT Pol II, mutant CTD pol II, ΔRpb4-7 pol II, ΔCTD pol II and ΔRpb4-7/ΔCTD pol II). Full-length Mediator, Head module, WT pol II and ΔRpb4-7 pol II were prepared as described previously (Liu et al., 2010; Robinson et al., 2012; Robinson et al., 2015). A mutant CTD pol II was prepared in which threonine at position 4 of the CTD repeat was substituted with cysteine or arginine in a 3CYS:1ARG repetitive pattern throughout the full set of CTD heptad repeats. The RPB1-3CYS:1ARG mutant CTD construct was generated by first sub-cloning a FseI/StuI fragment containing the mutant CTD-3C precision protease cleavage-partial protein G tag sequences (Genewiz) into a FseI/StuI linearized pCeMM-CTAP(SG) vector. Next, a BmgBI-XhoI fragment containing the mutant CTD-3C precision protease cleavage-full protein G tag sequences was sub-cloned into BmgBI-XhoI linearized pRS316 yeast centromere vector (Ura+) containing the WT RPB1 gene downstream of the endogenous promoter (pCK518, kind gift of Craig Kaplan, Texas A&M university) to generate the RPB1-3CYS:1ARG-3C-proteinG mutant CTD construct. As yeast harboring only RPB1-3CYS:1ARG were inviable, the mutant CTD pol II was isolated from a CB010 strain (Matα pep4::HIS3 prb1::LEU2 prc1::HISG can1 ade2 trp1 ura3 his3 leu2–3,112 cir-o GAL+ RAF+ SUC+) harboring a non-tagged endogenous WT RPB1 gene and TAP-tagged copy of Med5, with additional selection for the pRS316 RPB1-3CYS:1ARG yeast centromeric vector using URA-minus synthetic yeast dropout media. WT and ΔRpb4-7 polymerases lacking the CTD (Rpb1 1-1460) were generated as follows: Firstly, a C-terminal RPB1-3C-Protein G fragment encompassing BsiWI/SnaBI restriction sites was amplified from genomic yeast DNA from yeast harboring the N-TAP-Med17/Rpb1-3C-Protein G double-tag (Robinson et al., 2015). The BsiWI/SnaBI fragment was sub-cloned into BsiWI/SnaBI-linearized pRS315 yeast centromeric vector (Leu+) encoding rpb1::1461TEV under control of the endogenous RPB1 gene promoter (kind gift of Craig Kaplan, Texas A&M university) and the construct was sequence verified. Next the RPB1-1461TEV-ProteinG pRS315 vector was shuffled into a RPB1 knockout strain (his3Δ200 leu2Δ0 ura3-52 lys2-128δ trp1Δ63 rpb1Δ::CLONATMX) harboring a exogenous WT RPB1 gene copy within the pRS316 yeast centromeric vector (URA+)(kind gift of Craig Kaplan, Texas A&M university). The WT RPB1 gene was subsequently lost by 5FOA counter-selection after a few days of growth on Leu-minus synthetic dropout media. The rpb1::1461TEV pol II was purified according to the standard protocol for WT enzyme (Liu et al., 2010), except that pol II lacking CTD was released from IgG affinity resin following overnight TEV cleavage at 4°C. TEV eluent was collected directly onto a HiTrap Q column (GE Healthcare) at low salt and a subsequent 75–600mM (NH4)2SO4 gradient was found to be enriched for 10-subunit (ΔRpb4-7) pol II in early fractions and 12-subunit pol II in later fractions. The separation of 10- and 12-subunit pol II was augmented by a further 0–600mM (NH4)2SO4 Uno-Q column gradient step (Bio-Rad), which gave clearly resolved 12- and 10-subunit pol II peaks. The isolation of ΔTail Mediator was performed by deletion of the Med16 Tail module subunit in yeast strains harboring a Med8 TAP tag (Head module) essentially as described previously (Zhang et al., 2004).
SPR experiments were performed using both Biacore T200 (GE Healthcare) and ProteOn XPR36 (Bio-Rad) instruments. Whereas Biacore T200 experiments were limited to the kinetic analysis of Mediator (analyte) binding immobilized pol II variants (ligand), the ProteOn XPR36 experiments were performed with Mediator and pol II variants as both analyte and ligand. Biacore experiments were performed using CM5 chips onto which pol II variants (WT, mutCTD and ΔCTD pol II) were immobilized via EDC-NHS amine coupling in an appropriate buffer lacking free primary amines (200mM KOAc, 25mM Hepes pH 7.8, 0.5% Glycerol, 0.1mM TCEP) with typical surface densities ranging from 300–450 response units (RU). Mediator was injected at concentrations of 1–54 nM in A200 analyte buffer (200mM (NH4)2SO4, 25mM Hepes pH 7.8, 0.5% Glycerol, 0.1mM TCEP) at a flow rate of 30ul/min with 120 sec association and 1800 sec dissociation phases. The TFIIF positive control was injected at concentrations of 3.75–60nM in K120 analyte buffer (120mM KOAc, 25mM Hepes pH 7.8, 7.5mM MgOAc, 0.1% w/v 3-(Decyldimethylammonio)propanesulfonate inner salt, 1mM DTT) at a flow rate of 30ul/min with 85 sec association and 60 sec dissociation phases. Lane 1 of the CM5 chips underwent EDC-NHS amine coupling in the absence of ligand and kinetic experiments included blank buffer injections in order to apply double-reference subtraction to the binding curves. ProteOn XPR36 experiments were divided into two groups: Group1 were related to the T200 experiments where immobilized pol II ligand surfaces (WT, ΔRpb4/7, ΔCTD and ΔRpb4/7-ΔCTD) were bound by Mediator complex analytes (Full-length Mediator, ΔTail Mediator and Med Head). Polymerase surfaces were prepared on GLM sensor chips using EDC-NHS amine coupling in K200 buffer containing Tween 20 (200mM KOAc, 25mM Hepes pH 7.8, 0.5% Glycerol, 1mM DTT, 0.05% v/v Tween 20) with typical surface densities of 100–500 RU. Mediator was injected at concentrations of 0.3125–66 nM in A200 analyte buffer (200mM (NH4)2SO4, 25mM Hepes pH 7.8, 0.5% Glycerol, 0.1mM TCEP, 0.05% v/v Tween 20) at a flow rate of 30ul/min with 120–300 sec association and 7200 sec dissociation phases. ΔTail Mediator was injected at concentrations of 4.125–66 nM in A200 analyte buffer at a flow rate of 30ul/min with 300 sec association and 7200 sec dissociation phases. Med Head was injected at 225–900nM concentrations in A200 analyte buffer at a flow rate of 30ul/min with 300 sec association and 3600 sec dissociation phases. Group 2 experiments involved a two-step Mediator immobilization regime (since Mediator shows poor solubility in buffers lacking ammonium ions) where biotinylated calmodulin (50ug/ml) was first immobilized on the surface of an NLC sensor chip with 360 sec injection at 25ul/min in AC analyte buffer (200mM AS, 25mM Hepes pH 7.8, 0.5% Glycerol, 0.1mM TCEP, 1mM CaCl2, 0.05% v/v Tween 20) and then prior to each analyte injection Mediator (1.5ug/ml) was immobilized on the calmodulin surface (30ul/min, 100 sec) via a calmodulin binding peptide, part of the Med5-TAP tag. Between each analyte injection the calmodulin surface was regenerated with two washes (100ul/min, 60 secs) of regeneration buffer (200mM AS, 25mM Hepes pH 7.8, 0.5% Glycerol, 0.1mM TCEP, 1mM EDTA, 0.05% v/v Tween 20). The pol II variant analytes were injected at concentrations of 7.5–120nM in AC analyte buffer at a flow rate of 30ul/min with 150 sec association and 7200 sec dissociation phases. For all ProteOn experiments Lane 1 of the sensor chips was prepared in the absence of ligand and kinetic experiments included blank buffer injections in order to perform double-reference subtraction prior to model fitting.
Integrative Molecular Modelling Studies
Integrative modeling of Med-PIC components was performed using the approach described recently for yeast Mediator (Robinson et al., 2015). The integrative modeling platform (IMP) was used to combine EM and cross-link restraints as well as atomic models from both crystal structures and comparative modeling to position Med-PIC components within the structure. IMP modeling was used to reveal the subunit arrangement in two regions of the Med-PIC structure, 1) the TFIIK trimer and 2) the pol II- core GTF complex. The TFIIK trimer, comprising the CTD kinase Kin28 in complex with Ccl1 and Tfb3, was modeled using homology models for each of the subunits described previously (Luo et al., 2015). A homology model for Rad3, a fourth member of TFIIH, could be confidently fitted into both PIC (Murakami et al., 2015) and Med-PIC structures. Rad3 had been earlier shown to link TFIIK to the remainder of TFIIH (Luo et al., 2015). Therefore, modeling of TFIIK subunit positions was conducted with the Rad3 structure fixed at the appropriate Med-PIC map location. Homology models for Rad3, Kin28 and Ccl1 covered 74%, 93% and 80% of the primary sequence, respectively, and so modeling for these subunits was limited to residues found within the bounds of these molecular models. In contrast, the Tfb3 homology model accounted for only 42% of the amino acids and so the unmodeled C-terminal portion was represented as a chain of flexible course-grained beads (20 amino acids bead−1). Similarly, course-grained flexible beads were used to represent short regions of unmodelled sequence within each of the homology models. The TFIIK modelling EM restraint was generated by subtraction of yeast PIC (EMD-3114) and core Med-Pol II iniaition complex (EMD-2786) maps from the Med-PIC structure. The putative TFIIK difference density could be clearly distinguished from the large portion of difference density attributable to the Mediator Tail module (Figure S7). For IMP modeling the putative TFIIK density was filtered to 25 Å, represented using a gaussian mixture model (GMMs) at a map threshold level appropriate for the 120KDa TFIIK molecular weight (Figure 5A orange density) and with a EM weight of 100. Satisfaction of the EM restraint is scored using the integral of the “overlap function” between GMMs calculated for EM map and subunit model components (course-grained flexible beads for unmodelled sequence and fine-grained bead representations for atomic models) (Robinson et al., 2015). The cross-link restraints for TFIIK modeling comprised a collection of cross-links involving the TFIIK subunits and Rad3 derived from our cross-link analysis of Med-PIC as well as earlier studies involving TFIIH (Luo et al., 2015; Murakami et al., 2013)(Figures 3 and S3). 120,000 TFIIK models were computed using Replica Exchange Gibbs sampling employing 64 replicas with temperatures ranging between 1.0 and 2.5 as described previously (Robinson et al., 2015). The solutions (500 best scoring models) were grouped by root-mean-square deviation (RMSD) k-means clustering, based on the position of the beads representing the subunits of the TFIIK. Cluster solutions were compared by calculating the probability of finding a given protein at any point in space (i.e., the localization density map). Analysis of the clustering solutions showed that essentially all top-scoring models showed a single TFIIK subunit architecture with only small deviations in the position of Ccl1. Importantly, a single arrangement of TFIIK subunits was found to satisfy both EM and crosslinking restraints, thus confirming the localization of TFIIK within the putative TFIIK difference density. IMP trials were also performed to model a subset of core GTFs (TFIIE and TFIIF) closely associated with pol II in the Med-PIC structure. For modeling, the pol II-core GTF complex was considered in isolation from the remainder of the PIC-Med complex. Crystal structures for pol II-TFIIB, TBP-TFIIA-DNA, TBP-TFIIB-DNA and EM fitting of a TFIIF Tfg1-Tfg2 dimerization domain homology model determined the pol II-GTF-DNA core of an earlier PIC model (Murakami et al., 2015). For further pol II-core GTF modelling, including the localization of TFIIE subunits (Tfa1 & 2) and the remaining portions of TFIIF (Tfg1 N- and C-term, Tfg2 C-term and Tfg3) the pol II-GTF-DNA core of the PIC model was first fitted into the Med-PIC map (Pettersen et al., 2004). The path of the promoter DNA was found to deviate from the PIC with a sharper bend at position −37, modeled using Coot (Emsley et al., 2010). IMP modeling involved representing the modified pol II-GTF-DNA model with beads at residue-level resolution and fixed in space as a single rigid body. For ‘mobile’ core GTF subunits, homology models were available for the Tfg2 C-term winged helix (WH) (Figure S6C), Tfa2 WH1 and 2, and the Tfa1 N-term domains (Murakami et al., 2015) with a crystal structure available for the Tfg3 N-term (PDB ID: 3QRL). A homology model for the Tfg3 C-term was generated using the solution structure of the bromodomain-containing protein 4 ET domain (PDB ID: 2JNS) using the Phyre2 server (Kelley et al., 2015). Regions of TFIIE and TFIIF subunits not covered by atomic models were represented with flexible beads (20 amino acids bead−1). The region of the Med-PIC EM map corresponding to the pol II-core GTF complex was generated by map segmentation and represented with a Gaussian mixture model (300 component) using an EM weight of 100. Crosslink restraints were derived from our cross-link analysis of Med-PIC supplemented with cross-links from earlier studies of pol II-GTF complexes (Chen et al., 2010; Muhlbacher et al., 2014; Murakami et al., 2013; Plaschka et al., 2015)(Figures 3 and S3). From 180,000 computed pol II-core GTF models the top scoring 500 solutions were classified by RMSD k-means clustering. Cluster analysis revealed three main structural classes. A single best scoring cluster also showed lower cross-link violation levels, higher cross-link satisfaction levels and a lower average cross-link distance than the next best scoring cluster. The subunit architecture of the best model solutions was revealed by calculating subunit localization density maps (Figures 3 and S6).
Med-PIC Map Interpretation and Model Building
The Med-PIC EM map was initially interpreted using parallel approaches. First, the crystal structures of pol II, Mediator Head, and a pol II-GTF core model derived from an earlier PIC study (based upon crystal structures for pol II-TFIIB, TBP-TFIIA-DNA, TBP-TFIIB-DNA and EM fitting of a TFIIF Tfg1-Tfg2 dimerization domain homology model) (Murakami et al., 2015) were fitted into the Med-PIC map using automatic docking procedures (Pettersen et al., 2004). Second, the EM structures of yeast PIC (Murakami et al., 2015) and core Med-Pol II inititation sub-complexes (Plaschka et al., 2015) were fit into Med-PIC map giving localizations for pol II, GTFs and Med Head that were consistent between both EM maps (Figure S7) and docked crystal structures. Lastly, our architectural model of the free yeast Mediator complex fitted at a single location in the Med-PIC structure that was consistent with the position of Head module based on EM and crystal structure docking (Figure 6A). In combination, these docking studies provided the location of the pol II- core GTF complex, the three Mediator modules and the TFIIH-TFIIE domain. A comparison of the Med-PIC and PIC maps showed a modest difference in the position of TFIIH-TFIIE, with a movement towards the TFIIH-Middle module contact point in the Med-PIC structure. This movement was consistent with the observation of an increased bend in the promoter DNA at position −37, which was required to preserve the downstream DNA-Ssl2 contact. A global rigid-body movement of the TFIIH homology models (Tfb2-Tfb5, Ssl2 and Rad3) from the earlier PIC study (Murakami et al., 2015) in the direction of the TFIIH movement was sufficient to achieve the best fit of these models in the Med-PIC density. Optimal docking of the S.cerevisiae Head module crystal structure involved a movement of the Mobile and Fixed Jaws relative to the Neck domain (Figure S4E), with no further structural modifications required. Middle module crystal and homology modules were fit initially into the Middle density by docking the Mediator architectural model. Next, the position of each rigid body (Med7N-31, Med7C-21 and Med4-9) was refined independently by automatic fitting procedures (Pettersen et al., 2004)(Figure S4C). The TFIIE and Tg2 WH domains were first placed into the map according to the subunit localization densities resulting from IMP modeling. Next the position of these domains was refined using automatic docking procedures into either the Med-PIC or PIC (Murakami et al., 2015) EM density maps. The refined position of the Tfa2 and Tfg2 WH domains differed slightly from those proposed in the PIC study (Murakami et al., 2015), whereas the position of the Tfa1 N-term remained unchanged.
QUANTIFICATION AND STATISTICAL ANALYSIS
Statistical confidence in the assignment of cross-linked spectra was determined using a target-decoy database searching approach, described in more detail in (Trnka et al., 2014) & (Robinson et al., 2015). Cross-linked spectral matches (CSMs) were split into equal sized test and training datasets. A support vector machine (SVM) model was built to discriminate between target and decoy CSMs in the training set, using the e1071 package for R. SVM models were compared at equal levels of specificity in the test set (92.5% of decoy CSMs correctly classified) and the model that gave the largest number of target hits at this level was selected. The final SVM model used Protein Prospector parameters: “Score Difference”, “Percent Ions Matched”, and “Peptide 2 Rank”. The scores of the final SVM model (“decision values”) are reported with an acceptance value greated than 0. Figure 3C shows the distributions of SVM scores for target and decoy cross-links (plotted for unique residue-pairs rather than CSMs and using a size normalized decoy distribution) as well as the acceptance threshold. P-values were calculated through a simple Z-test asking the likelihood that the SVM score of a given CSM was drawn from the decoy distribution. P-values are reported in Table S1.
The population level false discovery rate (FDR) for the cross-link data set was determined after reducing CSMs to unique residue pairs (“cross-links”) and applying additional selection criteria, such as minimum peptide length. The highest scoring spectral match is reported for each crosslink. The FDR was estimated by taking the number of Decoy cross-links and dividing by the number of Target cross-links × 10 (to account for the larger search space of the Decoy database). Figure 3C plots these distributions and reports the final FDR of 4% for the cross-linking data.
DATA AND SOFTWARE AVAILABILITY
Data resources
Mass Spectrometry Data
Annotated spectral assignments may be viewed online using MS-Viewer:
| http://prospector2.ucsf.edu/prospector/cgi-bin/msform.cgi?form=msviewer | |
| Med−PIC: | search key=an9t4zxaa7 |
| Med+PolII: | search key=oiba4ekrvi |
Raw MS data files in Thermo format have been deposited in the MassIVE repository:
| http://massive.ucsd.edu | |
| accession: | MSV000080013 |
EM and Model Data
A Cryo-EM map of full yeast Med-PIC has been deposited to the EMDataBank under accession number EMD-8308. Refined complexes lacking either the Mediator Tail module (ΔTail) or the TFIIE-H subunits (ΔTFIIE-IIH) were deposited to with accession numbers EMD-8305 and EMD-8307, respectively.
A Med-PIC model built into the ΔTail Med-PIC EM map was deposited to the RCSB Protein Data Bank with accession number 5SVA.
Supplementary Material
HIGHLIGHTS.
Isolation of a 52-protein, 2.5 MDa Mediator-RNA polymerase II initiation complex
Structural elucidation of the complex by cryo-EM and chemical cross-linking
Model for the regulation of CTD phosphorylation during transcription initiation
Mediator Tail module architecture and dynamics
Acknowledgments
We thank Riccardo Pellarin with help with Med-PIC integrative modeling and Shigeki Nagai and Kenji Murakami for providing purified transcription factors. We thank Dong-Hua Chen for support of the Stanford microscope facilities and JH Morris at the UCSF Resource for Biocomputing, Visualization, and Informatics (NIH P41 GM103311) for developing Cytoscape plugins for crosslink visualization. We thank Craig Kaplan at Texas A&M university for the kind gift of yeast strains and vectors. The work was supported by the US National Institutes of Health (NIH) grants R01 AI21144, GM49985, and GM36659 (to R.K.) and P41 GM103481 (to A.B.). We also acknowledge support from Human Frontier Science Program long-term fellowship LT00160 (to P.J.R.) and the US National Science Foundation through partnership in the BioXFEL Science Technology Center supported by grant NSF-1231306 (to R.K.). Yeast fermentation was performed using an instrument purchased using funds from the NIH S10 shared instrumentation grant S10RR028096. The QExactive Plus mass spectrometer was funded by grant S10D016229.
Footnotes
Publisher's Disclaimer: This is a PDF file of an unedited manuscript that has been accepted for publication. As a service to our customers we are providing this early version of the manuscript. The manuscript will undergo copyediting, typesetting, and review of the resulting proof before it is published in its final citable form. Please note that during the production process errors may be discovered which could affect the content, and all legal disclaimers that apply to the journal pertain.
SUPPLEMENTAL INFORMATION
Supplemental information includes seven figures, one table and one data file and can be found with this article online at http://X.
AUTHOR CONTRIBUTIONS
P.J.R and M.J.T conducted the experiments, P.J.R and D.A.B performed the cryo-EM image analysis. P.J.R performed the integrative modeling, P.J.R, R.D and P-J.M. contributed to complex assembly, P.J.R, M.J.T, A.L.B. and R.D.K. designed the experiments and wrote the paper.
References
- Allison LA, Ingles CJ. Mutations in RNA polymerase II enhance or suppress mutations in GAL4. Proceedings of the National Academy of Sciences of the United States of America. 1989;86:2794–2798. doi: 10.1073/pnas.86.8.2794. [DOI] [PMC free article] [PubMed] [Google Scholar]
- Asturias FJ, Jiang YW, Myers LC, Gustafsson CM, Kornberg RD. Conserved structures of mediator and RNA polymerase II holoenzyme. Science. 1999;283:985–987. doi: 10.1126/science.283.5404.985. [DOI] [PubMed] [Google Scholar]
- Baumli S, Hoeppner S, Cramer P. A conserved mediator hinge revealed in the structure of the MED7.MED21 (Med7.Srb7) heterodimer. The Journal of biological chemistry. 2005;280:18171–18178. doi: 10.1074/jbc.M413466200. [DOI] [PubMed] [Google Scholar]
- Beve J, Hu GZ, Myers LC, Balciunas D, Werngren O, Hultenby K, Wibom R, Ronne H, Gustafsson CM. The structural and functional role of Med5 in the yeast Mediator tail module. The Journal of biological chemistry. 2005;280:41366–41372. doi: 10.1074/jbc.M511181200. [DOI] [PubMed] [Google Scholar]
- Bich C, Maedler S, Chiesa K, DeGiacomo F, Bogliotti N, Zenobi R. Reactivity and applications of new amine reactive cross-linkers for mass spectrometric detection of protein-protein complexes. Analytical chemistry. 2010;82:172–179. doi: 10.1021/ac901651r. [DOI] [PubMed] [Google Scholar]
- Brenner C, Fuller RS. Structural and enzymatic characterization of a purified prohormone-processing enzyme: secreted, soluble Kex2 protease. Proceedings of the National Academy of Sciences of the United States of America. 1992;89:922–926. doi: 10.1073/pnas.89.3.922. [DOI] [PMC free article] [PubMed] [Google Scholar]
- Brzovic PS, Heikaus CC, Kisselev L, Vernon R, Herbig E, Pacheco D, Warfield L, Littlefield P, Baker D, Klevit RE, et al. The acidic transcription activator Gcn4 binds the mediator subunit Gal11/Med15 using a simple protein interface forming a fuzzy complex. Molecular cell. 2011;44:942–953. doi: 10.1016/j.molcel.2011.11.008. [DOI] [PMC free article] [PubMed] [Google Scholar]
- Bushnell DA, Bamdad C, Kornberg RD. A minimal set of RNA polymerase II transcription protein interactions. The Journal of biological chemistry. 1996;271:20170–20174. doi: 10.1074/jbc.271.33.20170. [DOI] [PubMed] [Google Scholar]
- Cai G, Chaban YL, Imasaki T, Kovacs JA, Calero G, Penczek PA, Takagi Y, Asturias FJ. Interaction of the mediator head module with RNA polymerase II. Structure. 2012;20:899–910. doi: 10.1016/j.str.2012.02.023. [DOI] [PMC free article] [PubMed] [Google Scholar]
- Carlson M. Genetics of transcriptional regulation in yeast: connections to the RNA polymerase II CTD. Annual review of cell and developmental biology. 1997;13:1–23. doi: 10.1146/annurev.cellbio.13.1.1. [DOI] [PubMed] [Google Scholar]
- Chen ZA, Jawhari A, Fischer L, Buchen C, Tahir S, Kamenski T, Rasmussen M, Lariviere L, Bukowski-Wills JC, Nilges M, et al. Architecture of the RNA polymerase II-TFIIF complex revealed by cross-linking and mass spectrometry. The EMBO journal. 2010;29:717–726. doi: 10.1038/emboj.2009.401. [DOI] [PMC free article] [PubMed] [Google Scholar]
- Emsley P, Lohkamp B, Scott WG, Cowtan K. Features and development of Coot. Acta crystallographica Section D, Biological crystallography. 2010;66:486–501. doi: 10.1107/S0907444910007493. [DOI] [PMC free article] [PubMed] [Google Scholar]
- Feaver WJ, Gileadi O, Li Y, Kornberg RD. CTD kinase associated with yeast RNA polymerase II initiation factor b. Cell. 1991;67:1223–1230. doi: 10.1016/0092-8674(91)90298-d. [DOI] [PubMed] [Google Scholar]
- Feaver WJ, Svejstrup JQ, Henry NL, Kornberg RD. Relationship of CDK-activating kinase and RNA polymerase II CTD kinase TFIIH/TFIIK. Cell. 1994;79:1103–1109. doi: 10.1016/0092-8674(94)90040-x. [DOI] [PubMed] [Google Scholar]
- Flanagan PM, Kelleher RJ, 3rd, Sayre MH, Tschochner H, Kornberg RD. A mediator required for activation of RNA polymerase II transcription in vitro. Nature. 1991;350:436–438. doi: 10.1038/350436a0. [DOI] [PubMed] [Google Scholar]
- Gerber HP, Hagmann M, Seipel K, Georgiev O, West MA, Litingtung Y, Schaffner W, Corden JL. RNA polymerase II C-terminal domain required for enhancer-driven transcription. Nature. 1995;374:660–662. doi: 10.1038/374660a0. [DOI] [PubMed] [Google Scholar]
- Guglielmi B, van Berkum NL, Klapholz B, Bijma T, Boube M, Boschiero C, Bourbon HM, Holstege FC, Werner M. A high resolution protein interaction map of the yeast Mediator complex. Nucleic acids research. 2004;32:5379–5391. doi: 10.1093/nar/gkh878. [DOI] [PMC free article] [PubMed] [Google Scholar]
- Heymann JB, Cardone G, Winkler DC, Steven AC. Computational resources for cryo-electron tomography in Bsoft. Journal of structural biology. 2008;161:232–242. doi: 10.1016/j.jsb.2007.08.002. [DOI] [PMC free article] [PubMed] [Google Scholar]
- Imasaki T, Calero G, Cai G, Tsai KL, Yamada K, Cardelli F, Erdjument-Bromage H, Tempst P, Berger I, Kornberg GL, et al. Architecture of the Mediator head module. Nature. 2011;475:240–243. doi: 10.1038/nature10162. [DOI] [PMC free article] [PubMed] [Google Scholar]
- Ito T, Chiba T, Ozawa R, Yoshida M, Hattori M, Sakaki Y. A comprehensive two-hybrid analysis to explore the yeast protein interactome. Proceedings of the National Academy of Sciences of the United States of America. 2001;98:4569–4574. doi: 10.1073/pnas.061034498. [DOI] [PMC free article] [PubMed] [Google Scholar]
- Jedidi I, Zhang F, Qiu H, Stahl SJ, Palmer I, Kaufman JD, Nadaud PS, Mukherjee S, Wingfield PT, Jaroniec CP, et al. Activator Gcn4 employs multiple segments of Med15/Gal11, including the KIX domain, to recruit mediator to target genes in vivo. The Journal of biological chemistry. 2010;285:2438–2455. doi: 10.1074/jbc.M109.071589. [DOI] [PMC free article] [PubMed] [Google Scholar]
- Kelley LA, Mezulis S, Yates CM, Wass MN, Sternberg MJ. The Phyre2 web portal for protein modeling, prediction and analysis. Nature protocols. 2015;10:845–858. doi: 10.1038/nprot.2015.053. [DOI] [PMC free article] [PubMed] [Google Scholar]
- Kim YJ, Bjorklund S, Li Y, Sayre MH, Kornberg RD. A multiprotein mediator of transcriptional activation and its interaction with the C-terminal repeat domain of RNA polymerase II. Cell. 1994;77:599–608. doi: 10.1016/0092-8674(94)90221-6. [DOI] [PubMed] [Google Scholar]
- Kornberg RD. Mediator and the mechanism of transcriptional activation. Trends in biochemical sciences. 2005;30:235–239. doi: 10.1016/j.tibs.2005.03.011. [DOI] [PubMed] [Google Scholar]
- Koschubs T, Seizl M, Lariviere L, Kurth F, Baumli S, Martin DE, Cramer P. Identification, structure, and functional requirement of the Mediator submodule Med7N/31. The EMBO journal. 2009;28:69–80. doi: 10.1038/emboj.2008.254. [DOI] [PMC free article] [PubMed] [Google Scholar]
- Kremer JR, Mastronarde DN, McIntosh JR. Computer visualization of three-dimensional image data using IMOD. Journal of structural biology. 1996;116:71–76. doi: 10.1006/jsbi.1996.0013. [DOI] [PubMed] [Google Scholar]
- Lariviere L, Plaschka C, Seizl M, Petrotchenko EV, Wenzeck L, Borchers CH, Cramer P. Model of the Mediator middle module based on protein cross-linking. Nucleic acids research. 2013;41:9266–9273. doi: 10.1093/nar/gkt704. [DOI] [PMC free article] [PubMed] [Google Scholar]
- Lariviere L, Plaschka C, Seizl M, Wenzeck L, Kurth F, Cramer P. Structure of the Mediator head module. Nature. 2012;492:448–451. doi: 10.1038/nature11670. [DOI] [PubMed] [Google Scholar]
- Laybourn PJ, Dahmus ME. Phosphorylation of RNA polymerase IIA occurs subsequent to interaction with the promoter and before the initiation of transcription. The Journal of biological chemistry. 1990;265:13165–13173. [PubMed] [Google Scholar]
- Liu X, Bushnell DA, Wang D, Calero G, Kornberg RD. Structure of an RNA polymerase II-TFIIB complex and the transcription initiation mechanism. Science. 2010;327:206–209. doi: 10.1126/science.1182015. [DOI] [PMC free article] [PubMed] [Google Scholar]
- Luo J, Cimermancic P, Viswanath S, Ebmeier CC, Kim B, Dehecq M, Raman V, Greenberg CH, Pellarin R, Sali A, et al. Architecture of the Human and Yeast General Transcription and DNA Repair Factor TFIIH. Molecular cell. 2015;59:794–806. doi: 10.1016/j.molcel.2015.07.016. [DOI] [PMC free article] [PubMed] [Google Scholar]
- Max T, Sogaard M, Svejstrup JQ. Hyperphosphorylation of the C-terminal repeat domain of RNA polymerase II facilitates dissociation of its complex with mediator. The Journal of biological chemistry. 2007;282:14113–14120. doi: 10.1074/jbc.M701345200. [DOI] [PubMed] [Google Scholar]
- Muhlbacher W, Sainsbury S, Hemann M, Hantsche M, Neyer S, Herzog F, Cramer P. Conserved architecture of the core RNA polymerase II initiation complex. Nature communications. 2014;5:4310. doi: 10.1038/ncomms5310. [DOI] [PubMed] [Google Scholar]
- Murakami K, Elmlund H, Kalisman N, Bushnell DA, Adams CM, Azubel M, Elmlund D, Levi-Kalisman Y, Liu X, Gibbons BJ, et al. Architecture of an RNA polymerase II transcription pre-initiation complex. Science. 2013;342:1238724. doi: 10.1126/science.1238724. [DOI] [PMC free article] [PubMed] [Google Scholar]
- Murakami K, Gibbons BJ, Davis RE, Nagai S, Liu X, Robinson PJ, Wu T, Kaplan CD, Kornberg RD. Tfb6, a previously unidentified subunit of the general transcription factor TFIIH, facilitates dissociation of Ssl2 helicase after transcription initiation. Proceedings of the National Academy of Sciences of the United States of America. 2012;109:4816–4821. doi: 10.1073/pnas.1201448109. [DOI] [PMC free article] [PubMed] [Google Scholar]
- Murakami K, Tsai KL, Kalisman N, Bushnell DA, Asturias FJ, Kornberg RD. Structure of an RNA polymerase II preinitiation complex. Proceedings of the National Academy of Sciences of the United States of America. 2015;112:13543–13548. doi: 10.1073/pnas.1518255112. [DOI] [PMC free article] [PubMed] [Google Scholar]
- Nonet M, Sweetser D, Young RA. Functional redundancy and structural polymorphism in the large subunit of RNA polymerase II. Cell. 1987;50:909–915. doi: 10.1016/0092-8674(87)90517-4. [DOI] [PubMed] [Google Scholar]
- Pettersen EF, Goddard TD, Huang CC, Couch GS, Greenblatt DM, Meng EC, Ferrin TE. UCSF Chimera–a visualization system for exploratory research and analysis. Journal of computational chemistry. 2004;25:1605–1612. doi: 10.1002/jcc.20084. [DOI] [PubMed] [Google Scholar]
- Plaschka C, Lariviere L, Wenzeck L, Seizl M, Hemann M, Tegunov D, Petrotchenko EV, Borchers CH, Baumeister W, Herzog F, et al. Architecture of the RNA polymerase II-Mediator core initiation complex. Nature. 2015;518:376–380. doi: 10.1038/nature14229. [DOI] [PubMed] [Google Scholar]
- Robinson PJ, Bushnell DA, Trnka MJ, Burlingame AL, Kornberg RD. Structure of the mediator head module bound to the carboxy-terminal domain of RNA polymerase II. Proceedings of the National Academy of Sciences of the United States of America. 2012;109:17931–17935. doi: 10.1073/pnas.1215241109. [DOI] [PMC free article] [PubMed] [Google Scholar]
- Robinson PJ, Trnka MJ, Pellarin R, Greenberg CH, Bushnell DA, Davis R, Burlingame AL, Sali A, Kornberg RD. Molecular architecture of the yeast Mediator complex. eLife. 2015;4 doi: 10.7554/eLife.08719. [DOI] [PMC free article] [PubMed] [Google Scholar]
- Scafe C, Chao D, Lopes J, Hirsch JP, Henry S, Young RA. RNA polymerase II C-terminal repeat influences response to transcriptional enhancer signals. Nature. 1990;347:491–494. doi: 10.1038/347491a0. [DOI] [PubMed] [Google Scholar]
- Scheres SH. RELION: implementation of a Bayesian approach to cryo-EM structure determination. Journal of structural biology. 2012;180:519–530. doi: 10.1016/j.jsb.2012.09.006. [DOI] [PMC free article] [PubMed] [Google Scholar]
- Spahr H, Calero G, Bushnell DA, Kornberg RD. Schizosacharomyces pombe RNA polymerase II at 3.6-A resolution. Proceedings of the National Academy of Sciences of the United States of America. 2009;106:9185–9190. doi: 10.1073/pnas.0903361106. [DOI] [PMC free article] [PubMed] [Google Scholar]
- Suh H, Hazelbaker DZ, Soares LM, Buratowski S. The C-terminal domain of Rpb1 functions on other RNA polymerase II subunits. Molecular cell. 2013;51:850–858. doi: 10.1016/j.molcel.2013.08.015. [DOI] [PMC free article] [PubMed] [Google Scholar]
- Svejstrup JQ, Li Y, Fellows J, Gnatt A, Bjorklund S, Kornberg RD. Evidence for a mediator cycle at the initiation of transcription. Proceedings of the National Academy of Sciences of the United States of America. 1997;94:6075–6078. doi: 10.1073/pnas.94.12.6075. [DOI] [PMC free article] [PubMed] [Google Scholar]
- Takagi Y, Kornberg RD. Mediator as a general transcription factor. The Journal of biological chemistry. 2006;281:80–89. doi: 10.1074/jbc.M508253200. [DOI] [PubMed] [Google Scholar]
- Tang G, Peng L, Baldwin PR, Mann DS, Jiang W, Rees I, Ludtke SJ. EMAN2: an extensible image processing suite for electron microscopy. Journal of structural biology. 2007;157:38–46. doi: 10.1016/j.jsb.2006.05.009. [DOI] [PubMed] [Google Scholar]
- Thompson CM, Young RA. General requirement for RNA polymerase II holoenzymes in vivo. Proceedings of the National Academy of Sciences of the United States of America. 1995;92:4587–4590. doi: 10.1073/pnas.92.10.4587. [DOI] [PMC free article] [PubMed] [Google Scholar]
- Trnka MJ, Baker PR, Robinson PJ, Burlingame AL, Chalkley RJ. Matching cross-linked peptide spectra: only as good as the worse identification. Molecular & cellular proteomics: MCP. 2014;13:420–434. doi: 10.1074/mcp.M113.034009. [DOI] [PMC free article] [PubMed] [Google Scholar]
- Tsai KL, Tomomori-Sato C, Sato S, Conaway RC, Conaway JW, Asturias FJ. Subunit architecture and functional modular rearrangements of the transcriptional mediator complex. Cell. 2014;157:1430–1444. doi: 10.1016/j.cell.2014.05.015. [DOI] [PMC free article] [PubMed] [Google Scholar]
- Uetz P, Giot L, Cagney G, Mansfield TA, Judson RS, Knight JR, Lockshon D, Narayan V, Srinivasan M, Pochart P, et al. A comprehensive analysis of protein-protein interactions in Saccharomyces cerevisiae. Nature. 2000;403:623–627. doi: 10.1038/35001009. [DOI] [PubMed] [Google Scholar]
- Wang X, Sun Q, Ding Z, Ji J, Wang J, Kong X, Yang J, Cai G. Redefining the modular organization of the core Mediator complex. Cell research. 2014;24:796–808. doi: 10.1038/cr.2014.64. [DOI] [PMC free article] [PubMed] [Google Scholar]
- Winston F, Dollard C, Ricupero-Hovasse SL. Construction of a set of convenient Saccharomyces cerevisiae strains that are isogenic to S288C. Yeast. 1995;11:53–55. doi: 10.1002/yea.320110107. [DOI] [PubMed] [Google Scholar]
- Wong KH, Jin Y, Struhl K. TFIIH phosphorylation of the Pol II CTD stimulates mediator dissociation from the preinitiation complex and promoter escape. Molecular cell. 2014;54:601–612. doi: 10.1016/j.molcel.2014.03.024. [DOI] [PMC free article] [PubMed] [Google Scholar]
- Zhang F, Sumibcay L, Hinnebusch AG, Swanson MJ. A triad of subunits from the Gal11/tail domain of Srb mediator is an in vivo target of transcriptional activator Gcn4p. Molecular and cellular biology. 2004;24:6871–6886. doi: 10.1128/MCB.24.15.6871-6886.2004. [DOI] [PMC free article] [PubMed] [Google Scholar]
- Zheng SQ, Keszthelyi B, Branlund E, Lyle JM, Braunfeld MB, Sedat JW, Agard DA. UCSF tomography: an integrated software suite for real-time electron microscopic tomographic data collection, alignment, and reconstruction. Journal of structural biology. 2007;157:138–147. doi: 10.1016/j.jsb.2006.06.005. [DOI] [PubMed] [Google Scholar]
Associated Data
This section collects any data citations, data availability statements, or supplementary materials included in this article.