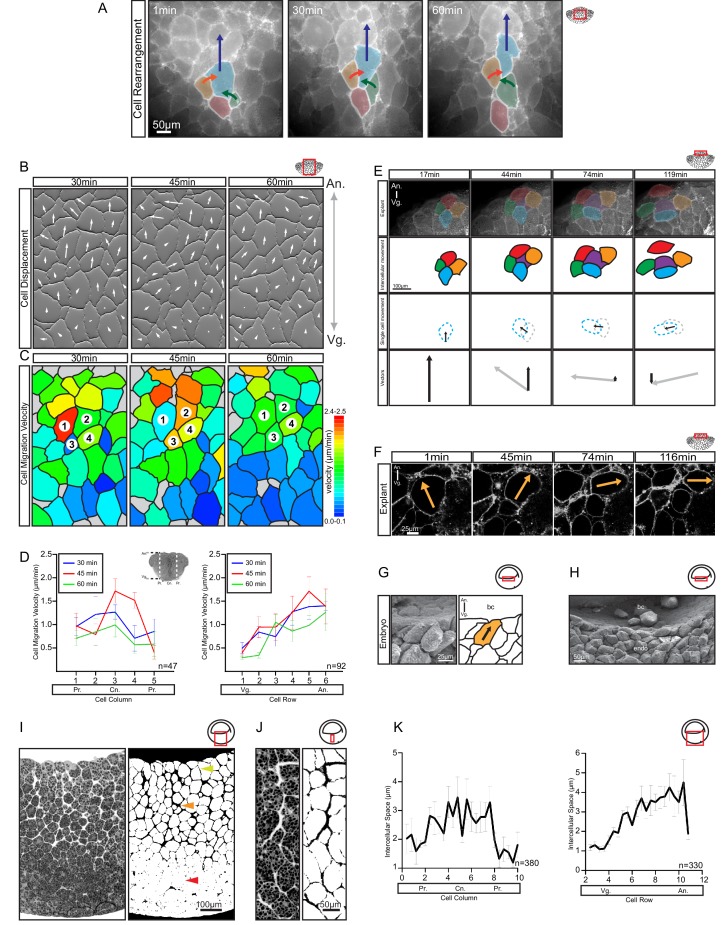
Figure 4. Differential cell migration.
(A) Cell rearrangement in explants. A leading cell (blue) moves away from the lagging cell (red), neighbouring cells (orange, green) converge to fill the gap. Corresponding trajectories are shown (coloured arrows). (B) Cell displacement in explants. Displacements were recorded starting 15 min after explantation. Panels indicate changes in cell positions between 15–30, 30–45, and 45–60 min. Direction and magnitude of displacements (white arrows) are indicated. (C) Migration velocity variability in explants. Velocities correspond to displacements shown in (B). Cells 1–4 move as described in (A). Colours refer to velocity scale (right). Grey cells were not tracked due to poor visibility. (D) Migration velocity in cell columns (left) and rows (right). Plots show average instantaneous velocities at different time intervals after explantation (colours). Bars indicate S.E. Schematic marks the explant center (Cn), periphery (Pr), animal (An), and vegetal (Vg) boundaries. Panels show data from three embryos from different egg batches. (E) Total velocity is maintained while its vertical component is reduced at the BCF as cells change orientation. Cell movement (top row). Cohort (top-mid row) shows a leading cell (green) advancing laterally relative to the lagging cell (orange), the gap that opens is filled by an inserting deep cell (purple). Cell near the surface (red) remained parallel to the BCF. A deep cell (blue) initially oriented perpendicular to the surface re-oriented to a parallel alignment with the BCF. Cell re-orientation (bottom-mid row) of deep cell (blue dashed outline) relative to its previous position (grey dashed outline) is indicated (arrow). Re-orienting cell velocity vectors (bottom) showing the vertical component (black arrow) relative to the total velocity vector (grey arrow). (F) Cell re-orientation. Optical section shows that the entire cell body is rotated during re-orientation. Movement is indicated (orange arrow). (G, H) Cell morphology in the embryo is consistent with cell reorientation and insertion at the BCF. SEM of cells at the BCF of stage 10.5 gastrulae (left), elongated cell is highlighted (orange, black arrow), blastocoel (bc) is indicated. endo, vegetal endoderm cells. (I, J) Interstitial gaps between cells in the embryo. (I) TEM section through the endoderm (left), negative of TEM (right). Gap width varies between the top (yellow arrow), mid (orange arrow), and bottom cell layers (red arrow). (J) A vertical series of gaps shows gap-width increase in a vegetal to animal direction. (K) Gap width in cell columns (left) and rows (right) in gastrulae. Error bars indicate S.E. Panels show data from six embryos from different egg batches. Schematic of the region of interest (red box) is indicated in the top right corner of select panels.


