. 2017 Jul 18;6:e23871. doi: 10.7554/eLife.23871

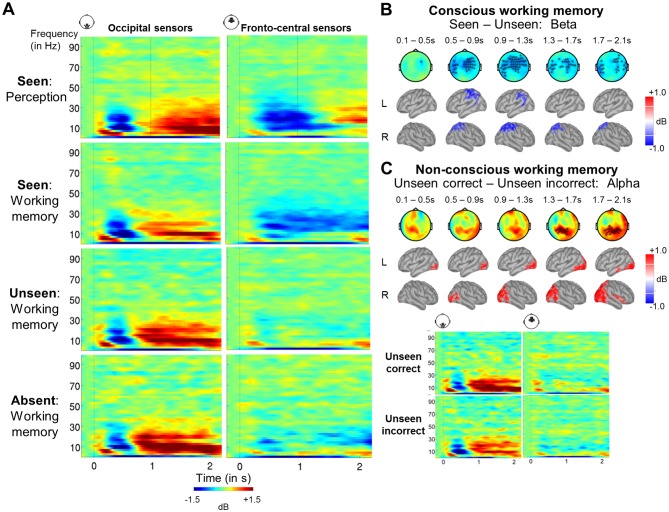
Figure 4. A sustained decrease in alpha/beta power as a marker of conscious working memory.

(A) Average time-frequency power relative to baseline (dB) as a function of task and visibility category in a group of occipital (left) and fronto-central (right) magnetometers. Mean reaction time (target-present trials) for the visibility response in the perception task is indicated as a vertical, dotted line. (B) Beta band activity (13–30 Hz; 0–2.1 s) related to conscious working memory (seen – unseen trials) as shown in magnetometers (top) and source space (bottom; in dB relative to baseline). Black asterisks indicate sensors showing a significant difference as assessed by a Monte-Carlo permutation test. (C) Same as in (A) and (B) but for unseen correct and unseen incorrect trials in the alpha band (8–12 Hz). 

DOI: http://dx.doi.org/10.7554/eLife.23871.007

Figure 4.

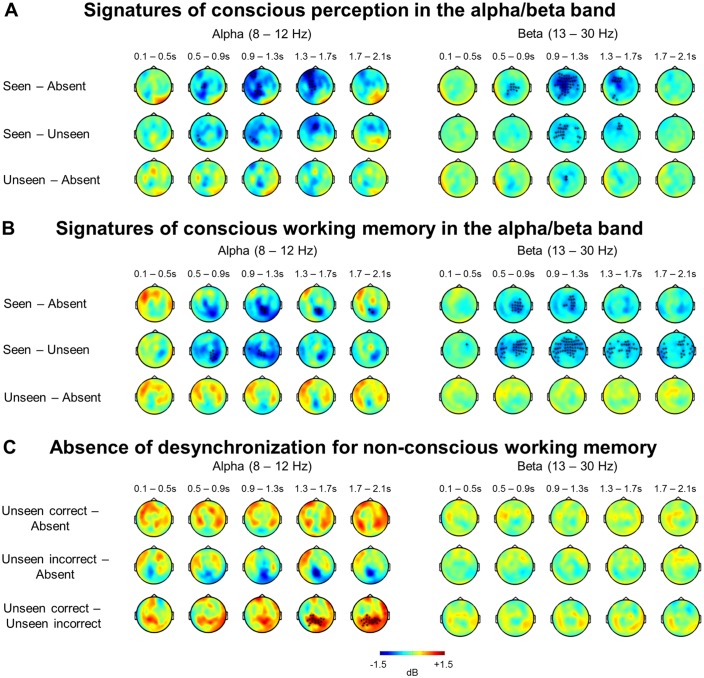
Figure 4—figure supplement 1. Alpha- and beta-band desynchronizations serve as a general signature of conscious processing and conscious working memory.

Figure 4—figure supplement 1.

(A) Perception task: Topographies represent the power difference (magnetometers) for seen vs target-absent trials (top), seen vs unseen trials (middle), and unseen vs target-absent trials (bottom) in the alpha (8–12 Hz) and beta (13–30 Hz) frequency bands as a function of time (0–2.1 s). Black asterisks indicate sensors showing a significant difference as assessed by a cluster-based permutation test. (B) Working memory task: Topographies and panels are as in (A). (C) Working memory task: Topographies represent the power difference (magnetometers) for unseen correct vs target-absent trials (top), unseen incorrect vs target-absent trials (middle), and unseen correct vs unseen incorrect trials (bottom) in the alpha (8–12 Hz) and beta (13–30 Hz) frequency bands as a function of time (0–2.1 s). Black asterisks indicate sensors showing a significant difference as assessed by a cluster-based permutation test.
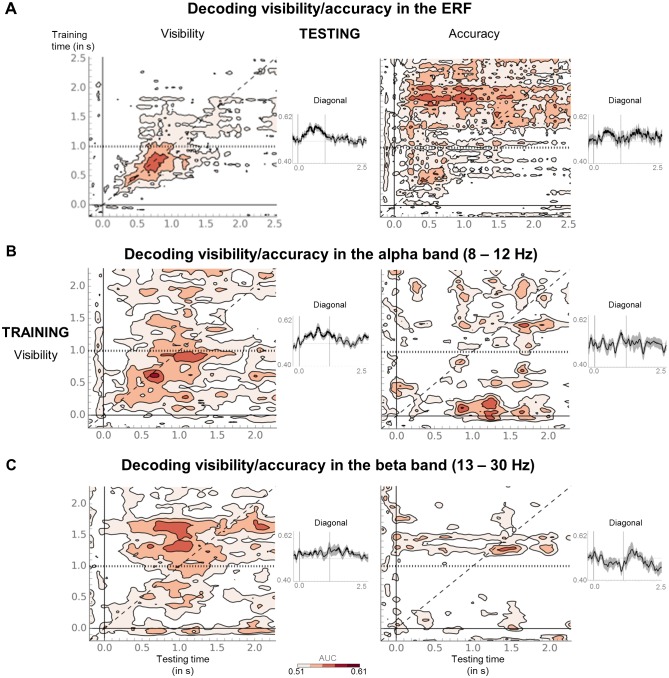
Figure 4—figure supplement 2. Seen and unseen correct trials do not share the same discriminative decoding axis.

Figure 4—figure supplement 2.

(A) Temporal generalization matrices for a decoder trained on ERFs to distinguish seen from unseen trials in the perception task and tested in the working memory task, either with the same labels (visibility decoder; left) or the unseen correct and incorrect trials (accuracy decoder; right). In each panel, a classifier was trained at every time sample (y-axis) and tested on all other time points (x-axis). The diagonal gray line demarks classifiers trained and tested on the same time sample. Please note the additional event marker: Mean reaction time (target-present trials) for the visibility response is indicated as a horizontal, dotted line. Any classifier beyond this point only reflects post-visibility processes. Time courses of diagonal decoding are shown as black insets. Thick lines indicate significant, above-chance decoding (Wilcoxon signed-rank test across subjects, uncorrected, one-tailed). For display purposes, data were smoothed using a moving average with a window of eight samples. (B) Same as in (A), except that the decoder was trained and tested on average power (relative to baseline) in the alpha band (8–12 Hz). For display purposes, data were smoothed using a moving average with a window of one sample. (C) Same as in (B), except that the decoder was trained and tested on average power (relative to baseline) in the beta band (13–30 Hz). AUC = area under the curve.
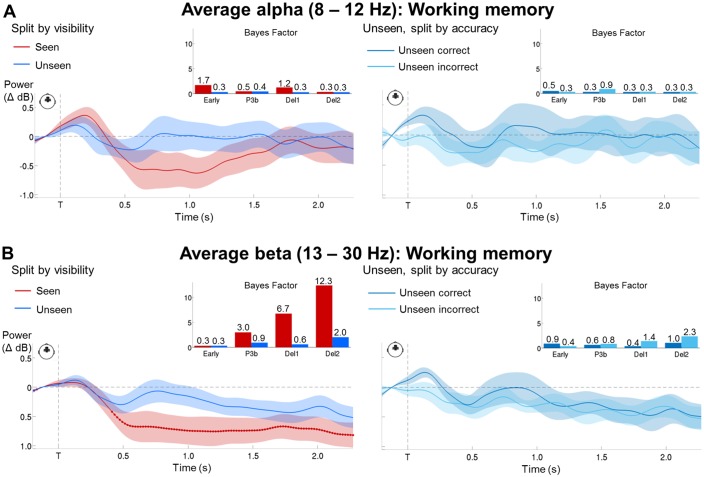
Figure 4—figure supplement 3. Bayesian statistics for the time-frequency analyses.

Figure 4—figure supplement 3.

(A) Time courses of average alpha band activity (8–12 Hz; −0.2–2.1 s) in a group of frontal sensors as a function of visibility (left) and accuracy on the unseen trials (right; correct = within ±2 positions of the actual target location). Shaded area demarks standard error of the mean (SEM) across subjects. Thick line represents significant difference in power relative to baseline (Wilcoxon signed-rank test across subjects). Insets show Bayes Factors (as assessed in a two-tailed t-test) in four time windows: 100–300 ms (early), 300–600 ms (P3b), 0.6–1.55 s (Del1), and 1.55–2.1 s (Del2). Del1 = first part of the delay, Del2 = second part of the delay, T = target onset. (B) Same as in (A), but for average beta band (13–30 Hz) activity.