Abstract
The biology of sperm, its capability of fertilizing an egg and its role in sex ratio are the major biological questions in reproductive biology. To answer these question we integrated X and Y chromosome transcriptome across different species: Bos taurus and Sus scrofa and identified reproductive driver genes based on Weighted Gene Co-Expression Network Analysis (WGCNA) algorithm. Our strategy resulted in 11007 and 10445 unique genes consisting of 9 and 11 reproductive modules in Bos taurus and Sus scrofa, respectively. The consensus module calculation yields an overall 167 overlapped genes which were mapped to 846 DEGs in Bos taurus to finally get a list of 67 dual feature genes. We develop gene co-expression network of selected 67 genes that consists of 58 nodes (27 down-regulated and 31 up-regulated genes) enriched to 66 GO biological process (BP) including 6 GO annotations related to reproduction and two KEGG pathways. Moreover, we searched significantly related TF (ISRE, AP1FJ, RP58, CREL) and miRNAs (bta-miR-181a, bta-miR-17-5p, bta-miR-146b, bta-miR-146a) which targeted the genes in co-expression network. In addition we performed genetic analysis including phylogenetic, functional domain identification, epigenetic modifications, mutation analysis of the most important reproductive driver genes PRM1, PPP2R2B and PAFAH1B1 and finally performed a protein docking analysis to visualize their therapeutic and gene expression regulation ability.
Keywords: spermatogenesis, spermiogenesis, fertilization, WGCNA, reproduction
INTRODUCTION
The sex chromosomes XY or ZW in case of mammals or birds varies both phylogenetically and structurally among different taxonomical classes with many similar features and is under selective pressure that shapes their evolution [1, 2, 3]. The karyotypes shows that the hemizygous chromosome Y or W as short, heterochromatic containing few genes while on the other hand the homozygous chromosomes X or Z is of same size to that of autosomes and contains similar amount of genes although it tends to cluster functionally similar genes together most of which are enriched for reproduction and differentiation [4].
Reproduction is the fundamental biological process by which animals produce their offspring. In mammals it is done by sexual reproduction where a haploid sperm from male fertilizes a haploid oocyte to restore the chromosome number. To explore the reproductive driver genes that can improve the reproductive health and fertility is at the core of reproductive biology. The recent advances in sequencing technologies and its analysis have a strong potential to find out genes that can improve the overall reproductive performance of farm animals including cow and pig. To this end, we first integrated X and Y chromosome transcriptome across different species: Bos taurus and Sus scrofa to identify reproductive driver genes based on Weighted Gene Co-Expression Network Analysis (WGCNA) algorithm. The schematic diagram for a multi-step strategy to identify reproductive driver genes is shown in Figure 1.
Figure 1. A multi-step Strategy.
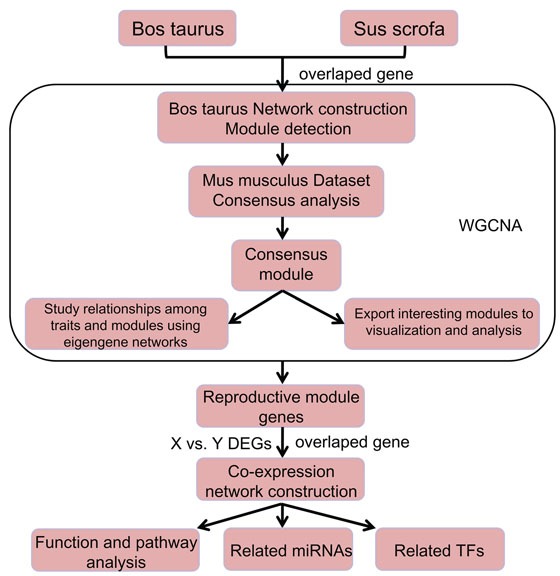
The schematic diagram for a multi-step strategy to identify reproductive driver genes.
The paternal genetic material across different species is transferred to oocyte by sperm after several dramatic morphological and physical changes [5]. A global transcriptional silencing occurs after meiosis as sperm nuclear basic proteins replaces somatic histones and cause tight DNA compaction [6, 7], and also most of the cytoplasmic material including ribosomes are discarded [8]. At this stage post translational mediators during the process of morphogenesis and motility of sperm become most important as there is no global transcription and translation [5]. The sperm motility is crucial for its ability to fertilize oocyte where PP1 a sperm specific phosphatase in mouse [9, 10] and GSP 3/4 in C. elegans have been shown important phosphatases for sperm motility [5]. The process of male and female gametes i.e. sperm and oocyte to unite and form a zygote is termed as fertilization. The sperm passes several developmental stages before it can reach oocyte in the female body to fertilize it. One such process is when the spermatids start to develop tails which will help them to swim in female reproductive tract to reach oocyte. This process is under strict control of gene expression. It has been observed that a change in gene expression level preferentially benefits X or Y chromosome bearing spermatozoa to develop tails and causes a skewed female or male sex ratio. In this scenario, genes that are responsible for sperm maturity takes a central position as candidate genes for sex ratio control. The WGCNA analysis also determines a cohort of genes that determine the process of sperm maturity and their preferential selection for tail development of specific X or Y chromosome bearing spermatozoa hence providing grounds for their selection as candidate genes in sex ratio control [5].
The genes involved in sexual development, spermatogenesis, spermatid development and differentiation and pregnancy are of vital importance in reproductive biology. Spermatogenesis is a complex process that is involved in the development of highly differentiated haploid sperms from diploid spermatogonial stem cells that is further divided into three phases of almost equal length, the spermatogoniogenesis [11], meiosis that generates four haploid spermatids [12] and spermiogenesis a process of dramatic morphological changes from spermatid to mature spermatozoa [13]. Spermatogenesis sequence of happenings is well defined in mammals and takes place in seminiferous tubules of the testes that is initiated at puberty, a continuous process in reproductively active adults to maintain the continuous sperm production with a fully controlled timing, in mouse it is 35 days [14].
The present study explores the integrated X and Y chromosome trancriptome across Bos taurus and Sus scrofa and identified important reproductive driver genes including PRM1, PPP2R2B and PAFAH1B1. Interestingly various immune related genes are also expressed together with genes involved in reproduction suggesting its probable role in reproduction specifically in preferential selection of X and Y chromosome bearing spermatozoa before fertilization. The preferential selection of X or Y chromosome bearing spermatozoa by female can have a profound importance for farm animals where farmers can select animals gender without the risk of losing subsequent fertilization ability of sperm in female oviduct that are exposed to sorted sperm [15]. Furthermore, the present study conducts complete genetic analysis of the genes to figure out its comprehensive role in reproduction. Moreover, protein docking analysis is performed to assess its therapeutic potential in case of infertility or its potential use as sex ratio control as well as to regulate the gene expression profile. Hence the present study is designed to explore an important economic aspect in animal reproduction with wide applicability.
RESULTS
Data pre-processing
In present study, we got 11007 and 10445 unique genes in Bos taurus and Sus scrofa, respectively, where we normalized expression data with Limma package. Expression data, before and after normalization can be found in Supplementary Table 1 (GSE47139-before.txt”, “GSE47139-norm.txt”, “xy-before.txt” and “xy-norm.txt) and Supplementary Figure 1. Bos taurus and Sus scrofa expression data shared 555 homologous genes which were listed in Supplementary Table 2.
Consensus modules identification of Bos taurus and Sus scrofa
Definition of adjacency function
In order to satisfy the preconditions of scale-free network distribution, we need to explore the value of the adjacency matrix weight parameter: power. The power plot was shown in Figure 2. The higher the square of the correlation coefficient is, the closer the network is to the network-free distribution. We choose power = 20 as the power cutoff, when the square of the correlation coefficient reached 0.9 for the first time.
Figure 2. Adjacency matrix weight parameter power plot.
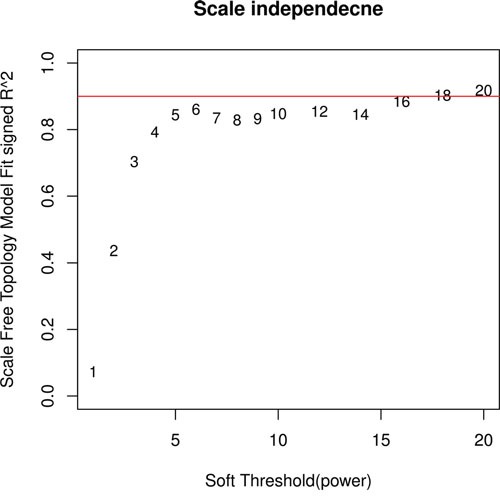
The horizontal axis represents the weight parameter power, the vertical axis represents the square of the correlation coefficient between log (k) and log (p (k)).
Identification consensus modules of Bos taurus
We regarded Bos taurus gene expression data as training dataset, constructed network and mined gene modules based on 555 shared genes in Bos taurus. Firstly, the coefficients of dissimilarity between genes were calculated, and the system clustering tree was obtained. Then cut the clustering tree according to standard for hybrid dynamic shear trees. We set minimum number of genes per module to 30 genes and the pruning height to cutHeight = 0.9. We finally got 9 different modules in Bos taurus gene expression data, shown in Figure 3A.
Figure 3.

Module clustering tree of Bos taurus (A) and Sus scrofa (B). Different colours in module bar mean different modules. D1 and D2 refer to Bos taurus and Sus scrofa datasets, respectively. M1 to M11 mean different module numbers.
Screening consensus modules in Sus scrofa
We also screened gene modules in Sus scrofa by using same method and parameters as in Bos taurus. We obtained 11 gene modules in Sus scrofa, 2 more modules than that in Bos taurus, as shown in Figure 3B. Then we calculate consensus of every two modules in Bos taurus and Sus scrofa. The consistency of modules was displayed in Figure 4. Information for each module and overlapped genes were listed in Table 1. Genes and their corresponding colors of Bos taurus and Sus scrofa can be found in Supplementary Table 3.
Figure 4. Correspondence of Bos taurus-specific modules and Sus scrofa-specific modules.
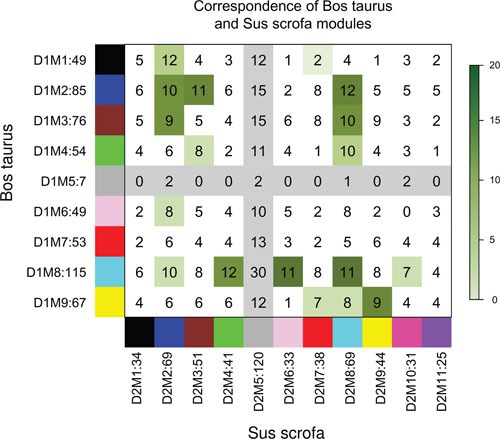
Numbers in boxes refer to overlapped genes in every two modules. Color bar in the left means significance p value of module consensus,0-20 represents –log2(p value).
Table 1. Characterization of Bos taurus and Sus scrofa modules.
| Bos taurus Module | Sus scrofa Module | Module color | Bos taurus module gene count | Sus scrofa module gene count | Overlap number | Overlap p value |
|---|---|---|---|---|---|---|
| D1M1 | D2M2 | black-blue | 49 | 69 | 12 | 0.00817 |
| D1M1 | D2M7 | black-red | 49 | 38 | 2 | 0.0423 |
| D1M2 | D2M2 | blue-blue | 85 | 69 | 10 | 0.00846 |
| D1M2 | D2M3 | blue-brown | 85 | 50 | 11 | 0.00679 |
| D1M2 | D2M8 | blue-turquoise | 85 | 69 | 12 | 0.000142 |
| D1M3 | D2M2 | brown-blue | 76 | 69 | 9 | 0.00035 |
| D1M3 | D2M8 | brown-turquoise | 76 | 69 | 10 | 0.000482 |
| D1M4 | D2M3 | green-brown | 54 | 50 | 8 | 0.0116 |
| D1M4 | D2M8 | green-turquoise | 54 | 69 | 10 | 0.0047 |
| D1M6 | D2M2 | pink-blue | 49 | 69 | 8 | 0.0144 |
| D1M8 | D2M2 | turquoise-blue | 114 | 69 | 10 | 0.0102 |
| D1M8 | D2M4 | turquoise-green | 114 | 41 | 12 | 0.00047 |
| D1M8 | D2M6 | turquoise-pink | 114 | 33 | 11 | 0.008203 |
| D1M8 | D2M8 | turquoise-turquoise | 114 | 69 | 11 | 0.00848 |
| D1M8 | D2M10 | turquoise-magenta | 114 | 31 | 7 | 0.00134 |
| D1M9 | D2M7 | yellow-red | 68 | 38 | 7 | 0.00123 |
| D1M9 | D2M8 | yellow-turquoise | 68 | 69 | 8 | 0.00136 |
| D1M9 | D2M9 | yellow-yellow | 68 | 44 | 9 | 0.000435 |
We collected significantly overlapped genes in consensus modules for further analysis, that is to say, a total of 167 genes in column 6 of Table 1, which were listed in Supplementary Table 4.
Gene significance analysis
A gene set with 846 gene which met cutoff (p<0.05 and |log2FC|>0.585) were screened as DEGs in Bos taurus by using Limma package in R language, statistic test volcano plot and heatmap were shown as Figure 5A and 5B, DEGs were listed in Supplementary Table 5. Then we mapped DEGs into 167 module genes selected previously, we finally found 67 genes which had dual features: significantly expressed between X and Y chromosome transcriptome, as well as significantly overlapped in consensus modules. The 67 dual featured genes were included into further analysis (gene list can be found in Supplementary Table 6).
Figure 5.
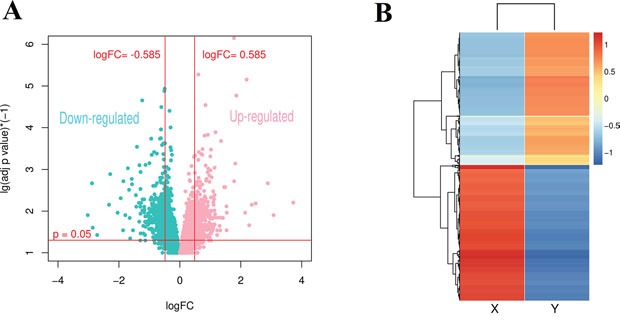
(A) Volcano plot of statistic test for gene expression in Bos taurus. (B) Heatmap of DEGs in Bos taurus.
Construction of co-expression network of shared genes
We calculated expression correlation coefficient of 67 interested genes and ticked out gene pairs whose correlation coefficient below 0.8 (correlation coefficient matrix was in Supplementary Table 7), finally constructed co-expression network among 67 genes, as shown in Figure 6. The co-expression network was consist of 58 nodes (27 down-regulated and 31 up-regulated genes) and 497 edges.
Figure 6. Co-expression network of 67 selected genes.

Red and green nodes refer to up and down regulated genes in Bos taurus; dash and solid edge mean negative and positive correlation coefficient.
Functional and KEGG pathway analysis of the network genes
We enriched genes in the co-expression network to GO and KEGG pathway, and got 66 significantly related GO biology process (BP) annotation and 2 KEGG pathways with cutoff of p<0.05. We extracted 6 GO annotations which were related to reproduction to display, as shown in Figure 7, listed in Table 2-1. The KEGG pathway analysis list can be found in Table 2-2 The complete table for GO annotations can be found in Supplementary Table 8.
Figure 7. Barplot for reproduction related GO annotations.
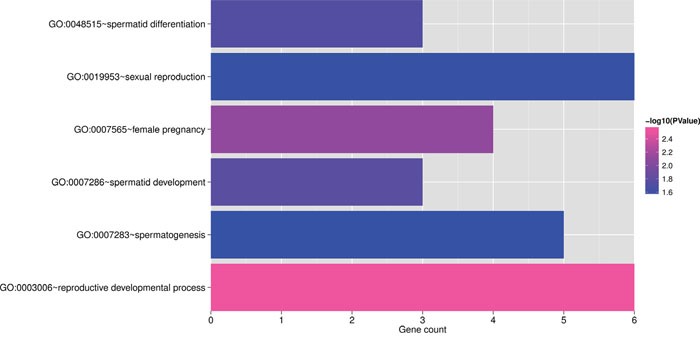
The horizontal axis represents gene count, the vertical axis represents GO annotations, color bar shows –log (p), where p is enrichment significant.
Table 2-1. Reproduction related GO annotations list.
| Term | Count | P Value | Genes |
|---|---|---|---|
| GO:0003006˜reproductive developmental process | 6 | 0.002729 | INHBB, HMGB2, PAFAH1B1, EPOR, PRM1, PPP2R2B |
| GO:0019953˜sexual reproduction | 6 | 0.026424 | OVGP1, HMGB2, GPX4, PAFAH1B1, PRM1, PPP2R2B |
| GO:0007283˜spermatogenesis | 5 | 0.026725 | HMGB2, GPX4, PAFAH1B1, PRM1, PPP2R2B |
| GO:0007565˜female pregnancy | 4 | 0.00777 | OVGP1, EPOR, PLAU, RPL29 |
| GO:0007286˜spermatid development | 3 | 0.016952 | PAFAH1B1, PRM1, PPP2R2B |
| GO:0048515˜spermatid differentiation | 3 | 0.018774 | PAFAH1B1, PRM1, PPP2R2B |
Table 2-2. KEGG pathway annotations list.
| Term | Count | PValue | Genes |
|---|---|---|---|
| hsa04514:Cell adhesion molecules (CAMs) | 6 | 0.002756 | SELP, CD86, CD34, PECAM1, CD2, CD4 |
| hsa04640:Hematopoietic cell lineage | 5 | 0.003632 | IL4, CD34, CD2, EPOR, CD4 |
Related miRNA and TF search
We searched significantly related TF using The Database for Annotation, Visualization and Integrated Discovery (DAVID) v6.8 and got 4 related TFs: ISRE, AP1FJ, RP58, CREL, see Table 3. In addition, we extracted 4 related miRNAs which targeted genes in co-expression network from miRTarBase (2016 version): bta-miR-181a, bta-miR-17-5p, bta-miR-146b, bta-miR-146a, listed in Supplementary Table 9. We integrated miRNA and their target information into co-expression network to construct miRNA-targeted co-expression network, as shown in Figure 8.
Table 3. Related TF list.
| Category | Term | Count | P Value | Genes |
|---|---|---|---|---|
| UCSC_TFBS | ISRE | 27 | 0.005515 | FGFR2, LALBA, PPARG, PRDX5, CACNB4, PNN, CDKN2B, CCL21, SULT1A1, CD2, PLA2G1B, FAU, PAFAH1B1, CD4, CHRNA1, PPP2R2B, IL4, SELP, MAOA, ACACA, F9, PIGR, RGS16, IFNAR1, GPI, CD86, EPOR |
| UCSC_TFBS | AP1FJ | 19 | 0.008982 | FGFR2, FHL3, ACACA, CACNB4, PTGFR, RPL29, MMP20, CD86, CKM, CDKN2B, CD34, CCL21, GPX4, PECAM1, EPOR, PAFAH1B1, CD4, NGB, PPP2R2B |
| UCSC_TFBS | RP58 | 30 | 0.032744 | FGFR2, LALBA, PPARG, FHL3, DCN, CACNB4, MMP20, CDKN2B, GPX4, PLA2G1B, FAU, PAFAH1B1, CHRNA1, PPP2R2B, FGF2, OPTC, SELP, MAOA, ACACA, F9, PIGR, GUCY2C, RGS16, PTGFR, INHBB, GPI, CD34, PECAM1, NPPC, EPOR |
| UCSC_TFBS | CREL | 12 | 0.044246 | IL4, MMP20, CD34, GPX4, PPARG, FHL3, ACACA, EPOR, CD4, CACNB4, PIGR, FGF2 |
Figure 8. miRNA-targeted co-expression network.
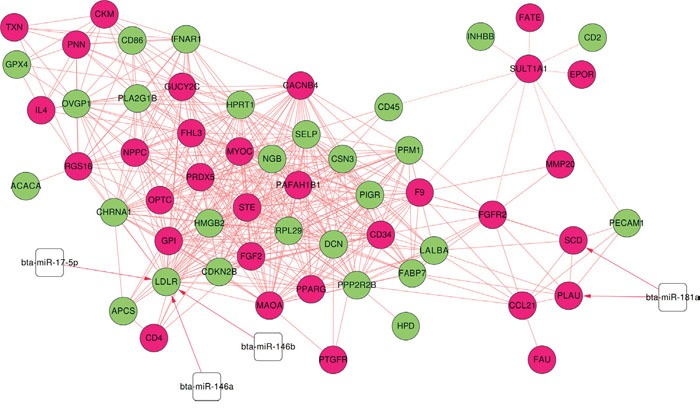
Red and green nodes refer to up and down regulated genes in Bos taurus, white square is miRNAs; dash and solid edge mean negative and positive correlation coefficient, red line with arrow mean miRNAs target genes.
It can be observed that RP58, ISRE and APIFJ are significantly related to 30, 27 and 19 genes respectively including PAFAH1B1 and PPP2R2B. PLAU, a gene responsible for creating suitable environment for embryo implantation and SCD, a gene responsible for fatty acids have a miRNA binding sites for bta-miR-181a. LDLR that has a demonstrated role in sperm storage tubules in hen [16] and its lack of presence in female mouse is associated with low fertility [17]. We have found 3 miRNA binding sites including bta-miR-17-5p, bta-miR-146b, bta-miR-146a associated with LDLR that can prove beneficial target for improving fertility. The expression of LDLR, PLAU and SCD in sperm transcriptome suggests it's crucial role in fertilization and activating energy related pathways.
Association of reproductive genes with immunity and synaptic transmission genes
The reproduction have several predominant biological processes like spermatogenesis, sexual development and pregnancy. The genes associated with these processes are co-expressed with genes associated with immunity in respective modules indicating interesting cross talk among reproductive and immune related genes. The reproductive driver genes PPP2R2B and PRM1 lies in brown module along with important immunity related genes including TREM-1, TNF and TRAF-6, whereas PAFAH1B1 lies in blue module along with immune related genes IL4, IL6 etc. in Bos taurus suggesting a cross talk between reproductive and immune related genes.
It is worth noting that the reproductive driver gene PAFAH1B1 is also associated with synaptic transmission along with other genes including MAOA, CACNB4, CHRNA1, FGF2 suggesting its pivotal role as neuro-transmitter that activates the receptors of another neuron indicating functional role in reproductive endocrinology.
Genetic analysis of vital reproduction genes across Bos taurus and Sus scrofa
We found 6 reproduction related GO annotations (listed in Table 2-1) which involved 10 genes: PPP2R2B, PAFAH1B1, PRM1, HMGB2, OVGP1, GPX4, EPOR, PLAU, RPL29, INHBB. Among the 10 genes, PPP2R2B, PRM1 and PAFAH1B1 participated in 5 reproduction related GO annotations at the same time. Therefore, PPP2R2B, PRM1 and PAFAH1B1 are considered as vital reproduction related genes. We did a series of genetic analysis for the selected three genes: PPP2R2B, PRM1 and PAFAH1B1.
Genetic phylogenetic tree of PPP2R2B, PRM1 and PAFAH1B1 in Bos taurus and Sus scrofa
We downloaded protein sequences of these three genes in Bos taurus and Sus scrofa from NCBI database (Supplementary Table 10), and aligned them with ClustalW in Mega6 (18), and made a phylogenetic tree as shown in Figure 9. It can seen from the phylogenetic tree that genes with the same names in Bos taurus and Sus scrofa have a closer relationship in evolution.
Figure 9. Phylogenetic tree of PPP2R2B, PRM1 and PAFAH1B1 in Bos taurus and Sus scrofa.

Consensus sequences of PPP2R2B, PRM1 and PAFAH1B1 in Bos taurus and Sus scrofa
The calculated order of the most frequent residues that is of nucleotides or amino acids found at each position in sequence alignment is termed as consensus sequence. The related sequences in the multiple alignment are compared to each other and similar sequence motifs are calculated. We aligned downloaded protein sequences with ClustalW in Mega6 and found consensus sequences of PPP2R2B, PRM1 and PAFAH1B1 across Bos taurus and Sus scrofa, results were shown in Figure 10. The genes with the same names in Bos taurus and Sus scrofa have a higher consistency in the sequence.
Figure 10.
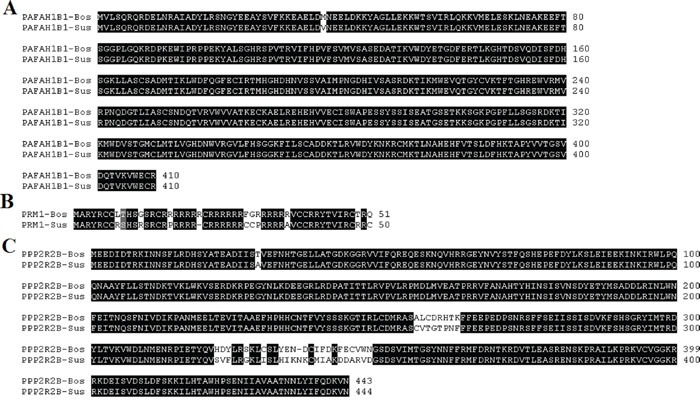
Consensus sequences of PAFAH1B1 (A) PRM1 (B) and PPP2R2B (C) in Bos taurus and Sus scrofa. Sequences with black background are consensus sequences.
Domains in PPP2R2B, PRM1 and PAFAH1B1
In our present integrated transcriptome study of Bos taurus and Sus scrofa we identified PPP2R2B, PAFAH1B1 and PRM1 as candidate genes involved in spermatid differentiation and development. We then searched domains in PPP2R2B, PRM1 and PAFAH1B1 with InterProScan [19] in EBI, and finally got 3, 1 and 2 domains, respectively. Information of each domain was listed in Table 4. The visualization result are shown in Figure 11.
Table 4. Domain information list of PPP2R2B, PRM1 and PAFAH1B1.
| PPP2R2B | ||
| Postion | Domain name | Domain full name |
| 79-93 | PR55_1 | Protein phosphatase 2A regulatory subunit PR55 signature 1 |
| 170-184 | PR55_2 | Protein phosphatase 2A regulatory subunit PR55 signature 2 |
| 187-201 | WD_REPEATS_1 | Trp-Asp (WD) repeats signature |
| PRM1 | ||
| Postion | Domain name | Domain full name |
| 2-13 | PROTAMINE_P1 | Protamine P1 signature |
| PAFAH1B1 | ||
| Postion | Domain name | Domain full name |
| 7-39 | LISH | LIS1 homology (LisH) motif |
| 104-410 | WD_REPEATS_2 | Trp-Asp (WD) repeats |
Figure 11. The visualization result of Domain in PPP2R2B, PRM1 and PAFAH1B1.
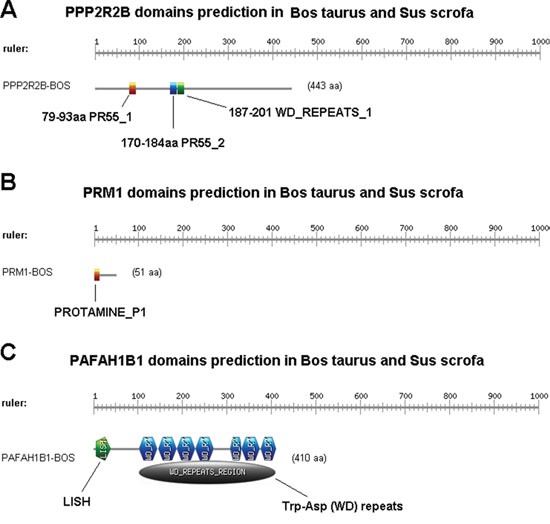
“PR55 a domain in PPP2R2B” has diverse functions including substrate recognition, target an enzyme to correct subcellular localization, have a role in spindle cell assembly and centrosome attachment to nuclei. The expression of PPP2R2B hence indicates its critical role in reproduction especially spermatogenesis. Apart from PR55, WD-REPEATS domain is also present in PPP2R2B. PRM1 contains PROTAMINE domain which plays important roles sperm chromatin is substituted for histones during haploid spermatogenic phase. The sperm DNA is packed into a highly condensed, stable and inactive complex by protamines hence maintaining sperm resistant to lethal mutations. LISH and WD-REPEATS domains correspond to PAFAH1B1. In present study we found PAFAH1B1 as an important phosphatase for sperm motility and its fertilizing capability hence regarded as critical factor in male fertility. The 33-residue LIS1 homology (LisH) motif is found in eukaryotic intracellular proteins that is involved in microtubule dynamics, cell migration, nucleokinesis and most importantly in chromosome segregation when we look for its function in reproduction.
Epigenetic predictions for PPP2R2B, PRM1 and PAFAH1B1 in Bos taurus and Sus scrofa
Cytosines in CpG dinucleotides can be methylated to form 5-methylcytosine. In mammals, a methylating cytosine within a gene can change its expression pattern, hence regulating gene epigenetically. We searched CpG islands of PPP2R2B, PRM1 and PAFAH1B1 in Bos taurus and Sus scrofa. In our prediction, we used Methprimer [20] to identify CpG islands. CpG islands are defined as sequence ranges where the Obs/Exp value is greater than 0.6 and the GC content is greater than 60%. We found no CpG islands in PRM1. The results of PPP2R2B and PAFAH1B1 are shown in Figure 12.
Figure 12. CpG islands in PPP2R2B and PAFAH1B1 in Bos taurus and Sus scrofa.

Mutations in PPP2R2B, PRM1 and PAFAH1B1
We searched SNPs in PPP2R2B, PRM1 and PAFAH1B1 from dbSNP, shown in Table 5. In addition, we also searched CNVs of each gene from Database of Genomic Variants (DGV), listed in Table 6. A total of five SNPs were found in PPP2R2B including one missense rs11547494, while PAFAH1B1 was found to have three SNPs rs12143448254, rs12143448454, rs12143448654, all of which are missense from dbSNP database. There was no SNP found in PRM1 in dbSNP database.
Table 5. Sequence variations from dbSNP.
| PPP2R2B | |||
| SNP ID | Chr 05 pos | Sequence Context | Type |
| rs11547494 | 146,701,106(-) | CACGG(G/T)AGAAT | nc-transcript-variant, reference, missense |
| rs160967 | 146,803,933(+) | gaggc(C/T)gaggc | intron-variant |
| rs160968 | 146,829,614(+) | TGGCC(C/T)ATTTC | intron-variant |
| rs160969 | 146,837,254(-) | atcat(C/G/T)tcatg | intron-variant |
| rs160970 | 146,836,216(-) | AAAAC(A/G)TAACC | intron-variant |
| PAFAH1B1 | |||
| SNP ID | Chr 17 pos | Sequence Context | Type |
| rs121434482 5 4 | 2,670,209(+) | AGGAC(A/G)TACAG | reference, missense |
| rs121434484 5 4 | 2,670,268(+) | CCTGT(C/T)CTGCA | reference, missense |
| rs121434486 5 4 | 2,665,431(+) | AGTTT(C/T)TAAAA | reference, missense |
Table 6. Structural variations from Database of Genomic Variants (DGV).
| PPP2R2B | |||
| Variant ID | Type | Subtype | PubMed ID |
| dgv1656e212 | CNV | Loss | 25503493 |
| dgv356n21 | CNV | Loss | 19592680 |
| esv1159529 | CNV | Insertion | 17803354 |
| esv2053966 | CNV | Deletion | 18987734 |
| esv2422173 | CNV | Deletion | 20811451 |
| esv2659662 | CNV | Deletion | 23128226 |
| esv2660911 | CNV | Deletion | 23128226 |
| esv2664858 | CNV | Deletion | 23128226 |
| esv26695 | CNV | Loss | 19812545 |
| esv2670593 | CNV | Deletion | 23128226 |
| esv2672689 | CNV | Deletion | 23128226 |
| esv2675913 | CNV | Deletion | 23128226 |
| esv2730881 | CNV | Deletion | 23290073 |
| esv2730882 | CNV | Deletion | 23290073 |
| esv2730883 | CNV | Deletion | 23290073 |
| esv2759385 | CNV | Loss | 17122850 |
| esv2763505 | CNV | Loss | 21179565 |
| esv3304864 | CNV | mobile element insertion | 20981092 |
| esv3306710 | CNV | mobile element insertion | 20981092 |
| esv3310476 | CNV | novel sequence insertion | 20981092 |
| esv3324641 | CNV | Insertion | 20981092 |
| esv3394455 | CNV | Insertion | 20981092 |
| esv3427676 | CNV | Duplication | 20981092 |
| esv3429928 | CNV | Insertion | 20981092 |
| esv3444421 | CNV | Insertion | 20981092 |
| esv3570481 | CNV | Loss | 25503493 |
| esv3570482 | CNV | Loss | 25503493 |
| esv3570485 | CNV | Loss | 25503493 |
| esv3607080 | CNV | Loss | 21293372 |
| esv3607081 | CNV | Loss | 21293372 |
| esv3607083 | CNV | Loss | 21293372 |
| esv3607084 | CNV | Loss | 21293372 |
| esv3607085 | CNV | Loss | 21293372 |
| esv3607086 | CNV | Loss | 21293372 |
| esv988317 | CNV | Insertion | 20482838 |
| nsv1117590 | CNV | Deletion | 24896259 |
| nsv1145843 | CNV | Deletion | 26484159 |
| nsv327242 | CNV | Insertion | 16902084 |
| nsv328338 | CNV | Deletion | 16902084 |
| nsv499741 | CNV | Loss | 21111241 |
| nsv5052 | CNV | Insertion | 18451855 |
| nsv5053 | CNV | Deletion | 18451855 |
| nsv514327 | CNV | Loss | 21397061 |
| nsv519847 | CNV | gain+loss | 19592680 |
| nsv528827 | CNV | Loss | 19592680 |
| nsv599938 | CNV | Gain | 21841781 |
| nsv823286 | CNV | Loss | 20364138 |
| nsv969003 | CNV | Duplication | 23825009 |
| PRM1 | |||
| Variant ID | Type | Subtype | PubMed ID |
| nsv1040428 | CNV | Gain | 25217958 |
| nsv571453 | CNV | Loss | 21841781 |
| PAFAH1B1 | |||
| Variant ID | Type | Subtype | PubMed ID |
| esv2660206 | CNV | Deletion | 23128226 |
| esv2664869 | CNV | Deletion | 23128226 |
| esv2715502 | CNV | Deletion | 23290073 |
| esv2715503 | CNV | Deletion | 23290073 |
| esv275250 | CNV | gain+loss | 21479260 |
| esv3572343 | CNV | Gain | 25503493 |
| esv3582486 | CNV | Loss | 25503493 |
| esv3639714 | CNV | Loss | 21293372 |
| esv3639715 | CNV | Loss | 21293372 |
| nsv1055844 | CNV | Gain | 25217958 |
| nsv1065489 | CNV | Gain | 25217958 |
| nsv1070794 | CNV | Deletion | 25765185 |
| nsv1123087 | CNV | Deletion | 24896259 |
| nsv516756 | CNV | Gain | 19592680 |
| nsv833339 | CNV | Loss | 17160897 |
| nsv954919 | CNV | Deletion | 24416366 |
Protein docking analysis of vital reproduction genes
Protein structures of PAFAH1B1 (PDB ID: 3DT6), PPP2R2B (PDB ID: 4MEW) and PRM1 (PDB ID: 4Y0Q) were downloaded from PDB and docked against MPD3 database ready to dock library using MOE docking tool. Ten conformations were provided by MOE for each ligand. These conformations were arranged according to S score. From 2500 MPD3 database ligands, only top seven individual conformations for every ligand which showed minimum S score and RMSD value were chosen. Along with minimum S score, these selected ligands also showed strong binding with targeted proteins. Among the strongly bonded selected ligands Tannic Acid, 5,6,7,4'-Tetrahydroxyflavanone 6,7-diglucoside, Oolonghomobisflavan-A showed most favorable results with PAFAH1B, PPP2R2B, and PRM1 respectively. The detailed results of docking including information about interacting residues are shown in Table 7 along with interacting residue figures in Figure 13 where 1A, 1B, 1C are showing protein-ligand complexes (ligand is in magenta color), 2A, 2B, 2C showing 2D docked interactions of ligand-protein and 3A, 3B, 3C are showing binding pocket mode of proteins.
Table 7. Docking results of vital reproductive genes.
| MPD3 ID | Ligands | S-Score | RMSD Value | Interacting Residues |
|---|---|---|---|---|
| PAFAH1B1 | ||||
| 2068 | Tannic Acid | -21.31 | 3.61 | Ser76, Leu194, Asn104, His79, Arg141, His106, Gln78, Thr12, Pro13, Gln15, Gln50, Gly73, Val17, Asp20, Arg22, Asp16, Trp23, Met24, Gly21, Leu26 |
| PPP2R2B | ||||
| 778 | 5,6,7,4'- Tetrahydroxyflavanone 6,7-diglucoside | -18.41 | 2.10 | Asp213, Cys174, Gly173, Pro175, Glu299, Glu300, Lys170, Lys147, Asp137, Val139 |
| PRM1 | ||||
| 536 | Oolonghomobisflavan A | -26.58 | 2.42 | Leu46, Leu54, Ile56, Ile84, Val92, Met107, Glu108, Lys91, Pro38, Leu39, Leu87, Asn90, Phe105, Ile71, Gln120, Leu58, Val41, Lys60, Lys69, Tyr42, Leu122 |
Figure 13.
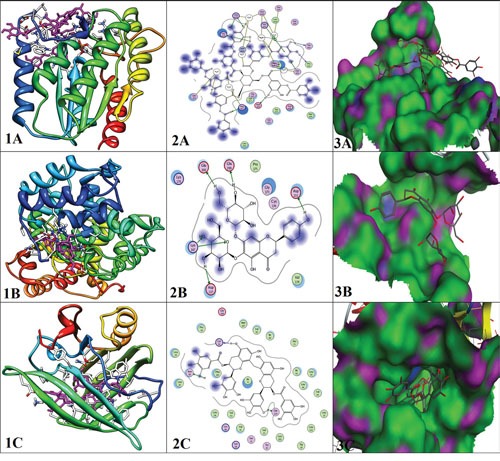
Interaction analys is of docked proteins; (A) (1, 2, 3) PAFAH1B1, (B) (1, 2, 3) PPP2R2B, (C) (1, 2, 3) PRM1.
DISCUSSION
The advances in a recent day molecular biology provides ample information suggesting that phenotypes are actually a result of several genes that works in a network. Reproduction is a complex biological process that involves a number of genes and pathways to work together in a coherent way to bring out the desired phenotypes or germ cells capable of fertilization. WGCNA has been widely used to find out candidate or signature genes for disease condition [21]. We have used this state of the art analysis tool to find out reproductive driver genes across Bos taurus and Sus scrofa. Such an analysis has a wide application in animal reproductive biology where one can target specific set of genes as per own desire to generate desired phenotypes for higher reproductive performance, fertility or sex ratio control.
The gene enrichment in co-expression network of genes in present study demonstrates 66 different biological processes including genes related to immunity indicating its connected role in reproduction. It is worth noting that the immunity genes co-express with reproductive genes provide a safe microenvironment for the sperm to develop as well as to fertilize oocyte in germ free environment. Another probable role of those genes could be assumed as generating a suitable environment in female reproductive tract to select specific X or Y bearing spermatozoa [22]. Such genes can be exploited in favor of female or male sex ratio control.
There are mechanisms that favor the X chromosome bearing spermatozoa to fertilize oocyte. One such mechanism is that at time of spermiogenesis, the tail formation of sperm where certain gene expression benefits X bearing spermatozoa can make the female ratio higher than expected 1:1 [5, 23]. In present study PAFAH1B1, PPP2R2B and PRM1 is involved with spermatid development, where PAFAH1B1 have a role with spermiogenesis and sperm maturation. At this stage PAFAH1B1 is responsible for tail formation where it can differentially benefit X bearing spermatozoa to develop tail that can increase the ratio of female from normal 1:1.
It is proposed in Mendel's first law that an XY cross will produce a 1:1 male to female ratio in sexually reproducing organisms as evolutionary forces favor parents that spend equal amount of resources on both sexes and an imbalance in this ratio will immediately counter balance the effect in favor of under-presented sex [24]. It has been observed in a population of metazoans that it transmits its sex chromosomes unequally that cause broods to produce highly skewed sex ratio and was termed as a result of asymmetric spermatocyte division [23]. There are three possible ways for distorted sex ratio in genetic terms 1) non random sex chromosome segregation at meiotic division [25] 2) post meiotic differences in haploid gametes causes sperm specific function differences in response to sex chromosomes [26] or 3) sex specific embryonic lethality caused by post zygotic mechanisms [27]. Recently two spermatogenesis based modifications to the cellular program are reported in nematode Rhabditis sp. sB347 that sire >5% male progeny. Firstly the meiosis is modified where sister chromatids of unpaired X chromosome separate prematurely at meiosis 1 stage, and secondly during anaphase II of meiosis II, cellular components that are essential for sperm motility are partitioned exclusively to X-bearing sperm [23]. In present study, we found that the PRM1, PPP2R2B and PAFAH1B1 are associated with spermatogenesis specially the LiSH domain containing protein PAFAH1B1 have role in chromosome segregation and can be used as target for sex ratio increase in favor of female. More interestingly several genes that are associated with motility are co-expressed with reproductive driver genes suggesting its combined role in producing healthy sperm capable of fertilization; and those genes can be made exclusively partitioned proteins responsible for motility to X bearing spermatozoa in controlled breeding programs. Furthermore, specific alterations in gene expression can partition the components of essential sperm motility exclusively to X or Y chromosome hence change normal sex ratio.
Sperm needs to undergo many post meiotic changes of the spermatogenic process before it starts its journey into the reproductive tract of female. The haploid spermatid undergo striking morphological changes including restructuring and compaction of its chromatin material. This makes the almost complete substitution of histone based nucleosomal and histone based structure with protamine based structure. Protamine protects the paternal genetic material and remains key factor in male fertility [28]. In our present study PRM1 is differentially expressed and is present in reproductive module and hence is an important reproductive driver gene. The consequence of mutations in protamine based chromatin can result in infertility in mammals, in our results, the dbSNP search shows no SNP records in PRM1, although we found two structural variations from Database of Genomic Variants (DGV) showing mutations in PRM1 gene is highly protected to safeguard paternal genetic material.
To further elucidate the important roles of PRM1, PPP2R2B, PAFAH1B1 we made genetic analysis of these genes. We made a phylogenetic tree, predicted important domains, carried out epigenetic analysis and mutation analysis. Furthermore, to regulate the expression of these gene we performed protein docking so that we can recommend chemicals or food items that are beneficial or harmful for reproduction.
MATERIALS AND METHODS
The Holstein sperm was separated by flow cytometry and after achieving purity of 95% and stored at -80 C. Then we extracted RNA according to manual performed RNA quality testing and then make the microarray geneChip.
Data and method
Data collection and pre-processing
The hybridized microarrays results in images that were used to generate datasets which were pre processed to get meaningful data sets for further analysis. A particular type of preprocessing is termed as normalization that accounts for systematic difference across different datasets. To identify reproductive driver genes, two datasets were included in present study: 1) X and Y chromosome Affimetrix transcriptome data of Bos taurus generated in our lab (only one sample for each chromosome). 2) NCBI raw transcriptome data of Sus scrofa with accession number of GSE47139 [22] was downloaded from GEO website for analysis (a total of eight samples in GSE47139, 4 X and 4 Y chromosome Affimetrix transcriptomes of Sus scrofa.). Both datasets were pre-processed by using R-language Affy package [29], including background correction and normalized simultaneously. The data sets are all normalized by using Limma package in R language.
Consensus modules identification of Bos taurus and Sus scrofa
We constructed co-expression network and mined reproductive related modules in Bos taurus and Sus scrofa respectively, based on weighed gene co-expression network analysis (WGCNA) algorithm, which is a typical system biology algorithm for constructing gene co-expression network [30]. We extracted overlapped genes in Bos taurus and Sus scrofa for WGCNA, the network building and module identification process steps in Bos taurus transcriptome were as follows:
Definition of gene expression correlation matrix
Correlation coefficient of gene m and gene n was defined as:
Smn=|cor(m,n)|, We calculated expression correlation coefficient of every two genes to make a whole correlation coefficient matrix.
Definition of adjacency function
WGCNA used power index adjacency function as measurement of correlated indicators, the function was defined as:
amn, where, amn=power(Smn,β), then determined weighted factor β, we choose β above 0.9 as a power cutoff.
Node dissimilarity measurement
The adjacency matrix amn was transformed into a topological matrix Ω=wmn, where
lmn referred to adjacency coefficients sum of all connected nodes, km represented connection sum of gene m, dissimilarity of genes was defined as dmn, dmn = 1 - wmn.
Module identification
We constructed hierarchical clustering tree based on dmn defined before, tree branches represented different gene modules.
Screening consensus modules in Sus scrofa
We also identified reproductive related modules in Sus scrofa based on WGCNA with same processes and cutoffs as in Bos taurus described above. Then we calculated overlapped genes of each consensus modules in Bos taurus and Sus scrofa, the selected overlapped genes in consensus modules were used for further analysis.
Gene significance analysis
Filtered expression data of Bos taurus were analyzed with the test method in Limma package [31], implemented in R language, Bioconductor project. Meanwhile, fold change between groups were also calculated, because each sample may show intrinsic individual variability, the threshold for determining the fold change (FC) was set at 1.5. Significantly differentially expressed genes (DEG) were defined with the cutoff of p value <0.05 and |log2FC|>0.585. Then we selected shared genes by comparing DEGs and selected overlapped genes in consensus modules. The shared genes were used for further analyses.
Construction of co-expression network of shared genes
We calculated gene expression correlation coefficient of every two selected shared genes, and kept gene pairs with correlation coefficient higher than 0.8 to construct gene co-expression network. Network was visualized by Cytoscape 2.8.0 software [32].
Functional and KEGG pathway analysis of the network genes
To further analyze the functions of network genes, we enriched genes in the co-expression network to Gene Ontology (GO) and Kyoto Encyclopedia of Genes and Genomes (KEGG) pathways by using clusterProfiler [33] with a cutoff of p lower than 0.05.
Related miRNA and TF search
We searched significantly related TF by using The Database for Annotation, Visualization and Integrated Discovery (DAVID) v6.8 [34], and extracted related miRNAs of genes in co-expression network from miRTarBase (2016 version) [35]. Then constructed TF/miRNA -targeted co-expression network by integrating miRNA/TF and co-expression information.
Genetic analysis of vital reproduction genes across Bos taurus and Sus scrofa
Phylogenetic tree was made using Mega 6 after aligning the downloaded sequences in ClustalW.We searchedwith InterProScan [19] in EBI, we identify CpG islands using Methprimer [20], and finally searched SNPs and CNVs from dbSNP and DGV respectively.
Protein docking analysis of vital reproduction genes
Molecular docking analysis were performed using MOE (Molecular Operating Environment) software [36]. Protein structures of vitally important genes were downloaded from PDB (Protein Data Bank) [37] and optimized by minimizing their energies with parameters (Force Field: AMBER99, Gradient: 0.05). The minimized structures were used as the receptor protein for docking. MOE site finder tool was used to find out the active site where ligands can bind. To select a suitable ligand, selected proteins were docked against ready-to-dock library of MPD3 database [38] contacting 2500 potential compounds in 3D ready to dock format. MOE docking program with parameters (Rescoring function: London dG, Placement: Triangle matcher, Retain: 10, Refinement: Force field, Rescoring 2: London dG) was used to bind the selected ligands with proteins.
SUPPLEMENTARY MATERIALS FIGURES AND TABLES
Acknowledgments
The authors extend sincere thanks to laboratory colleagues for their beneficial suggestions.
Abbreviations
- DEGs
Differentially expressed genes
- KEGG
Kyoto Encyclopedia of Genes and Genomes
- BP
biological process
- GO
Gene Ontology
- WGCNA
Weighted Gene Co-Expression Network Analysis
- PDB
Protein Data Bank
- MOE
Molecular Operating Environment
- TF
Trancription Factor
Author contributions
F.A.K. and S.Z. conceived and designed the experiments; F.A.K performed experiments bioinformatics data analysis; H.L. develop the microarray data of Bos taurus. F.A.K and N.S.P. wrote the paper; M.T.Q. performed protein docking analysis and F.A.K., N.S.P., H.Z., K.W. and S.Z. revised the paper, and all the authors approved the final version.
CONFLICTS OF INTEREST
The authors declare that there is no potential conflicts of interest.
FUNDING
The authors are grateful for financial assistance from the project (The research platform construction of the ministry of agriculture international exchange and cooperation in science and technology) and EUFP7 projects (PIIFR-GA-2012-912205 and FP7-KBBE-2013-7-613689). The authors are grateful to all the laboratory colleagues constructive discussions.
REFERENCES
- 1.Graves JAM, Ferguson-Smith MA, McLaren A, Mittwoch U, Renfree MB, Burgoyne P. The evolution of mammalian sex chromosomes and the origin of sex determining genes [and Discussion] Philosophical Transactions of the Royal Society of London B: Biological Sciences. 1995;350:305–312. doi: 10.1098/rstb.1995.0166. [DOI] [PubMed] [Google Scholar]
- 2.Graves JAM. Evolution of the mammalian Y chromosome and sex-determining genes. The Journal of experimental zoology. 1998;281:472–481. [PubMed] [Google Scholar]
- 3.Graves JAM. Sex chromosome specialization and degeneration in mammals. Cell. 2006;124:901–914. doi: 10.1016/j.cell.2006.02.024. [DOI] [PubMed] [Google Scholar]
- 4.Vallender EJ, Lahn BT. How mammalian sex chromosomes acquired their peculiar gene content. Bioessays. 2004;26:159–169. doi: 10.1002/bies.10393. [DOI] [PubMed] [Google Scholar]
- 5.Wu JC, Go AC, Samson M, Cintra T, Mirsoian S, Wu TF, Jow MM, Routman EJ, Chu DS. Sperm development and motility are regulated by PP1 phosphatases in Caenorhabditis elegans. Genetics. 2012;190:143–157. doi: 10.1534/genetics.111.135376. [DOI] [PMC free article] [PubMed] [Google Scholar]
- 6.Sassone-Corsi P. Unique chromatin remodeling and transcriptional regulation in spermatogenesis. Science. 2002;296:2176–2178. doi: 10.1126/science.1070963. [DOI] [PubMed] [Google Scholar]
- 7.Tanaka H, Baba T. Gene expression in spermiogenesis. Cell. Mol. Life Sci. 2005;62:344–354. doi: 10.1007/s00018-004-4394-y. [DOI] [PMC free article] [PubMed] [Google Scholar]
- 8.Miller D, Ostermeier GC. Towards a better understanding of RNA carriage by ejaculate spermatozoa. Hum. Reprod. Update. 2006;12:757–767. doi: 10.1093/humupd/dml037. [DOI] [PubMed] [Google Scholar]
- 9.Varmuza S, Jurisicova A, Okano K, Hudson J, Boekelheide K, Shipp EB. Spermiogenesis is impaired in mice bearing a targeted mutation in the protein phosphatase 1cγ gene. Developmental biology. 1999;205:98–110. doi: 10.1006/dbio.1998.9100. [DOI] [PubMed] [Google Scholar]
- 10.Chu DS, Liu H, Nix P, Wu TF, Ralston EJ, Yates III, JR, Meyer BJ. Sperm chromatin proteomics identifies evolutionarily conserved fertility factors. Nature. 2006;443:101–105. doi: 10.1038/nature05050. [DOI] [PMC free article] [PubMed] [Google Scholar]
- 11.Hilscher B. Spermatogoniogenesis, an interacting proliferation process between stem cell spermatogonia and differentiating spermatogonia. Fortschritte der Andrologie. 1981;7:46–57. [Google Scholar]
- 12.Grootegoed JA, Jansen R, Van Der Molen HJ. The role of glucose, pyruvate and lactate in ATP production by rat spermatocytes and spermatids. Biochimica et Biophysica Acta (BBA)-Bioenergetics. 1984;767:248–256. doi: 10.1016/0005-2728(84)90194-4. [DOI] [PubMed] [Google Scholar]
- 13.Chocu S, Calvel P, Rolland AD, Pineau C. Spermatogenesis in mammals: proteomic insights. Syst. Biol. Reprod. Med. 2012;58:179–190. doi: 10.3109/19396368.2012.691943. [DOI] [PubMed] [Google Scholar]
- 14.Oakberg EF. Duration of spermatogenesis in the mouse and timing of stages of the cycle of the seminiferous epithelium. Am J Anat. 1956;99:507–516. doi: 10.1002/aja.1000990307. [DOI] [PubMed] [Google Scholar]
- 15.Schenk JL, Cran DG, Everett RW, Seidel GE. Pregnancy rates in heifers and cows with cryopreserved sexed sperm: Effects of sperm numbers per inseminate, sorting pressure and sperm storage before sorting. Theriogenology. 2009;71:717–728. doi: 10.1016/j.theriogenology.2008.08.016. [DOI] [PubMed] [Google Scholar]
- 16.Huang A, Isobe N, Obitsu T, Yoshimura Y. Expression of lipases and lipid receptors in sperm storage tubules and possible role of fatty acids in sperm survival in the hen oviduct. Theriogenology. 2016;85:1334–1342. doi: 10.1016/j.theriogenology.2015.12.020. [DOI] [PubMed] [Google Scholar]
- 17.Guo T, Zhang L, Cheng D, Liu T, An L, Li WP, Zhang C. Low-density lipoprotein receptor affects the fertility of female mice. Reproduction, Fertility and Development. 2015;27:1222–1232. doi: 10.1071/RD13436. [DOI] [PubMed] [Google Scholar]
- 18.Tamura K, Stecher G, Peterson D, Filipski A, Kumar S. MEGA6: Molecular Evolutionary Genetics Analysis version 6.0. Mol Biol Evol. 2013;12:2725–9. doi: 10.1093/molbev/mst197. [DOI] [PMC free article] [PubMed] [Google Scholar]
- 19.Quevillon E, Silventoinen V, Pillai S, Harte N, Mulder N, Apweiler R, Lopez R. InterProScan: protein domains identifier. Nucleic Acids Res. 2005;33:W116–20. doi: 10.1093/nar/gki442. [DOI] [PMC free article] [PubMed] [Google Scholar]
- 20.Li LC, Dahiya R. MethPrimer: designing primers for methylation PCRs. Bioinformatics. 2002;18:1427–31. doi: 10.1093/bioinformatics/18.11.1427. [DOI] [PubMed] [Google Scholar]
- 21.Sundarrajan S, Arumugam M. Comorbidities of Psoriasis-Exploring the Links by Network Approach. PloS one. 2016;11:e0149175. doi: 10.1371/journal.pone.0149175. [DOI] [PMC free article] [PubMed] [Google Scholar]
- 22.Almiñana C, Caballero I, Heath PR, Maleki-Dizaji S, Parrilla I, Cuello C, Gil MA, Vazquez JL, Vazquez JM, Roca J, Martinez EA, Holt WV, Fazeli A. The battle of the sexes starts in the oviduct: modulation of oviductal transcriptome by X and Y-bearing spermatozoa. BMC Genomics. 2014;15:293. doi: 10.1186/1471-2164-15-293. [DOI] [PMC free article] [PubMed] [Google Scholar]
- 23.Shakes DC, Neva BJ, Huynh H, Chaudhuri J, Pires-daSilva A. Asymmetric spermatocyte division as a mechanism for controlling sex ratios. Nature communications. 2011;2:157. doi: 10.1038/ncomms1160. [DOI] [PMC free article] [PubMed] [Google Scholar]
- 24.Robert T. Parental investment and sexual selection. Sexual Selection & the Descent of Man, Aldine de Gruyter. 1972. pp. 136–179.
- 25.Kubai DF. Meiosis in Sciara coprophila: structure of the spindle and chromosome behavior during the first meiotic division. J. Cell Biol. 1982;93:655–669. doi: 10.1083/jcb.93.3.655. [DOI] [PMC free article] [PubMed] [Google Scholar]
- 26.Cazemajor M, Joly D, Montchamp-Moreau C. Sex-ratio meiotic drive in Drosophila simulans is related to equational nondisjunction of the Y chromosome. Genetics. 2000;154:229–236. doi: 10.1093/genetics/154.1.229. [DOI] [PMC free article] [PubMed] [Google Scholar]
- 27.Orr HA. Haldane's rule. Annu. Rev. Ecol. Syst. 1997;28:195–218. [Google Scholar]
- 28.Gunes S, Al-Sadaan M, Spermatogenesis Agarwal A. DNA damage and DNA repair mechanisms in male infertility. Reproductive biomedicine online. 2015;31:309–319. doi: 10.1016/j.rbmo.2015.06.010. [DOI] [PubMed] [Google Scholar]
- 29.Liu WM, Mei R, TB Di X Ryder, Hubbell E, Dee S, Webster TA, Harrington CA, Ho MH, Baid J, Smeekens SP. Analysis of high density expression microarrays with signed-rank call algorithms. Bioinformatics. 2002;18:1593–1599. doi: 10.1093/bioinformatics/18.12.1593. [DOI] [PubMed] [Google Scholar]
- 30.Langfelder P, Horvath S. WGCNA: an R package for weighted correlation network analysis. BMC Bioinformatics. 2008;9:559. doi: 10.1186/1471-2105-9-559. [DOI] [PMC free article] [PubMed] [Google Scholar]
- 31.Smyth G. Gentleman VCR, Dudoit S, Irizarry R, Huber W, editors. Limma: linear models for microarray data In ‘Bioinformatics and Computational Biology Solutions using R and Bioconductor’. 2005. pp. 397–420.
- 32.Smoot ME, Ono K, Ruscheinski J, Wang PL, Ideker T. Cytoscape 2.8: new features for data integration and network visualization. Bioinformatics. 2011;27:431–2. doi: 10.1093/bioinformatics/btq675. [DOI] [PMC free article] [PubMed] [Google Scholar]
- 33.Yu G, Wang LG, Han Y, He QY. ClusterProfiler: an R package for comparing biological themes among gene clusters. OMICS. 2012;16:284–7. doi: 10.1089/omi.2011.0118. [DOI] [PMC free article] [PubMed] [Google Scholar]
- 34.Huang DW, Sherman BT, Lempicki RA. Systematic and integrative analysis of large gene lists using DAVID Bioinformatics Resources. Nature Protoc. 2009;4:44–57. doi: 10.1038/nprot.2008.211. [DOI] [PubMed] [Google Scholar]
- 35.Chou CH, Chang NW, Shrestha S, Hsu SD, Lin YL, Lee WH, Yang CD, Hong HC, Wei TY, Tu SJ, Tsai TR, Ho SY, Jian TY, et al. miRTarBase 2016: updates to the experimentally validated miRNA-target interactions database. Nucleic Acids Res. 2016;44:D239–47. doi: 10.1093/nar/gkv1258. [DOI] [PMC free article] [PubMed] [Google Scholar]
- 36.Vilar S, Cozza G, Moro S. Medicinal chemistry and the molecular operating environment (MOE): Application of QSAR and molecular docking to drug discovery. Curr Top Med Chem. 2008;8:1555–1572. doi: 10.2174/156802608786786624. [DOI] [PubMed] [Google Scholar]
- 37.Bernstein FC, Koetzle TF, Williams GJ, Meyer EF, Brice MD, Rodgers JR, Kennard O, Shimanouchi T, Tasumi M. The protein data bank. European Journal of Biochemistry. 1977;80:319–324. doi: 10.1111/j.1432-1033.1977.tb11885.x. [DOI] [PubMed] [Google Scholar]
- 38.Mumtaz A, Ashfaq UA, ul Qamar MT, Anwar F, Gulzar F, Ali MA, Saari N, Pervez MT. MPD3: a useful medicinal plants database for drug designing. Natural Product Research. 2016. pp. 1–9. [DOI] [PubMed]
Associated Data
This section collects any data citations, data availability statements, or supplementary materials included in this article.


