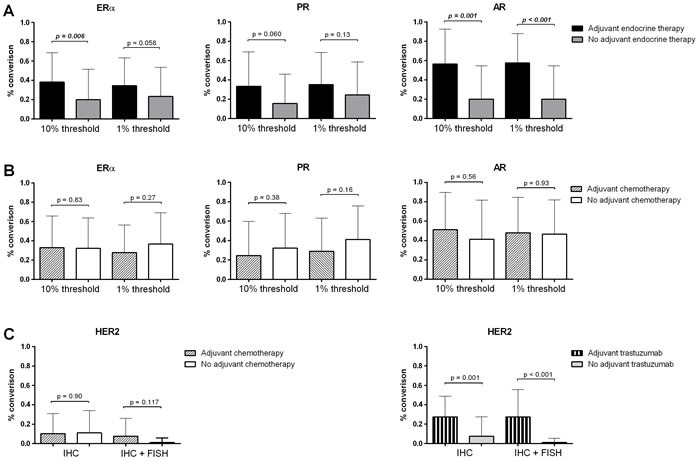
Figure 3. Conversion percentages for ERα, PR, AR and HER2 compared to adjuvant therapy history.

a. Conversion percentages for ERα, PR and AR of patients that did and did not receive adjuvant endocrine therapy. Data for the 1% and 10% thresholds for positivity are shown. b. Conversion percentages for ERα, PR and AR of patients that did and did not receive adjuvant chemotherapy. Data for the 1% and 10% thresholds for positivity are shown. c. Conversion percentages for HER2 of patients that did and did not receive adjuvant chemo- or trastuzumab therapy. Data for the for IHC only and IHC in combination with FISH are shown.
