Abstract
Understanding nanoparticles’ formation process is of utmost importance to improve their design and production. This especially holds true for self-assembled nanoparticles whose formation processes has been largely overlooked. Here we present a new technology that integrates a microfluidic-based nanoparticle synthesis method and Förster resonance energy transfer (FRET) microscopy imaging to visualize nanoparticle self-assembly in real time. Applied to different nanoparticle systems, i.e., nanoemulsions, drug-loaded block-copolymer micelles, and nanocrystal-core reconstituted high-density lipoproteins, we have shown the approach’s unique ability to investigate key parameters affecting nanoparticle formation.
Keywords: block-copolymer, nanoemulsion, microfluidics, FRET, HDL
Entry for the Table of Contents
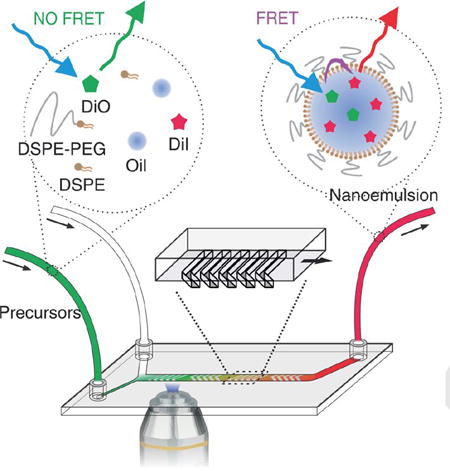
We have developed a new technology that combines microfluidic-based nanoparticle synthesis and Förster resonance energy transfer (FRET) microscopy imaging to visualize na-noparticle self-assembly in real time.
Self-assembled nanoparticles (SANP), including lipid-based nanoparticles, nanoemulsions, and polymeric nanoparticles, have been studied for a wide range of biomedical applications.[1] Particularly, the use of SANPs for imaging and drug delivery has yielded numerous modalities for improved disease diagnosis and treatment.[2] SANP formation through self-assembly is a bottom-up process in which the molecular components associate and self-organize into well-defined nanoparticles under controllable conditions.[3] In the last few decades, numerous examples of SANPs with different functions and different formulation methods have been developed. Conventionally, the evaluation of SANP formation is based on the characteristics of the final product, but real-time feedback of the self-assembly process itself is highly desired. An improved understanding of this formation process facilitates improving nanomaterial design and preparation methods.
Recently developed microfluidic technologies allow SANP formulation in a well-controlled, reproducible and high-throughput manner.[4] Additionally, microfluidic-based nanoparticle self-assembly provides an excellent platform to study SANP formation, in which a time-dependent process is transformed into a spatial distribution that facilitates imaging and analysis. Previously, we have reported the use of FRET as a sensitive and semi-quantitative tool to probe or image SANPs’ dissociation kinetics both in vitro[5] and in vivo.[6] Similarly, FRET can also be applied to investigate nanoparticle formation.
Here, we have developed a new platform that combines FRET microscopy and microfluidics, enabling visualizing the SANP formation process in real-time. In our design, SANPs were formed in the microfluidic device through continuous flow. Simultaneously, FRET microscopy imaging was applied to the device. To validate this concept and test its general applicability, we investigated the formation of three widely used SANP platforms, i.e., nanoemulsions,[7] polymeric micelles[6b, 8] and reconstituted high-density lipoprotein (HDL),[9] at a variety of synthetic conditions and material compositions (see TEM images in Supporting Information, SI, Figure S1). Moreover, for each system we also introduced different donor-acceptor FRET pairs and investigated several parameters affecting SANP synthesis.
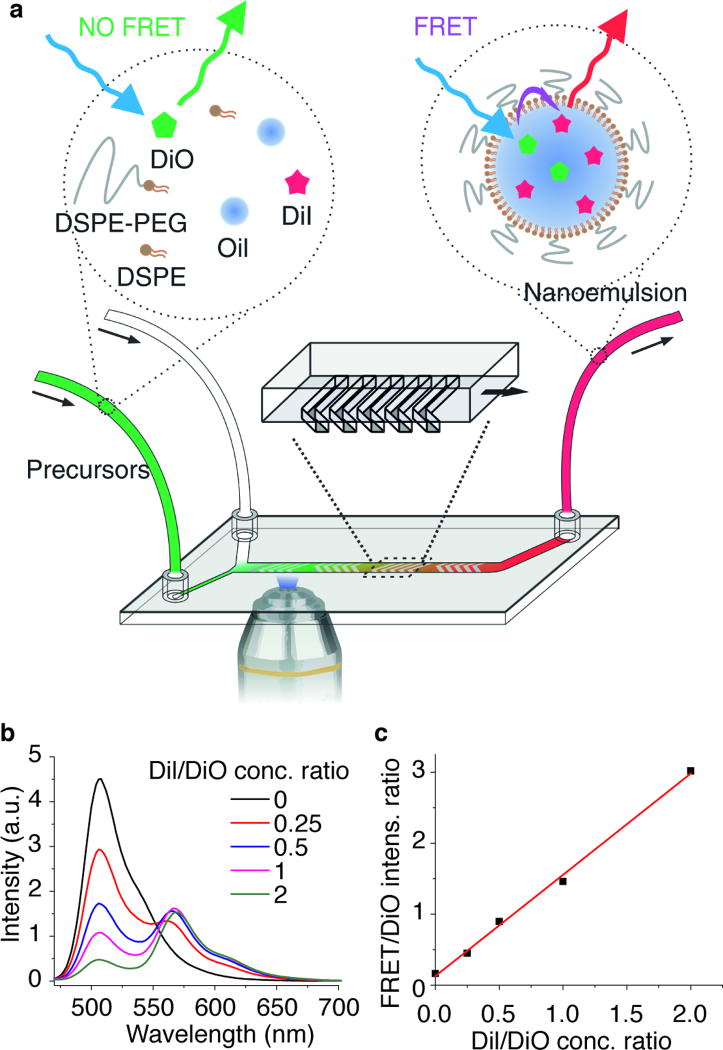
We first investigated the formation of nanoemulsions. Typically, they are formed through top-down approaches such as high energy input ultrasonication,[10] high-pressure homogenization,[11] or low energy input methods involving phase inversions.[12] Here, we show that nanoemulsions can also be synthesized through a self-assembly bottom-up approach,[4d] and in this method, the occurrence of FRET can indicate the instant formation of the nanoemulsion. Specifically, an ethanol solution containing oils and a mixture of phospholipids and cholesterol is mixed with an aqueous solution (at a volume ratio of 1:4) inside a Herringbone mixer microfluidic device.[13] Upon mixing, the changes in solvent polarity lead to oil aggregation and lipid self-assembly, giving rise to the formation of a nanoemulsion (Figure 1a). To monitor this process, a pair of lipophilic dyes, DiO and DiI were added in the organic phase. Upon nanoemulsion formation, the FRET pair was spontaneously incorporated into the oil core, triggering energy transfer due to the close proximity of the dye molecules.[14] As a result, the donor (DiO) peak’s intensity decreased while that of the FRET peak (DiO excited, DiI emission observed) increased (Figure 1b). The FRET/DiO intensity ratio is linearly related with the DiI/DiO concentration ratio (Figure 1c) and thus can be used as a measure of nanoemulsion formation progress. Moreover, when the total dye concentration in the oil droplet is increased, the FRET/DiO intensity ratio increases as a result of a higher FRET efficiency due to the closer donor-acceptor distance (SI, Figure S2).
Figure 1.
Real-time nanoemulsion formation monitoring using a fluorescence microscope on a microfluidics device. (a) Schematic illustration of the setup and FRET mechanism. (b) Emission spectra of nanoemulsions containing different DiI/DiO concentration ratios, excited at 458 nm. (c) Correlation between the FRET/DiO peak intensity ratio and the DiI/DiO concentration ratio.
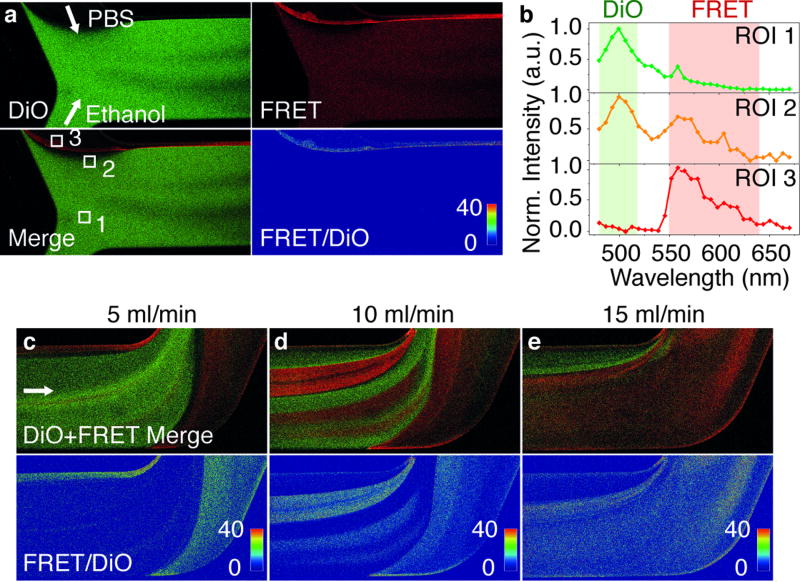
Confocal microscopy imaging through different filter channels on different sections of the microfluidic chamber allowed studying the precise time and location where self-assembly occurred. As shown in Figure 2, the DiO channel represents the emission from the donor dye in the organic phase. The FRET channel represents mainly the FRET signal from the formed nanoemulsion in the mixed phase, but it also contains some spillover from the DiO emission. The FRET/DiO image is the result of the calculated intensity ratio. This ratio is not affected by the channel spill-over, it is also independent of the local dye concentration, and thus measures more accurately the location and degree of nanoemulsion formation.[6b] Video recordings of the dynamic process of the solutions’ confluence are included in the SI (Movie S1–2). Snapshots of the initial section of the chamber showing steady flow conditions are displayed in Figure 2a. A rim of high FRET intensity can be clearly discerned at the interface of organic and aqueous phases indicating that the self-assembly process takes place immediately after the two solutions mix. For detailed analysis, emission spectra at each image pixel were also recorded. Spectra from the three regions of interest (ROI) delineated in Figure 2a are shown in Figure 2b: ROI 1 corresponds to the organic phase, ROI 2 lies at the periphery of the solutions’ mixing area, where only incipient FRET signal was observed, and the ROI 3 corresponds to the central mixing area, where FRET was clearly registered (Figure 2b). The shape of the spectra thus accurately indicated the extent of nanoemulsion formation. (Images from the middle section of the chamber are included in SI, Figure S3)
Figure 2. Confocal microscopy images of the nanoemulsion formation.
(a) Images taken at the initial section of the microfluidic chamber. White arrows indicate the flow directions of PBS and ethanol phases. (b) Emission spectra at indicated ROIs in a obtained from spectral imaging. Colored regions indicate the emission filters used for the images in a. (c) Images taken at the end section of the microfluidic chamber. The dimensions of all the images are 1.6×0.8 mm.
This real-time imaging provides instant feedback on nanoparticle formation in the microfluidic system and facilitates optimization of the synthesis. As an example, the effect of flow rate on nanoemulsion formation was investigated. Dynamic light scattering (DLS) measurements revealed a smaller particle size and lower polydispersity at higher flow rates (SI, Figure S4). Images taken at the end section of the microfluidic chamber (Figure 2c–e) revealed that the progress of nanoemulsion formation was strongly dependent on the flow rate. As shown in Figure 2c–e (Movies S3–5), by increasing the rate from 5 to 15 ml/min, the remaining organic phase was greatly reduced and the volume of mixed phase was expanded correspondingly, indicative of a more complete nanoemulsion formation. Therefore, the larger particle size and wider size distribution produced at slower flow rate are due to the large amount of remaining organic phase, which is mixed uncontrolledly after leaving the microfluidic chamber.
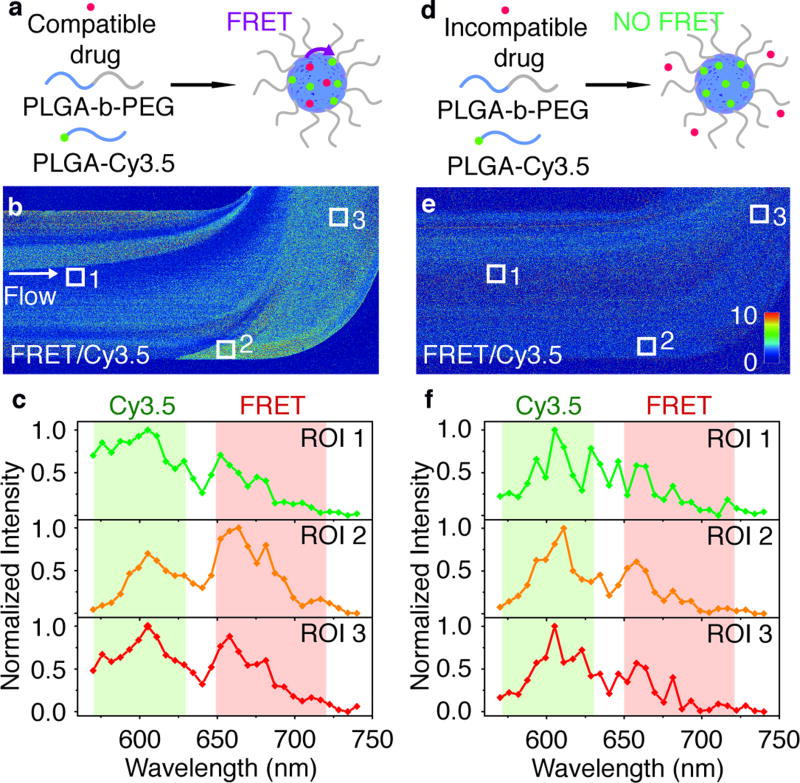
Subsequently, we used the same FRET imaging method to visualize the assembly and model drug loading process of polymeric nanoparticles based on PLGA-b-PEG block copolymers, one of most extensively studied platforms for therapeutic purposes.[15] As illustrated in Figure 3a,d, the polymeric core is labeled with the donor dye Cy3.5 that are conjugated to the distal end of PLGA chains, while the model drugs are Cy5 dye derivatives (see SI, Figure S5 for chemical structures). FRET will only occur when the Cy5 model drugs are integrated in the Cy3.5-labeled PLGA-PEG nanoparticle, causing the FRET/Cy3.5 intensity ratio to increase (SI, Figure S6). We infused and mixed an acetonitrile solution containing PLGA-b-PEG block copolymer, PLGA-Cy3.5, and the corresponding model drug in a microfluidic chip, along with PBS. When the hydrophobic model drug Cy5-OLA (log D= 6.7 at pH= 7.4) was used, microscopy data revealed that as soon as the two phases got in contact, the resulting nanoparticles were instantaneously loaded with the model drug (similar to the nanoemulsion formation). At the end section of the chamber (Figure 3b), although some heterogeneity can be observed, the high FRET/Cy3.5 intensity ratio dominated the flow, indicating successful loading of Cy5-OLA onto the nanoparticles. This was confirmed by detailed ROI spectral analyses: in ROI 2 and ROI 3, the more intense FRET peak was consistent with the characteristic spectrum of drug-loaded nanoparticles (SI, Figure S7). On the contrary, when a water-soluble model drug, sulfo-Cy5 (log D=−5.5 at pH= 7.4) was used, the results were very different (Figure 3e). No elevated FRET/Cy3.5 intensity ratio was observed within the entire chamber (Figure 3f). In addition, FRET peaks were absent or very weak from the emission spectra from all three ROIs. All these observations indicated that the sulfo-Cy5 was not loaded onto the nanoparticle after the microfluidic synthesis.
Figure 3. Real-time monitoring of PLGA-b-PEG polymer nanoparticle formation and spontaneous drug loading.
(a, b, c) Hydrophobic Cy5-OLA model drug. (d, e, f) Hydrophilic sulfo-Cy5 model drug. (a, d) Schematic illustration of drug loading and FRET mechanism. (b, e) Images of FRET/Cy3.5 intensity ratio taken at the end section of the microfluidic cham-ber. The dimensions of the images are 1.6×0.8 mm. (c, f) Emission spectra recorded at ROIs indicated in b, e. Colored regions indicate emission filters used for images in b, e.
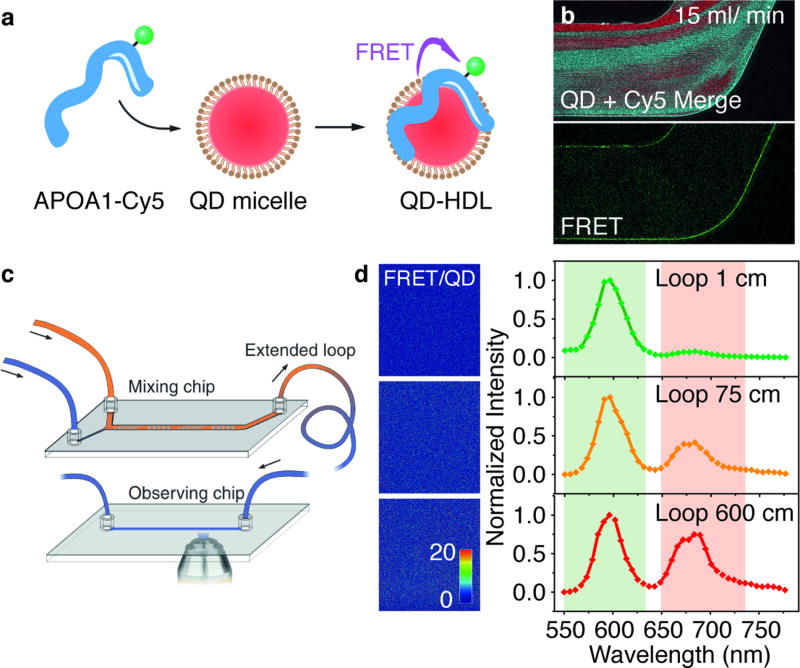
Finally, we studied the formation of HDL nanoparticles with a nanocrystalline core. During the past decade, these nature-derived nanoparticles have been developed for targeted drug-delivery and molecular imaging purposes.[16] Previously, we have reported a microfluidic-based method for the synthesis of reconstituted HDL containing a quantum dot (QD) core, which involves fusing apolipoprotein A1 (APOA1) into a previously formed phospholipid-coated QD (PL-QDs).[4b] Here, using the FRET from a 600 nm emitting PL-QDs and Cy5-labeled APOA1 (APOA1-Cy5), we were able to monitor the formation of QD-HDL nanoparticles (Figure 4a).[5b] (See the emission spectra of QD-HDL with varying amount of APOA1-Cy5 attached on QDs in SI, Figure 5) Both APOA1-Cy5 and PL-QDs were dispersed in PBS, and infused into the microfluidic chamber for mixing (at a volume ratio of 1:1). Interestingly, although a higher flow rate (15 ml/min) produced better solution homogeneity at the end of the chip (Figure 4b), the lack of a clear FRET signal suggested incomplete incorporation of the APOA1. We found the QD-HDL formation was a relatively slow dynamic process (compared to the nanoemulsion or polymeric micelle formation), possibly due to low PL-QDs and APOA1 diffusion and protein folding rates (See the QD and APOA1-Cy5 combination dynamics in SI, Figure S8). To observe the gradual QD-HDL formation, we subjected the solution from the mixing chip to an extended loop with an adjustable length, and finally to another observation chip used for imaging purposes (Figure 4c). This setup allowed us to image a time-dependent dynamic process in a space-dependent setting in a steady state condition. We found indeed that with increasing loop length, the FRET/QD intensity ratio gradually increased and the FRET peak in the corresponding spectra became more intense (Figure 4d), indicating the incorporation of the APOA1 into the PL-QD structure with the concomitant formation of QD-HDL. From the emission spectra, we can also obtain semi-quantitative information about the progress of QD-HDL formation. Based on the relation between the number of APOA1 loaded on QDs and the corresponding FRET/QD intensity ratio (SI, Figure S7b), we estimated that after passing through a 1, 75, and 600 cm loop, the APOA1/QD binding ratios are 0.02, 0.09 and 0.29, respectively. These results demonstrate that QD-HDL formation upon mixing of the two components is not instantaneous (as for the nanoemulsions and polymeric nanoparticles), but a process that takes seconds to minutes.
Figure 4. Real-time monitoring of QD core HDL formation.
(a) Schematic illustration of the HDL assembly and establishment of FRET. (b) Confocal imaging of the end section of the microfluidic chamber during the assembly of HDL at flow rate of 15 ml/min. The dimensions of the images are 1.6×0.8 mm. (c) Schematic of the microfluidic device and FRET imaging setup. (d) Images of FRET/Cy3.5 intensity ratio at the observation chip with indicated loop length, and the corrisponding emission spectra.
In summary, we here presented a novel approach to visualize the self-assembly process of three different types of nanoparticles in real time through the combination of a microfluidic-based synthesis approach and FRET imaging. We envision that the presented methodology can be used to gain deeper insight into multiple nanoparticle synthesis aspects, their formation mechanism, and their functionalization.
Supplementary Material
Acknowledgments
FRET microscopy imaging was performed at the Microscopy CORE at the Icahn School of Medicine at Mount Sinai. This work was supported by National Institute of Health grants R01 HL118440 (W.J.M.M.), R01 HL125703 (W.J.M.M.), R01 CA155432 (W.J.M.M.), R01 EB009638 (Z.A.F.), Harold S. Geneen Charitable Trust Award (Z.A.F.), NWO VIDI (W.J.M.M.), and Norwegian Research Council, project 230788/F20 (S.H.).
Footnotes
Supporting information for this article is given via a link at the end of the document.
References
- 1.Shi J, Xiao Z, Kamaly N, Farokhzad OC. Acc. Chem. Res. 2011;44:1123–1134. doi: 10.1021/ar200054n. [DOI] [PubMed] [Google Scholar]
- 2.Farokhzad OC, Langer R. ACS Nano. 2009;3:16–20. doi: 10.1021/nn900002m. [DOI] [PubMed] [Google Scholar]
- 3.Rajagopalan T, Venumadhav K, Arkasubhra G, Nripen C, Keshab G, Shubhra G. Reports on Progress in Physics. 2013;76:066501. [Google Scholar]
- 4.a) Valencia PM, Farokhzad OC, Karnik R, Langer R. Nat. Nanotechnol. 2012;7:623–629. doi: 10.1038/nnano.2012.168. [DOI] [PMC free article] [PubMed] [Google Scholar]; b) Kim Y, Fay F, Cormode DP, Sanchez-Gaytan BL, Tang J, Hennessy EJ, Ma M, Moore K, Farokhzad OC, Fisher EA, Mulder WJM, Langer R, Fayad ZA. ACS Nano. 2013;7:9975–9983. doi: 10.1021/nn4039063. [DOI] [PMC free article] [PubMed] [Google Scholar]; c) Chen D, Love KT, Chen Y, Eltoukhy AA, Kastrup C, Sahay G, Jeon A, Dong Y, Whitehead KA, Anderson DG. J. Am. Chem. Soc. 2012;134:6948–6951. doi: 10.1021/ja301621z. [DOI] [PubMed] [Google Scholar]; d) Zhigaltsev IV, Belliveau N, Hafez I, Leung AK, Huft J, Hansen C, Cullis PR. Langmuir. 2012;28:3633–3640. doi: 10.1021/la204833h. [DOI] [PubMed] [Google Scholar]; e Tsui JH, Lee W, Pun SH, Kim J, Kim D-H. Adv. Drug Delivery Rev. 2013;65:1575–1588. doi: 10.1016/j.addr.2013.07.004. [DOI] [PMC free article] [PubMed] [Google Scholar]
- 5.a) Zhao Y, Schapotschnikow P, Skajaa T, Vlugt TJH, Mulder WJM, de Mello Donegá C, Meijerink A. Small. 2014;10:1163–1170. doi: 10.1002/smll.201301962. [DOI] [PubMed] [Google Scholar]; b) Skajaa T, Zhao Y, van den Heuvel DJ, Gerritsen HC, Cormode DP, Koole R, van Schooneveld MM, Post JA, Fisher EA, Fayad ZA, de Mello Donega C, Meijerink A, Mulder WJ. Nano Lett. 2010;10:5131–5138. doi: 10.1021/nl1037903. [DOI] [PMC free article] [PubMed] [Google Scholar]
- 6.a) Zhao Y, van Rooy I, Hak S, Fay F, Tang J, Davies CdL, Skobe M, Fisher EA, Radu A, Fayad ZA, de Mello Donegá C, Meijerink A, Mulder WJM. ACS Nano. 2013;7:10362–10370. doi: 10.1021/nn404782p. [DOI] [PMC free article] [PubMed] [Google Scholar]; b) Zhao Y, Fay F, Hak S, Manuel Perez-Aguilar J, Sanchez-Gaytan BL, Goode B, Duivenvoorden R, de Lange Davies C, Bjorkoy A, Weinstein H, Fayad ZA, Perez-Medina C, Mulder WJM. Nat. Commun. 2016;7 doi: 10.1038/ncomms11221. [DOI] [PMC free article] [PubMed] [Google Scholar]
- 7.a) Gianella A, Jarzyna PA, Mani V, Ramachandran S, Calcagno C, Tang J, Kann B, Dijk WJ, Thijssen VL, Griffioen AW, Storm G, Fayad ZA, Mulder WJ. ACS Nano. 2011;5:4422–4433. doi: 10.1021/nn103336a. [DOI] [PMC free article] [PubMed] [Google Scholar]; b) Hak S, Helgesen E, Hektoen HH, Huuse EM, Jarzyna PA, Mulder WJM, Haraldseth O, Davies CdL. ACS Nano. 2012;6:5648–5658. doi: 10.1021/nn301630n. [DOI] [PMC free article] [PubMed] [Google Scholar]
- 8.Nishiyama N, Kataoka K. Pharmacol. Ther. 2006;112:630–648. doi: 10.1016/j.pharmthera.2006.05.006. [DOI] [PubMed] [Google Scholar]; b Shuhendler AJ, Pu K, Cui L, Uetrecht JP, Rao J. Nat. Biotechnol. 2014;32:373–380. doi: 10.1038/nbt.2838. [DOI] [PMC free article] [PubMed] [Google Scholar]
- 9.Cormode DP, Skajaa T, van Schooneveld MM, Koole R, Jarzyna P, Lobatto ME, Calcagno C, Barazza A, Gordon RE, Zanzonico P, Fisher EA, Fayad ZA, Mulder WJ. Nano Lett. 2008;8:3715–3723. doi: 10.1021/nl801958b. [DOI] [PMC free article] [PubMed] [Google Scholar]
- 10.Delmas T, Piraux H, Couffin A-C, Texier I, Vinet F, Poulin P, Cates ME, Bibette J. Langmuir. 2011;27:1683–1692. doi: 10.1021/la104221q. [DOI] [PubMed] [Google Scholar]
- 11.Mason TG, Wilking JN, Meleson K, Chang CB, Graves SM. J. Phys.: Condens. Matter. 2006;18:R635. doi: 10.1103/PhysRevLett.96.015501. [DOI] [PubMed] [Google Scholar]
- 12.Gupta A, Eral HB, Hatton TA, Doyle PS. Soft Matter. 2016;12:2826–2841. doi: 10.1039/c5sm02958a. [DOI] [PubMed] [Google Scholar]
- 13.a) Stroock AD, Dertinger SK, Ajdari A, Mezic I, Stone HA, Whitesides GM. Science. 2002;295:647–651. doi: 10.1126/science.1066238. [DOI] [PubMed] [Google Scholar]; b) Williams MS, Longmuir KJ, Yager P. Lab Chip. 2008;8:1121–1129. doi: 10.1039/b802562b. [DOI] [PMC free article] [PubMed] [Google Scholar]
- 14.Bouchaala R, Mercier L, Andreiuk B, Mély Y, Vandamme T, Anton N, Goetz JG, Klymchenko AS. J. Control. Release. 2016;236:57–67. doi: 10.1016/j.jconrel.2016.06.027. [DOI] [PMC free article] [PubMed] [Google Scholar]
- 15.Tong R, Gabrielson NP, Fan TM, Cheng J. Current opinion in solid state & materials science. 2012;16:323–332. doi: 10.1016/j.cossms.2013.01.001. [DOI] [PMC free article] [PubMed] [Google Scholar]
- 16.Mulder WJM, Strijkers GJ, van Tilborg GAF, Cormode DP, Fayad ZA, Nicolay K. Acc. Chem. Res. 2009;42:904–914. doi: 10.1021/ar800223c. [DOI] [PMC free article] [PubMed] [Google Scholar]
Associated Data
This section collects any data citations, data availability statements, or supplementary materials included in this article.


