Abstract
Analysis of single nucleotide polymorphisms (SNPs) has been and will be increasingly utilized in various genetic disciplines, particularly in studying genetic determinants of complex diseases. Such studies will be facilitated by rapid, simple, low cost and high throughput methodologies for SNP genotyping. One such method is reported here, named tetra-primer ARMS-PCR, which employs two primer pairs to amplify, respectively, the two different alleles of a SNP in a single PCR reaction. A computer program for designing primers was developed. Tetra-primer ARMS-PCR was combined with microplate array diagonal gel electrophoresis, gaining the advantage of high throughput for gel-based resolution of tetra-primer ARMS-PCR products. The technique was applied to analyse a number of SNPs and the results were completely consistent with those from an independent method, restriction fragment length polymorphism analysis.
INTRODUCTION
It is estimated that single nucleotide polymorphisms (SNPs) occur on average once per 250–1000 bp and account for ∼90% of DNA sequence variants in the human genome (1,2). The high density and mutational stability of SNPs make them particularly useful DNA markers for population genetics and for mapping susceptibility genes for complex diseases (3). Because such studies will involve analysis of large marker sets in large numbers of subjects, they will benefit from rapid, simple, low cost and high throughput methods for SNP genotyping. Developing such techniques has thus become one of the new goals of the Human Genome Project (4).
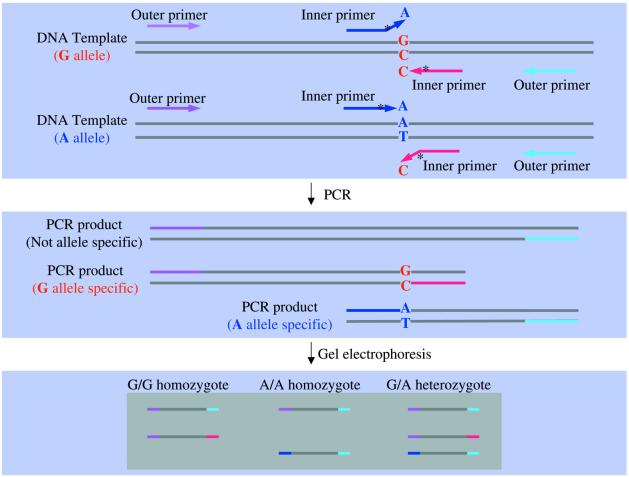
A simple and economical SNP genotyping method involving a single PCR reaction followed by gel electrophoresis is reported here. The technique, named tetra-primer ARMS-PCR, adopts certain principles of the tetra-primer PCR method (5) and the amplification refractory mutation system (ARMS) (6; Fig. 1). Differences between the tetra-primer ARMS-PCR method, the original tetra-primer PCR method and the Bi-PASA (bidirectional PCR amplification of specific alleles) method reported by Liu et al. (7) are summarised in Table 1. In contrast to Bi-PASA, both inner primers of the tetra-primer ARMS-PCR method encompass a deliberate mismatch at position –2 from the 3′-terminus. An extra destabilizing mismatch has been found to increase the specificity of classical ARMS-PCR (6,8–11). Rules for selecting a nucleotide for the additional mismatch in classical ARMS PCR have been described previously (8): a ‘strong’ mismatch (G/A or C/T mismatches) at the 3′-terminus of an allele-specific primer will likely require a ‘weak’ second mismatch (C/A or G/T) and vice versa, whereas a ‘medium’ mismatch (A/A, C/C, G/G or T/T) at the 3′-terminus will likely require a ‘medium’ second mismatch.
Figure 1.
Schematic presentation of the tetra-primer ARMS-PCR method. The single nucleotide polymorphism used here as an example is a G→A substitution, but the method can be used to type other types of single base substitutions. Two allele-specific amplicons are generated using two pairs of primers, one pair (indicated by pink and red arrows, respectively) producing an amplicon representing the G allele and the other pair (indicated by indigo and blue arrows, respectively) producing an amplicon representing the A allele. Allele specificity is conferred by a mismatch between the 3′-terminal base of an inner primer and the template. To enhance allelic specificity, a second deliberate mismatch (indicated by an asterisk) at position –2 from the 3′-terminus is also incorporated in the inner primers. The primers are 26 nt or longer, so as to minimize the difference in stability of primers annealed to the target and non-target alleles, ensuring that allele specificity results from differences in extension rate, rather than hybridisation rate. By positioning the two outer primers at different distances from the polymorphic nucleotide, the two allele-specific amplicons differ in length, allowing them to be discriminated by gel electrophoresis.
Table 1. A comparison of tetra-primer ARMS-PCR with original tetra-primer PCR and with Bi-PASA.
| |
|
Tetra-primer ARMS-PCR |
Tetra-primer PCR |
Bi-PASA |
| Inner primers | ||||
| Allele-specific mismatch | At 3′-terminal base | At centre of primer | At 3′-terminal base | |
| Additional mismatch | Yes, at position –2 from 3′-terminus | No | No | |
| Length | ∼28 bases | ∼15 bases | ∼20 bases exclusive of tail | |
| Tail | No | No | Yes | |
| Inner/outer primer ratio | 10 | 1 | 1 | |
| Annealing temperature | Constant or touchdown | Higher in early cycles | Constant |
It is also demonstrated here that high genotyping throughput can be achieved by combining this method with the microplate array diagonal gel electrophoresis (MADGE) technique (12). As primer design is a critical part of this method and is time consuming, we have developed a primer design computer program and made it accessible to other users through the Internet.
MATERIALS AND METHODS
Tetra-primer ARMS-PCR
Each PCR reaction was carried out in a total volume of 10 µl, containing 30 ng of template DNA, 10 pmol of each inner primer (Table 2), 1 pmol of each outer primer (Table 2), 200 µM dNTP, appropriate concentration of MgCl2 (Table 2), 20 mM Tris–HCl pH 8.4, 50 mM KCl, 0.05% (v/v) W1 (Life Technologies, Paisley, UK) and 0.5 U Taq polymerase (Life Technologies). The solution was overlaid with 5 µl of liquid paraffin and incubated for 2 min at 95°C, followed by 35 cycles of 1 min denaturation (95°C), 1 min annealing (annealing temperatures for different PCRs are described in Table 2) and 1 min extension (72°C), and an additional two minutes extension at 72°C at the end of the 35 cycles. For touchdown reactions the annealing temperature was 72°C for the first cycle, decreasing by 1°C per cycle until the annealing temperature indicated in Table 2 was reached, then continuing at that temperature in the annealing step of the remaining cycles.
Table 2. PCR primers and conditions.
| Genetic polymorphism |
Primer sequence |
Tm |
Touchdown PCR |
Annealing temperature |
Mg2+ |
Amplicon size |
| TNF –308G→A | Forward inner primer (A allele): 5′-TGGAGGCAATAGGTTTTGAGGGGCAGGA | 68°C | Yes | 63°C | 2.5 mM | 154 bp (A allele) |
| Reverse inner primer (G allele): 5′-TAGGACCCTGGAGGCTGAACCCCGTACC | 72°C | 224 bp (G allele) | ||||
| Forward outer primer: 5′-ACCCAAACACAGGCCTCAGGACTCAACA | 68°C | 323 bp (from two outer primers) | ||||
| Reverse outer primer: 5′-AGTTGGGGACACGCAAGCATGAAGGATA | 65°C | |||||
| IL6 –174G→C | Forward inner primer (G allele): 5′-GCACTTTTCCCCCTAGTTGTGTCTTCCG | 68°C | Yes | 63°C | 2.5 mM | 205 bp (G allele) |
| Reverse inner primer (C allele): 5′-ATTGTGCAATGTGACGTCCTTTAGCTTG | 64°C | 176 bp (C allele) | ||||
| Forward outer primer: 5′-GACTTCAGCTTTACTCTTTGTCAAGACA | 62°C | 326 bp (from two outer primers) | ||||
| Reverse outer primer: 5′-GAATGAGCCTCAGACATCTCCAGTCCTA | 67°C | |||||
| AGTR1 1166A→C | Forward inner primer (A allele): 5′-TCTGCAGCACTTCACTACCAAATGAACA | 64°C | No | 58°C | 3.5 mM | 251 bp (A allele) |
| Reverse inner primer (C allele): 5′-TCTCCTTCAATTCTGAAAAGTAGCTGAG | 62°C | 224 bp (C allele) | ||||
| Forward outer primer: 5′-GCCAAATCCCACTCAAACCTTTCAACAA | 64°C | 421 bp (from two outer primers) | ||||
| Reverse outer primer: 5′-AAGCAGGCTAGGGAGATTGCATTTCTGT | 65°C |
A 5 µl aliquot of the PCR products was mixed with 2 µl of loading buffer and subjected to horizontal non-denaturing polyacrylamide gel (10%) electrophoresis. The gel was stained with Vistra green (Amersham Pharmacia Biotech, Little Chalfont, UK) and scanned using a fluorimager 595 (Molecular Dynamics, Sunnyvale, CA).
Validation of genotypes scored by tetra-primer ARMS-PCR
To validate the accuracy of genotype scoring by tetra-primer ARMS-PCR, conventional PCR was carried out, followed by restriction endonuclease digestion. Each PCR reaction was carried out in a total volume of 25 µl, containing 30 ng of template DNA, 10 pmol of each of the two outer primers as described in Table 2 (with the exception of the IL6 PCR, which was carried out using the forward outer primer and a new reverse primer, 5′-ATGTGACGTCCTTTACCAT-3′, to create a NcoI site), 200 µM dNTP, MgCl2 (1.5 mM for TNF, 3 mM for IL6 and 2 mM for AGTR1), 20 mM Tris–HCl pH 8.4, 50 mM KCl, 0.05% (v/v) W1 and 1 U Taq polymerase. The solution was overlaid with 20 µl of liquid paraffin and incubated for 2 min at 95°C, followed by 30 cycles of 1 min at 95°C, 1 min at 60°C and 1 min at 72°C and an additional 10 min at 72°C at the end of the 30 cycles. A 15 µl aliquot of the PCR reaction was mixed with 3 U of an appropriate restriction endonuclease (i.e. BsmFI for TNF, NcoI for IL6 and DdeI for AGTR1). The solution was incubated at 65°C (for BsmFI) or 37°C (for NcoI and DdeI) for 16 h. A 5 µl aliquot of the digests was analysed by gel electrophoresis as described above.
Microplate array diagonal gel electrophoresis (MADGE)
The MADGE method has been described previously [original concept cited in Day and Humphries (12); US Patent 6,071,396 at http://www.uspto.gov/patft/; Trends Online Protocols, extensive details available at http://tto.trends.com/tto/index_of_TTO.shtml, Vol. 103 Po2068, Vol. 107 Po2069; equipment and gels available from Madge-NBS, Huntingdon, UK]. In brief, an open-faced polyacrylamide gel anchored on a glass plate is used. The gels contain cubical wells, 2 mm3 for 96-well or 1.5 mm3 for 384-well gels. The wells are spaced in an 8 × 12 mm, 9 mm pitch format which is directly compatible with PCR (or other) microplate transfer, but relative to the line of electrophoresis the 8 × 12 arrays are on the diagonal, e.g. turned by 18.4° to permit longer track lengths. Gels are made using suitably machined plastic plates into which gel mix is poured and air is excluded by direct closure with a Sticky Silane-coated glass plate, to which the gel will bond. The small gel-bearing glass plate is then prised off for ‘dry’ or submerged use in horizontal boxes. Gel images are obtained and semi-automatic computerised data analysis are undertaken combining Phoretix/MADGE software (NonLinear Dynamics, Newcastle, UK) and Microsoft Excel.
Primer design program
The program is accessible through the Internet at http://cedar.genetics.soton.ac.uk/public_html/primer1.html. Java was used as the implementation language. Java threads and locks were employed to control and coordinate different processes. User inputs were processed in Javascript before being submitted to the program CGI. The primer design program is outlined in Figure 4. Primer melting temperature was calculated using the nearest neighbour parameters (13) and the formula given by Rychlik et al. (14). The algorithm for calculating complementarities was that described by Rozen and Skaletsky (15).
Figure 4.
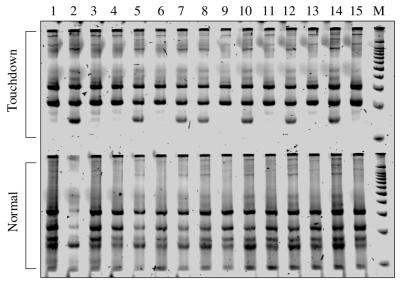
Results of tetra-primer ARMS-PCR reactions with the TNF gene –308G→A polymorphism, with touchdown or normal cycling conditions.
RESULTS
Results of tetra-primer ARMS-PCR
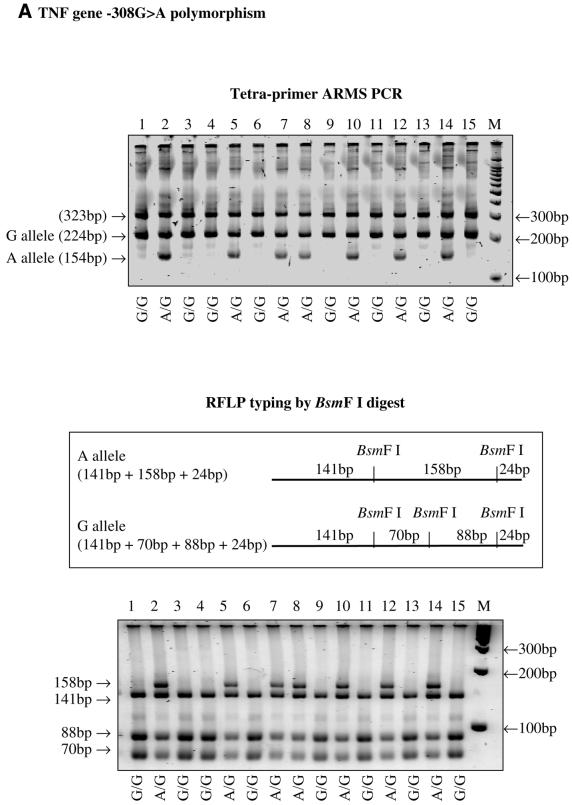
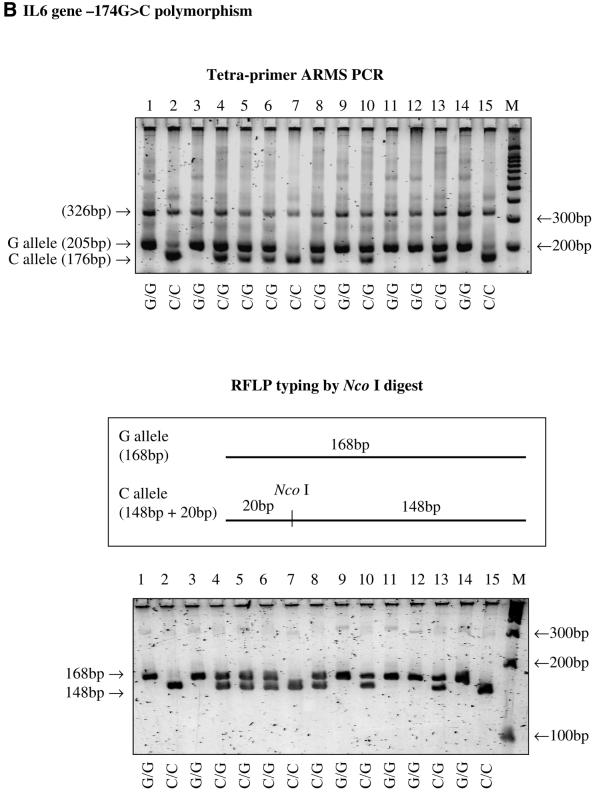
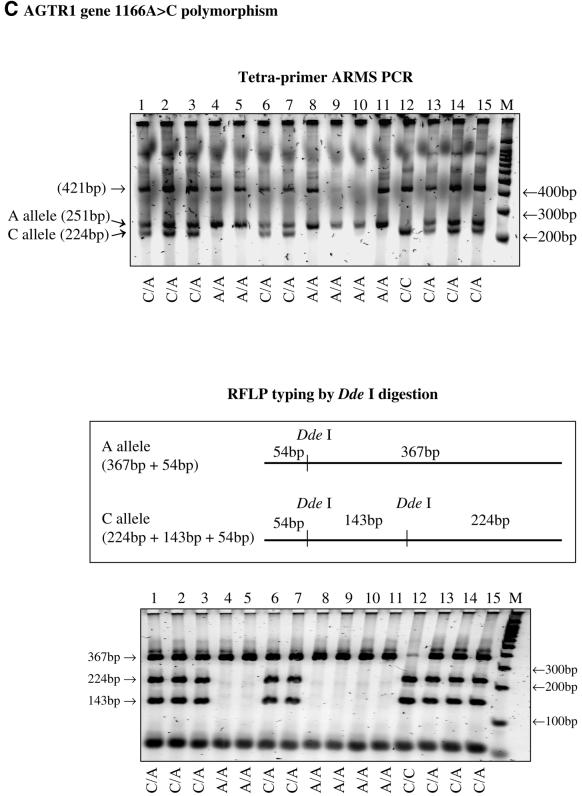
The tetra-primer ARMS-PCR method was successfully applied to type three different SNPs, i.e. the –308G→A polymorphism in the tumour necrosis factor (TNF) gene, the –174G→C polymorphism in the interleukin 6 (IL6) gene and the 1166A→C polymorphism in the angiotensin receptor 1 (AGTR1) gene. The genotypes determined by this method were consistent with those determined by the classical restriction endonuclease digestion method (Fig. 2).
Figure 2.
(Above and previous two pages) Results of tetra-primer ARMS-PCR and validation using the restriction fragment length polymorphism typing method. (A) the TNF gene –308G→A polymorphism; (B) the IL6 gene –174G→C polymorphism; (C) the AGTR1 gene 1166A→C polymorphism.
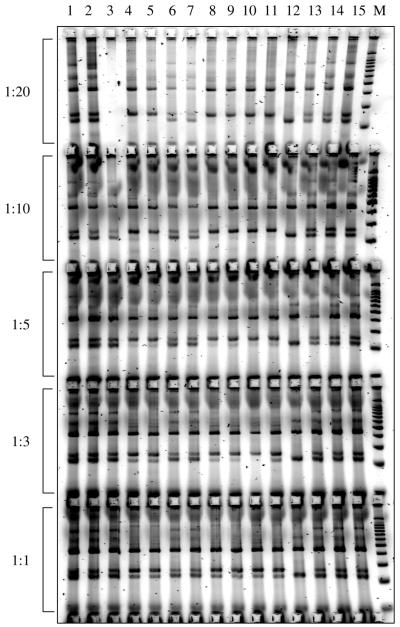
We found that reducing the final concentrations of outer primers (e.g. a 1:10 ratio of outer versus inner primers in terms of their final concentration) enhanced amplification of the two shorter and allele-specific products (Fig. 3) and a touchdown programme [e.g. the annealing temperature in the first PCR cycle is 5°C higher than the average melting temperature (Tm) of the inner primers, decreases by 1°C per cycle in the following 10 cycles, then remains at that annealing temperature for the remaining cycles] reduced artificial products in some cases (Fig. 4).
Figure 3.
Tetra-primer ARMS-PCR assays with different concentrations of the outer primers. Shown here are tetra-primer ARMS-PCR assays for the AGTR1 gene 1166A→C polymorphism, with the same amounts of inner primers but different amounts of outer primers (i.e. the ratios of outer primers to inner primers in terms of their final concentration being 1:20, 1:10, 1:5, 1:3 or 1:1, respectively).
Allele specificity was not observed when applying the tetra-primer ARMS-PCR method to type the angiotensinogen gene T174→M polymorphism. However, subsequent experiments using the classical ARMS-PCR method also failed to achieve allele specificity for this polymorphism (data not shown), suggesting that the non-specificity was likely due to the previously described phenomenon that a 3′-terminal mismatch is not refractory to extension in some cases (6,8). In such cases it is likely necessary to redesign the primers or use alternative genotyping techniques.
Analysis of tetra-primer ARMS-PCR products using MADGE
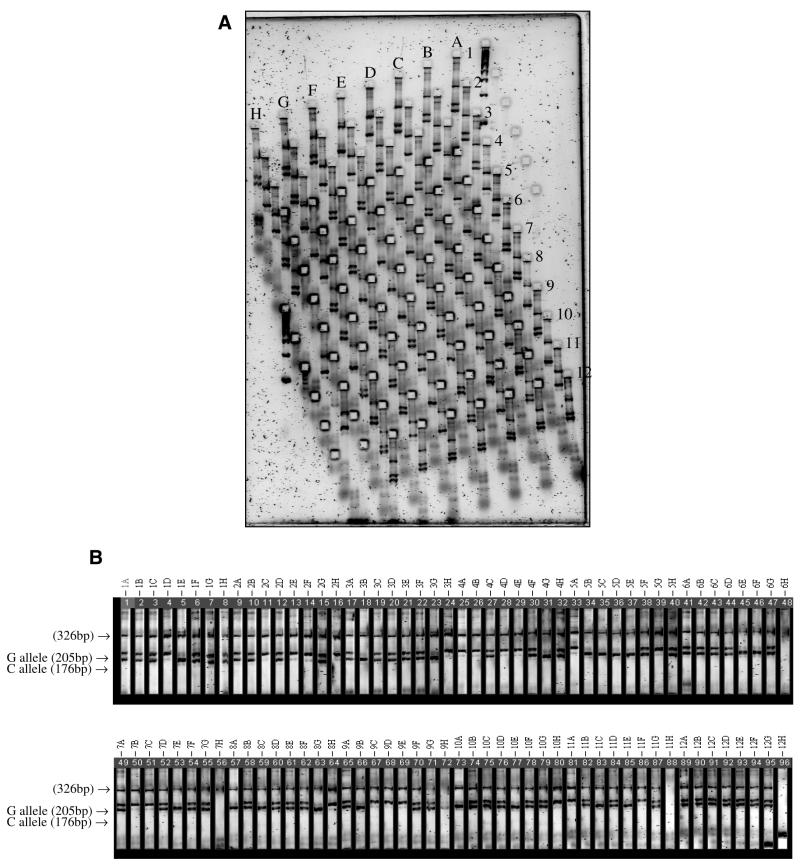
To increase throughput, tetra-primer ARMS-PCR products were analysed using the MADGE system (12), which allows arrays of samples to be loaded and electrophoresed in the same configuration as in a standard 96-well microplate (Fig. 5). Using 96-well plates, the procedure normally takes a total of 75 min to complete (20 min to prepare the gel and loading samples, 40 min to run the gel, 10 min to stain with Vistra green and 5 min to scan using a fluorimager) and with multiple gels running in parallel, 3 × 96 samples can be analysed within 2 h. Working in larger batch mode (preparation of gels in larger batches, e.g. 10 gels prepared at the same time) and higher density formats (e.g. PCR reactions in 384-well plates) confers higher throughput.
Figure 5.
Analysis of tetra-primer ARMS-PCR products using the MADGE system. (A) PCR products for the IL6 gene –174G→C polymorphism were subjected to MADGE gel electrophoresis. The gel was then stained with Vistra green and scanned using a fluorimager. (B) The MADGE gel image in (A) was analysed using the Phoretix 1D Advanced computer software in which all 96 lanes are laid out in tandem to facilitate genotype scoring. Lanes 11H and 12H, negative controls where no DNA template was included in the PCR reactions; lanes 6H, 7H and 12H, PCR failed.
Computer software to design primers for tetra-primer ARMS-PCR
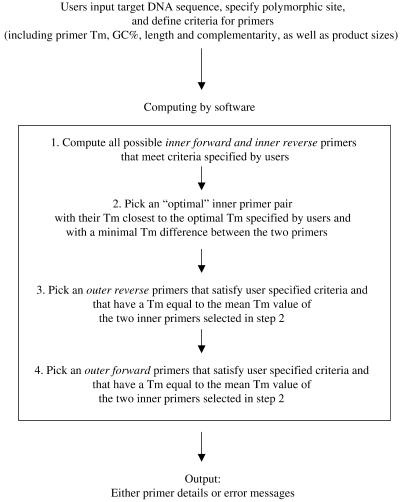
As primer design is a critical part of this method and is time-consuming, we developed a primer design computer program to facilitate this task. The program, outlined in Figure 6, is accessible through the Internet at http://cedar.genetics.soton.ac.uk/public_html/primer1.html. Users need to input the target DNA sequence, specify the polymorphic site and define criteria for the primers (Tm, %GC, length and complementarity) and product sizes.
Figure 6.
Flow chart of the tetra-primer ARMS-PCR primer design program.
DISCUSSION
Current SNP genotyping techniques almost exclusively rely on amplification of the target DNA sequence by PCR, but differ in the means of discriminating between the different alleles, some involving significant post-PCR manipulations. For example, the restriction fragment length polymorphism (RFLP) typing method involves restriction endonuclease digestion of PCR products. Allele-specific oligonucleotide (ASO) melting, another widely used SNP typing technique, involves lengthy blotting and hybridisation procedures. Although the standard ARMS method does not require post-PCR manipulation, it involves two separate PCR reactions, amplifying the two different alleles of an SNP, respectively. The tetra-primer ARMS-PCR method described here circumvents these limitations.
Recent approaches for improved throughput SNP typing include, particularly, microarray-based approaches and mass spectrometric-based techniques [such as matrix-assisted laser desorption/ionisation time-of-flight (MALDI-TOF) mass spectrometry]. Relative to tetra-primer ARMS-PCR, both incur much higher capital costs, however, the former allows distribution in many smaller centres. All methods incur an assay set-up phase, but microarrays lend themselves better to resequencing or multiplex SNP typing of single samples. Tetra-primer ARMS-PCR with MADGE permits single SNP studies in many samples in parallel, whereas MALDI-TOF permits very rapid serial genotyping analyses, but requires significant sample ‘clean-up’ prior to analysis. All methods should be capable of 104–105 calls per week. Our previous analysis of microarray SNP typing (subject to suitably configured chips) was 106 calls per week, at a similar cost per genotype as ASO and ARMS-MADGE (16). The method described here may best fit the ‘middle ground’ of ease of availability to any laboratory both for scale up of smaller projects and secondary investigations of leads from extremely high throughput centres requiring major capital expenditure.
In summary, the procedure reported here is a rapid, simple and economical method for SNP scoring. Combining this method with the MADGE technique permits high throughput SNP analysis. Initial planning of primers is often time consuming, but has been automated here by development of a computer program. This combination should offer a very useful tool for large-scale SNP analysis
Acknowledgments
ACKNOWLEDGEMENTS
S.Y. thanks the British Heart Foundation for support for his research (PG/98183 and PG/98192). I.N.M.D. is a Lister Institute Professor and thanks Wessex Medical Trust for support for facilities and the UK MRC for programme G9828424.
References
- 1.Collins F.S., Brooks,L.D. and Chakravarti,A. (1998) A DNA polymorphism discovery resource for research on human genetic variation. Genome Res., 8, 1229–1231. [DOI] [PubMed] [Google Scholar]
- 2.Kwok P.Y., Deng,Q., Zakeri,H., Taylor,S.L. and Nickerson,D.A. (1996) Increasing the information content of STS-based genome maps: identifying polymorphisms in mapped STSs. Genomics, 31, 123–126. [DOI] [PubMed] [Google Scholar]
- 3.Brookes A.J. (1999) The essence of SNPs. Gene, 234, 177–186. [DOI] [PubMed] [Google Scholar]
- 4.Collins F.S., Patrinos,A., Jordan,E., Chakravarti,A., Gesteland,R. and Walters,L. (1998) New goals for the U.S. Human Genome Project: 1998–2003. Science, 282, 682–689. [DOI] [PubMed] [Google Scholar]
- 5.Ye S., Humphries,S. and Green,F. (1992) Allele specific amplification by tetra-primer PCR. Nucleic Acids Res., 20, 1152. [DOI] [PMC free article] [PubMed] [Google Scholar]
- 6.Newton C.R., Graham,A., Heptinstall,L.E., Powell,S.J., Summers,C., Kalsheker,N., Smith,J.C. and Markham,A.F. (1989) Analysis of any point mutation in DNA. The amplification refractory mutation system (ARMS). Nucleic Acids Res., 17, 2503–2516. [DOI] [PMC free article] [PubMed] [Google Scholar]
- 7.Liu Q., Thorland,E.C., Heit,J.A. and Sommer,S.S. (1997) Overlapping PCR for bidirectional PCR amplification of specific alleles: a rapid one-tube method for simultaneously differentiating homozygotes and heterozygotes. Genome Res., 7, 389–398. [DOI] [PMC free article] [PubMed] [Google Scholar]
- 8.Little S. (1997) ARMS analysis of point mutatons. In Taylor,G.R. (ed.) Laboratory Methods for the Detection of Mutations and Polymorphisms in DNA. CRC Press, Boca Raton, FL, pp. 45–51.
- 9.Chiu R.W., Murphy,M.F., Fidler,C., Zee,B.C., Wainscoat,J.S. and Lo,Y.M. (2001) Determination of RhD zygosity: comparison of a double amplification refractory mutation system approach and a multiplex real-time quantitative PCR approach. Clin. Chem., 47, 667–672. [PubMed] [Google Scholar]
- 10.Donohoe G.G., Salomaki,A., Lehtimaki,T., Pulkki,K. and Kairisto,V. (1999) Rapid identification of apolipoprotein E genotypes by multiplex amplification refractory mutation system PCR and capillary gel electrophoresis. Clin. Chem., 45, 143–146. [PubMed] [Google Scholar]
- 11.Bathelier C., Champenois,T. and Lucotte,G. (1998) ARMS test for diagnosis of factor V Leiden mutation and allele frequencies in France. Mol. Cell Probes, 12, 121–123. [DOI] [PubMed] [Google Scholar]
- 12.Day I.N. and Humphries,S.E. (1994) Electrophoresis for genotyping: microtiter array diagonal gel electrophoresis on horizontal polyacrylamide gels, hydrolink, or agarose. Anal. Biochem., 222, 389–395. [DOI] [PubMed] [Google Scholar]
- 13.Breslauer K.J., Frank,R., Blocker,H. and Marky,L.A. (1986) Predicting DNA duplex stability from the base sequence. Proc. Natl Acad. Sci. USA, 83, 3746–3750. [DOI] [PMC free article] [PubMed] [Google Scholar]
- 14.Rychlik W., Spencer,W.J. and Rhoads,R.E. (1990) Optimization of the annealing temperature for DNA amplification in vitro. Nucleic Acids Res., 18, 6409–6412. [DOI] [PMC free article] [PubMed] [Google Scholar]
- 15.Rozen S. and Skaletsky,H. (2000) Primer3 on the WWW for general users and for biologist programmers. Methods Mol. Biol., 132, 365–386. [DOI] [PubMed] [Google Scholar]
- 16.Holloway J.W., Beghe,B., Turner,S., Hinks,L.J., Day,I.N. and Howell,W.M. (1999) Comparison of three methods for single nucleotide polymorphism typing for DNA bank studies: sequence-specific oligonucleotide probe hybridisation, TaqMan liquid phase hybridisation and microplate array diagonal gel electrophoresis (MADGE). Hum. Mutat., 14, 340–347. [DOI] [PubMed] [Google Scholar]


