

Abstract
While recent breakthroughs in discovery of peptide antibiotics and other Peptidic Natural Products (PNPs) raised the challenge of developing new algorithms for their dereplication, de novo sequencing and identification, the computational technologies for PNP discovery are still in infancy. We review recent advances in genome mining, peptidogenomics, and spectral networks that are now enabling the high-throughput discovery of new PNPs.
1 Introduction
The golden age of antibiotics, that started in the 1940s. was followed by a decline in the pace of antibiotics discovery in the 1990s. However, natural products are again in the center of attention as exemplified by the recent discovery of teixobactin [1, 2]. Depending on their building blocks, natural products are classified into a variety of chemical classes that include Peptidic Natural Products (PNPs), the focus of this review. PNPs are of great biomedical importance since they were optimized by evolution for chemical defense and communication. Starting from penicillin, PNPs have an unparalleled track record in pharmacology: many antibiotics, antiviral and antitumor agents, immunosuppressors, and toxins are PNPs.
While recent breakthroughs in PNP discovery [1, 3, 4] raised the challenge of developing new algorithms for dereplication, de novo sequencing and identification of PNPs, the computational technologies for high-throughput PNP discovery are still in infancy. The traditional process of PNP discovery is to elucidate structure of the compound by chemical assays (such as Nuclear Magnetic Resonance) and association of the chemical compound to its biosynthetic gene cluster by genome manipulations. This process is long, laborious, and requires large amounts of highly purified material. Moreover, rather than discovering novel PNPs, it often rediscovers known PNPs resulting in wasted efforts.
Recently, mass spectrometry (MS) has become a cheap, fast and reliable substitute for the traditional PNP discovery techniques [5, 6]. However, compared to traditional applications of MS in proteomics, application of MS for PNP discovery face additional computational challenges that are now addressed through genome mining, peptidogenomics, and spectral networks:
Genome mining. Sequencing many bacterial and fungi genomes in the last decade opened an era of genome mining for PNP discovery. Genome mining refers to using information about the biosynthetic genes (responsible for synthesizing a PNP) to infer information about the PNP itself. Discovery of the NRP coelichelin in Streptomyces coelicolor was one of the first successes of genome mining [7, 8] that was followed by characterization of many PNPs from sequenced genomes.
Peptidogenomics. Identification mass spectra derived from PNPs is more difficult that traditional peptide identification in proteomics because many PNPs are non-linear peptides that generate complex spectra (the standard proteomics tools fail to identify non-linear peptides). Also, since many PNPs are not directly encoded in genomes, genome mining often fails to generate the database of putative PNPs that contains the exact amino acid sequence of a PNP corresponding to a given spectrum. Instead it produces a database containing an error-prone template that makes matching spectra against such template difficult. As the result, popular proteomics tools such as Sequest [9] and Mascot [10] fail to identify PNPs.
Spectral networks. Bandeira et al., [11] introduced the concept of spectral networks (also knows as molecular networks [4]) that reveal spectra of related compounds (without knowing what these compounds are) using spectral alignment algorithms [12, 13]. Nodes in the spectral networks corresponds to spectra while edges connect spectral pairs, i.e., pairs of spectra that are generated from related peptides (e.g., peptides differing by a single mutation or a modification). Spectral networks enable discovery of novel variants of known PNPs as well as novel PNP families. Thus, since most PNPs form families of related compounds [4]), spectral networks are ideally suited for analyzing PNPs.
PNPs are produced by two types of biosynthetic machineries: Non-Ribosomal Peptide Synthesize (NRPS) [14, 15] and Post Ribosomal Peptide Synthesize (PRPS) [16, 17]. NRPS and PRPS synthesize Non-Ribosomal Peptides (NRPs) and Ribosomally synthesized and Posttranslationally modified Peptides (RiPPs). NRPs are widely distributed and biomedically important natural products that are not directly inscribed in genomes but instead are encoded by NRPSs using non-ribosomal code [18]. While RiPPs are encoded in the genome, the RiPP-encoding genes are often short making it difficult to annotate them (short genes often evade gene prediction algorithms). Moreover, RiPPs often have many unusual modifications making it difficult to identify them via MS (heavily modified peptides often evade peptide identification algorithms).
Analysis of over 1000 bacterial genomes from the Joint Genome Institute (JGI) database revealed that 71% of them harbor a RiPP Pfam domain and 69% harbor an NRPS Pfam domain [3]. This and other studies [4] suggest that we only saw a tip of an iceberg with respect to using genome mining for PNP discovery and raise a challenge of developing new algorithms for PNP discovery via genome mining. Understanding how PNP biosynthetic machineries work is a prerequisite to genome mining and peptidogenomics that involve two steps; predicting candidate PNP biosynthesis gene clusters (called genotypes), and connecting these genotypes to their chemical products (called chemotypes) by MS or NMR. However, connecting genotypes to chemotypes is non-trivial task since the rules defining how a genotype specifies a phenotype remain poorly understood. For example, the existing tools for predicting NRPs from NRPSs remain error-prone. The transition from genotype to phenotype becomes particularly difficult in the case of modifications involved in maturation of PNPs. For example coelichelin genotype was elucidated in 2000 [7], but its chemotype (NRP) was derived only in 2005 [8].
Below we describe PNP dereplication (section 2), PNP sequencing (section 3), and PNP identification via genome mining and peptidogenomics (section 4). We remark that, in difference from dereplication (that reveal known PNPs or their variants), PNP sequencing and identification reveal previously unknown PNPs. Figure 1 illustrates various approaches to PNP discovery.
Figure 1.
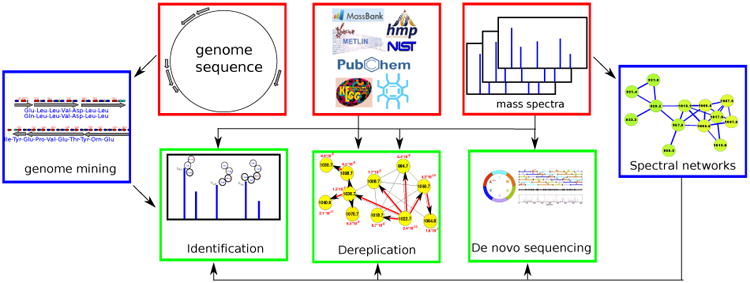
Three computational approaches to PNP discovery. The dereplication approach [19, 20, 21, 22, 23] relies on chemical databases and/or spectral libraries of known PNPs, and it can only discover known PNPs or their variants. The identification approach [24, 25, 26] uses genome mining and peptidogenomics to links PNP genotypes to their chemotypes. Sequencing approach [22, 27, 28, 29] is the last resort for discovering novel PNPs when no genomic information is available (or genome mining efforts fail) and when chemical database does not include a PNP of interest. Spectral networks [11] are crucial for the success of all these approaches.
2 Genome mining, peptidogenomics, and spectral networks
2.1 Genome mining for PNPs
RiPPs are classified into more than 20 classes of compounds (such as lanthibiotics, thiopeptides, cyanobactins, lasso peptides, and many others) based on structural and biosynthetic commonality [30]. Various software tools for RiPP genome mining have been reviewed in [31]. BAGEL2, a genome mining tool for bacteriocins, revealed 150 putative lanthipeptide gene clusters based on conserved biosynthetic, transport, and immunity machinery [32]. ThioFinder, a genome mining tool for thiopeptides, identified 49 bacteria as thiopeptide producers, and predicted 53 novel thiopeptide producing gene clusters [33]. Recent genome mining studies predicted 79 lasso peptides [34] and 27 new cyanobactin-producing Anabaena strains [35]. Development of RiPP genome mining tools is tied to construction of databases of known RiPPs, e.g. Bactibase, a database of 177 bacteriocins [36], and Thiobase, a database of 39 thiopeptides. Availability of these databases for diverse RiPP classes speeds up development of novel machine learning techniques aimed at genome mining for RiPPs [33].
NRPSs are formed by an array of distinct modular sections, each of which is responsible for incorporation (and, if necessary, modification) of a single amino acid into the final NRP. Minimum of three domains are required for each NRPS module, termed adenylation domain (A-domain), peptidyl carrier domain (PCP-domain) and condensation domain (C-domain). The A-domain is responsible for picking the specific amino acids that are to be incorporated into the NRP. Hundreds of different A-domain specificities have been classified, each one recruiting a specific amino acid. This allows us to determine the sequence of the putative NRP by looking at the order of A-domains along the assembly line and assigning a specific monomer to each one. However, since ribosomal code is still poorly understood, the tools for defining specificities of A-domains remain error-prone.
Genome mining tools for identification of NRPS gene clusters and prediction of NRPs they produce include ClustScan [37], NP.searcher [38], NRPSpredictor [39], and NRPSpredictor2 [40]. Figure 2 illustrates how NRP genome mining tools work.
Figure 2.

(a) Pipeline for predicting NRPs based on NRPS analysis (e.g. NRPSpredictor2 [40]). Adenylation domains are shown in red, condensation domains shown in blue, peptidyl carrier protein domains in green, methylation domains in yellow, and thioester domains in purple. (b) Extracting signature sequences (non-ribosomal code) from adenylation domains. The non-ribosomal code postulates that certain amino acids (shown in yellow) in each adenylation domains define a single amino acid in the NRP loaded by this domain. Four shown adenylation domains define 10-aa long signatures DAWTIAAICK, DLTKVGHIGK, DVGEIGSIDK, and DAWMFAAVLK corresponding to amino acids Phe, Asp, Orn, and Val, respectively. The shown 10-aa long signatures is a simplified representation of teh non-ribosomal code, e.g., NRPSpredictor2 uses longer signatures to accurately predict amino acids for each adenylation domain. Only a short segment of the adenylation domains (amino acids 234-337) is shown.
2.2 Peptidogenomics of PNPs
The three key difficulties in peptidogenomics is that (i) many PNPs are non-linear peptides, (ii) many PNPs (all NRPs) are not directly encoded in the genomes, and (iii) even when a PNP is encoded in a genome (all RiPPs), they often have many modifications making it difficult to identify them through standard MS/MS searches. The existing peptide identification tools have difficulty identifying peptides with many modifications. Also, many PNPs fragment poorly due multiple complex modifications. For example, spectra of RiPPs often feature very few peaks. As the result, conventional proteomics tools fail to identify PNPs.
Kersten et al., 2011 [3] discovered many novel PNPs using a manual peptidogenomic approach for connecting PNPs to their biosynthetic genes and matching them against mass spectra. However, the manual peptidogenomics approach to PNP discovery, while useful [41], is somewhat limited in analyzing large spectral datasets (such as LC-MS/MS datasets from supernatant bacterial extracts) and complex patterns of modifications. Moreover, this approach relies on identifying long peptide sequence tags (4-5 amino acids) to reduce the search space [26]. Such long tags are often not available for multicyclic peptides such as lanthipeptides. Also, the manual approach does not provide estimates of statistical significance, a pre-requisite for analyzing large spectral datasets.
2.3 Spectral networks of PNPs
Spectral networks allow one to enlarge the set of identified PNPs (and sometimes get rid of incorrectly identified PNPs) by analyzing multiple spectra to simultaneously dereplicate, sequence, or identify related unknown peptides. The advantage of this approach (compared to analyzing individual spectra) is that finding peptides that simultaneously explain all spectra in a spectral network results in more accurate Peptide Spectrum Matches. Since most PNPs form families of related peptides, spectral networks can be used to reveal relationships between different spectra without knowing the amino acid sequences corresponding to these spectra.
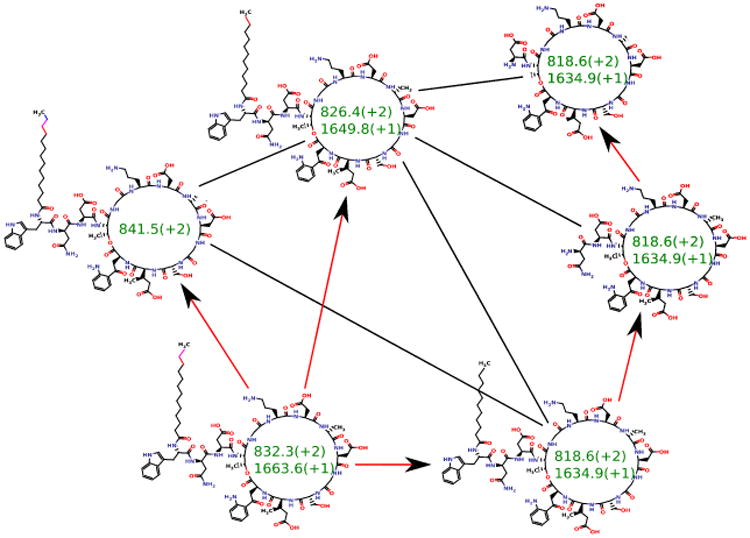
Given a set of peptides P1, … Pm, their peptide network is a graph with nodes P1, … Pm, and edges connecting two peptides if they differ by a single amino acid substitution or a single modification. Figure 3 shows the peptide network for nine variants of tyrocidine, a well-studied family of NRPs from Bacillus brevis [42]. For example, peptide 1 (tyrocidine B1) in this network (red node) is connected to four peptides differing from tyrocidine B1 by a single mutation or modification: tyrocidine A1 (peptide 2), tyrocidine B (peptide 5), tyrocidine C1 (peptide 8), and a previously unreported peptide with mass 1338.7 (peptide 9). However, it is not connected to peptides 3, 4, 6 and 7 since they differ from peptide 1 by multiple modifications. Six of these nine tyrocidines (1, 2, 3, 5, 7, 8) are contained in the database of putative NRPs generated by NRPSpredictor2 (without modifications) and three more differ from these variants by one or two modifications/mutations.
Figure 3.

The peptide network (a) and the spectral network (b) of tyrocidines. The multitag algorithm [24] for starts from a node with a known annotation in the spectral network, and propagates annotations from known to unknown peptides through the edges in the network.
In reality, we are not given peptides P1, … Pm but only their spectra S1, … Sm. Nevertheless, one can approximate the peptide network by constructing the spectral network on nodes S1, … Sm where spectra Si and Sj are connected by an edge if they can be aligned against each other using spectral alignment [13, 11, 43]. Figure 3 shows the peptide and spectral networks of nine tyrocidines and illustrates that the spectral network captures all edges of the peptide network (shared edges between peptide and spectral networks are shown by thick lines). While the peptide and spectral networka in Figure 3 are not identical to the peptide network in Figure 3(a), their shared edges usually allow one to interpret the peptides corresponding to the nodes of the spectral network using the spectral network dereplication algorithm [27].
3 PNP dereplication
PNP researchers face the challenge of maximizing the discovery of new compounds while minimizing the re-evaluation of already known PNPs. The process of using the information about the chemical structure of a previously characterized compound to identify this compound in an experimental sample (without having to repeat the entire isolation and structure-determination process) is called dereplication. In many cases, a PNP in the new sample is absent in the database of known PNPs, but its variant is present in this database (e.g., with a modification or a mutation). Identification of a PNP from its variants is called variable dereplication.
Many dereplication approaches are based on comparison of an experimental spectrum with the theoretical spectrum of a natural product. Hill and Mortishire-Smith, 2005 [19] proposed the bond disconnection approach for generating theoretical spectra of natural products. Various bond disconnection algorithms [21, 44] generate a list of bonds between heavy atoms in a compound and assigning them the breakage score based on the likelihood of each bond being disconnected. The theoretical spectrum is constructed from masses and breakage scores of all substructures resulting from bond disconnections.
While the bond disconnection approach works well for small molecules (less than 500Da), it typically fails for PNPs since the number of fragmented substructures grow exponentially with the PNP length. To address this shortcoming, theoretical spectra of PNPs are formed by disconnecting only amid bonds (rather than all bonds) [22]. For a cyclic PNP of length n, this approach results in a theoretical spectrum represented by n(n – 1) fragments (see Fig. 4). For a branch cyclic PNP with a cycle of length n and a branch of length m, it results in a theoretical spectrum represented by n(n – 1) + 2m fragments.
Figure 4.

(a) Generating theoretical spectrum of a cyclic (tyrocidine) and (b) branch cyclic (daptomycin) peptides. Only four out of 9 · 10 = 90 (9 · 10 +4 · 2= 98) peaks in tyrocidine (daptomycin) are shown.
A Peptide-Spectrum Match (PSM) is a pair of a peptide and a spectrum with the same precursor mass (up to an error δ). In the context of PNP discovery, a PSM score is often defined as the number of peaks shared between a theoretical spectrum and an experimental spectrum (see Fig. 5). Given a spectrum, a peptide that forms a PSM with the highest score against this spectrum (among all peptides in a peptide database) is reported as a potential dereplication of the spectrum.
Figure 5.

Illustration of PSM scoring for a cyclic peptide (the shared peak count is 3).
3.1 Dereplication via chemical databases
Development of chemical structure databases such as PubChem [45] (≈ 46 million compounds), ChemSpider [46] (≈ 28 million compounds), and KEGG [47] (≈ 16 thousand compounds) paved the way for development of bioinformatics tools for natural product dereplication.
Ng et. al., [22] proposed the first algorithm for dereplication (including variable dereplication) of cyclic PNPs and applied it for search in the database of PNPs [48]. Ibrahim et. al., [23] proposed an alternative dereplication approach that is not limited to cyclic NRPs but extends to branch cyclic and linear peptides. However, their approach does not generalize to variable dereplication and does not include analysis of the statistical significance of identified PSMs.
It is well know in the context of traditional proteomics that PSM scores often poorly correlate with statistical significance of PSMs (p-values) [49]. This observation is greatly amplified for nonlinear peptides since scoring PSMs formed by non-linear peptides is currently a way more primitive than scoring PSMs formed by linear peptides (due to the lack of a large learning sample of PSMs formed by non-linear peptides).
Mohimani et. al., [50] developed MS-DPR algorithm for computing p-values of PSMs formed by arbitrary PNPs. MS-DPR addresses an important problem of deciding whether a given spectrum was generated by a linear, a cyclic, or a branch-cyclic peptide since it enables comparison of statistical significance between various peptide structures [50] (see Fig. 6).
Figure 6.

Deciding whether a peptide that produced a spectrum is linear, cyclic or branch cyclic. Given a spectrum, MS-DPR considers various structure assumptions for a peptide that generated the spectrum (e.g. linear, or cyclic, or branch cyclic), and derives a p-value for each such assumption. If one of the structures results in a small p-value (e.g. linear structure with p-value of 0.0001 in Figure above), that structure is accepted as the most likely structure for a given spectrum. Note that even though the linear peptide in this example has the lowest score, it is the most statistically significant among the three structures.
3.2 Dereplication via spectral libraries
Since some natural products feature atypical fragmentation patterns [51], their experimental spectra have low scores against their theoretical spectra. In such cases, instead of dereplication via search in chemical databases, researchers search spectral libraries of natural products by comparing the experimental spectrum of interest against previously identified spectra. Development of large metabolite spectral databases such as NIST [52] (≈120 thousand spectra), METLIN [53] (≈55 thousand spectra), MassBank [54] (≈36 thousand spectra), and HMDB [55] (≈1000 human metabolite spectra) enabled MS/MS library searches for metabolites [56, 57, 58, 20, 59, 51, 60, 61].
While dereplication via the spectral library search is more accurate than dereplication via search in a chemical database, the spectral libraries still contain only a fraction of compounds present in chemical databases (e.g., only 1607 annotated natural product spectra in Global Natural Products Social (GNPS) Molecular Networking dataset [62]). As the result, applications of spectral libraries to PNP dereplication remain limited. For example, Milman and Zhurkovich [63] described dereplication of toxic NRPs based a small spectral library of consisting of only 263 spectra.
3.3 Dereplication via spectral networks
The spectral network approach to PNP dereplication analyzes connected components of a spectral network. As long as there is at least one annotated spectrum in this connected component, its annotation can be propagated to all spectra in this connected components [11]. Ng et. al., [22] and Mohimani et. al., [24, 25] described variable PNP dereplication algorithms using spectral networks and identified many variants of previously known PNPs. For example, Mohimani et. al., [24] discovered a RiPP informatipeptin and further identified many variants of this peptide using dereplication via spectral networks (Figure 7). Watrous et. al., [4], constructed spectral networks of various supernatant bacterial extracts and dereplicated many PNPs using manual analysis of connected components in these networks.
Figure 7.

Spectral network analysis leads to variable dereplication of RiPP informatipeptin (shown in orange) into 3 variant PNP. Ser → Dha and Thr → Dhb conversions in this lanthibiotics are shown in green and blue, respectively.
4 PNP sequencing
While availability of a genome enables PNP discovery via genome mining, many natural products are produced by difficult-to-cultivate organisms whose genomes are still unknown. If genome is unavailable and if dereplication of a PNP fails, de novo sequencing [22, 27, 28, 29] remains the last resort.
While dozens of tools for de novo sequencing of linear peptides have been proposed [64, 65, 66], techniques for de novo sequencing of non-linear peptides are still in infancy. Ng et. al., [22], proposed the first algorithm for sequencing of cyclic peptides that however works only for very well-fragmented spectra. Mohimani et al., [27] developed multiplex de novo peptide sequencing algorithm for the case when spectra of multiple related peptides are available. Multiplex peptide sequencing starts from constructing the spectral network of all compounds in the mixture sample, and identifying clusters of related compounds (connected components in the spectral network). It further attempt to sequence all compounds in this connected component (see Fig. 8). In difference from PNP dereplication via spectral networks (when at least one spectrum in the connected component represents a known compound), de novo PNP sequencing works even when all nodes in the connected component represent unknown compounds. The advantage of spectral networks for PNP sequencing is that finding PNPs that simultaneously explain all spectra in a connected component of a spectral network results in a more accurate approach then sequencing of each individual spectrum.
Figure 8.
The multitag algorithm from [27] for peptide sequencing attempts to sequence all spectra in a spectral network in a coordinated fashion.
When tandem mass spectrometry fails to sequence a PNP, one can attempt multistage (MSn) mass spectrometry and apply multistage de novo sequencing approach [28] (see Fig. 9).
Figure 9.
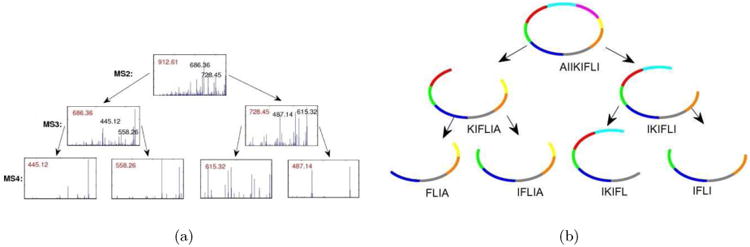
Illustration of an algorithm for peptide sequencing by multistage mass spectrometry. For each candidate peptide, multistage peptide sequencing algorithm scores how well each subpeptide is explained by MSn data.
5 PNP identification
5.1 RiPP identification
The standard MS/MS database search tools are limited with respect to identification of complex RiPPs with more than 2 variable modifications. This limitation makes them inadequate for analyzing such RiPPs as lanthipeptides that often have more than 5 variable modifications. Moreover, even if these tools were able to efficiently search for peptides with more than 2 modifications, the resulting PSMs often would not be reported as statistically significant since many RiPPs are poorly fragmented (due to presence of complex modifications). Search for multiple variable modifications often results in a high false discovery rate (FDR) even for microbial organisms with small proteomes [67].
As the result of these complications, computational approaches to RiPP identification did not keep pace with rapid progress in RiPP discovery in recent years. Cycloquest [68], a tool for RiPP identification, is limited to cyclic peptides with very few modifications. Also, since Cycloquest does not take advantage of genome mining, it is unable to identify poorly fragmented peptides (e.g., lanthipeptides).
Genome mining is crucial for the success of RiPP identification efforts. The statistical significance (E-values) of the found PSMs deteriorates with the increase in the size of the protein database. For example, even well fragmented short peptides (e.g., of length 6 amino acids) are difficult to identify in searches against (large) human proteome yet they can be identified in searches against (small) viral proteome. Thus, one way to make PSMs formed by poorly fragmented spectra statistically significant is to reduce the effective size of the protein database. Fortunately, most RiPPs appear in small windows of ≈ 20 thousand nucleotides around biosynthetic gene clusters, and these clusters can be identified by searching for conserved biosynthetic enzymes. Thus, limiting the search space to this small region of the genome has the potential to reduce the E-values of found PSMs by orders of magnitude thus separating them from false PSMs.
RiPPquest [24] is a RiPP database search tool that addresses these complications and uses a more involved pipeline than peptide identification tools in traditional proteomics (compare Fig. 10(a) with Fig. 10(b)). While RiPPquest is currently limited to lanthipeptide analysis, it can be extended to the majority of other RiPP classes as soon as (i) it implements a biosynthetic rationale for transforming core into mature peptide for a specific RiPP class, and (ii) it implements a genome mining rational for a specific RiPPs class. Below is a brief description of RiPPquest pipeline:
Figure 10.
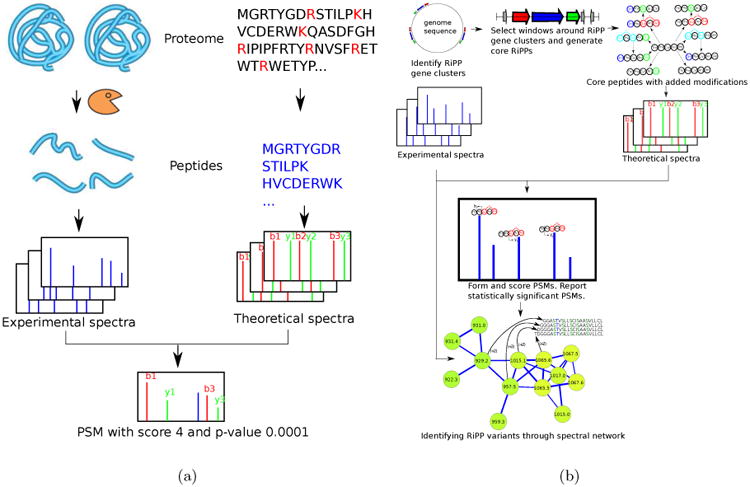
(a) Standard proteomic database search tools (e.g., Sequest [9]) are based on digesting the proteins by an enzyme, and collecting tandem spectra of the resulting peptides. Each spectrum is matched against theoretical spectra of all peptides in a protein database (with mass equal to the the precursor mass of the spectrum) and PSMs with highest scores/lowest p-values are reported. (b) RiPPquest pipeline starts with genome mining for RiPP biosynthetic gene clusters. Genome mining identifies short windows where genes encoding RiPPs are located. Short ORFs are identified in the six frame translation of the selected windows, and putative core RiPPs are selected from these ORFs. Various combinations of modifications are applied to core RiPPs, and the resulting mature RiPPs are scored against the spectral dataset by analyzing all possible PSMs using spectral alignment. Spectral network analysis helps in discovery of novel variants of RiPPs with various modifications.
Genome mining for RiPP biosynthetic genes
RiPPquest uses genome mining tools (e.g., BAGEL2 [32] and ThioFinder [33]) for identification of RiPP gene clusters. For each RiPP domain in the microbial genome, a window of 10,000 bp centered at this domain is selected to form a database of putative core RiPPs for follow up MS/MS database search. Since RiPPs usually appear in short ORFs (shorter than 100 aa), the analysis is further restricted to short ORFs in the 6-frame translation of the genome. Reducing the database size in RiPPquest searches is important since RiPPs are often poorly fragmented and identification of such poorly fragmented spectra in searches against large databases is problematic.
As an example, Streptomyces roseosporus NRRL 11379 genome has three lanthipeptide producing gene clusters, with total of 132 short ORFs, including ORFs producing lanthipeptides SRO-2212 and SRO3108 [3] (see Fig. 11). The database of putative core lanthipeptides is about 100 times smaller than the entire Streptomyces genome (≈ 9Mbp in length).
Figure 11.

(A) Lanthipeptide producing gene clusters in the genomes of (A) Streptomyces roseosporous 11379 and (B) Streptomyces viridochromogenes DSM 40736. The figure shows all Pfam domain discovered in a window of 10,000 bps centered at each lanthipeptide biosyntetic gene cluster. Among Streptomyces roseosporous 11379 clusters, the cluster at location 5263238-5273238 produces the lanthipeptide SRO-2212, and the cluster at location 4496083-4506083 produces the lanthipeptide SRO-3108 [3]. Among Streptomyces viridochromogenes DSM 40736 clusters, the cluster at location 8176050-8186050 produces informatipeptin. Lanthipeptide modification enzymes are shown in blue, protein kinases in green, peptidases in yellow, ABC transporter and membrane in red, regulators in light blue, and precursor peptides in black. Fragments with sequence similarity to known lanthipeptides are shown for each cluster, and known chemotypes are shown in bold.
Transforming core RiPPs into mature RiPPs
In the case of lanthipeptides, the most essential modifications are dehydration of serine and threonine, and formation of the lanthionine and methyl-lanthionine bridges. Further a thiol elimination mechanism for lanthionine modifications during MS yields Cys and Dha at the position of Ser and Cys respectively, in the core peptide [3]. Figure 12 shows all possible modified (mature) peptides for a hypothetical core lanthipeptide Thr-Phe-Cys-Arg-Ser. From a mass spectrometry standpoint, there are eight possible products by accumulation of modifications, resulting in six possible scenarios for observed mass shifts (allowing for Ser → Dha, Ser → Cys, Cys → Dha and Thr → Dhb transformations). The number of possible mature peptides increases exponentially with the number of serines, threonines and cysteines in the core peptide, making it time consuming to try all possible combinations of modifications for every spectrum. For example, for the 22aa core peptide of the lanthipeptide SRO-2212 (TGSQVSLLVCEYSSLSVVLCTP), there exist 1088 possible mature peptides.
Figure 12.

(A) All possible mature peptides for a hypothetic core peptide Thr-Phe-Cys-Arg-Ser. Possible modification are dehydration of Serine and Threonine, and formation of lanthionine and methyllanthionine bridges between Cysteine with Dha and Dhb, respectively. (B) All possible mass spectrometry products (peptide modifications during mass spectrometry) for the eight possible modified peptides shown in (A). When the core peptide amino acid is serine, mass spectrometry analysis can reveal a mass shift corresponding to cysteine (103.00Da), serine (87.03Da) or Dha (69.02Da). When the core peptide amino acid is threonine, the analysis can reveal a mass shift corresponding to threonine (101.04Da) or Dhb (83.03Da). When the core peptide amino acid is cysteine, the analysis can reveal a mass shift corresponding to cysteine (103.00Da) or Dha (69.02Da). A combination of modifications is feasible if the number of Cys → Dha modifications equal the number of Ser → Cys modifications. For a peptide with one Cysteine, one Serine and one Threonine this can give up to twelve possible combinations. However, only six out of these twelve combinations are feasible.
Scoring RiPP spectrum matches
RiPPquest scores PSMs using an advanced scoring function used in de novo peptide sequencing [66]. In the brute force approach, one forms PSMs between each spectrum in the spectral dataset and each mature RiPP (i.e., modified core RiPP) if the parent masses of the spectrum and the mass of the mature RiPP are close to each other (within 0.5Da). Because it is time consuming to compare each spectrum against each possible mature RiPP (derived from a given core RiPP) for large spectral datasets, the spectral alignment technique is used to efficiently find modifications of the core RiPP that best matches the spectrum [69, 43, 12, 13].
Computing p-values of PSMs formed by RiPPs
While PSM scores are useful for selecting top-scoring PSMs, they are notoriously unreliable for estimating the statistical significance of PSMs [49]. To compute p-values of PSMs into their p-values, RiPPquest uses MS-DPR approach [50]. While there exist other methods for computing p-values of PSMs formed by linear peptides [70], MS-DPR is the only approach available today for evaluating p-values of PSMs formed by non-linear (e.g., cyclic) peptides.
Finding RiPP variants using spectral networks
Most classes of RiPPs form families of related peptides, making spectral networks helpful in RiPP analysis [4]. In particular, spectral networks revealed related lanthipeptides with stepwise N-terminal leader processing and different dehydration numbers [25] (see Fig. 7).
5.2 NRP identification
While genome mining techniques accurately identify NRPSs in the genome, accurate determination of specificities of adenylation domains remains difficult, especially for non-standard amino acids that are common in NRPs. While most of NRPs go through modifications such as backbone macrocylization and addition of fatty acid chain, the existing genome mining tools fail to predict most of these modification. That is why NRP identification algorithms have to implement a blind MS/MS search that allows for multiple modifications and mutations. This is a difficult computational problem even in the case of linear peptides [13, 71], let alone non-linear peptides.
NRPquest uses a genome sequence and a spectral dataset as an input and includes the following steps (i) identifying NRPSs in the genome and using non-ribosomal code to construct the database of putative NRPs generated by each NRPS, (ii) matching spectra against the database of putative NRPs, (iii) computing statistical significance of the resulting PSMs and formed by NRPs and generating a list of statistically significant PSMs, (iv) refining and enlarging the set of identified NRPs using spectral networks (Fig. 13).
Figure 13.
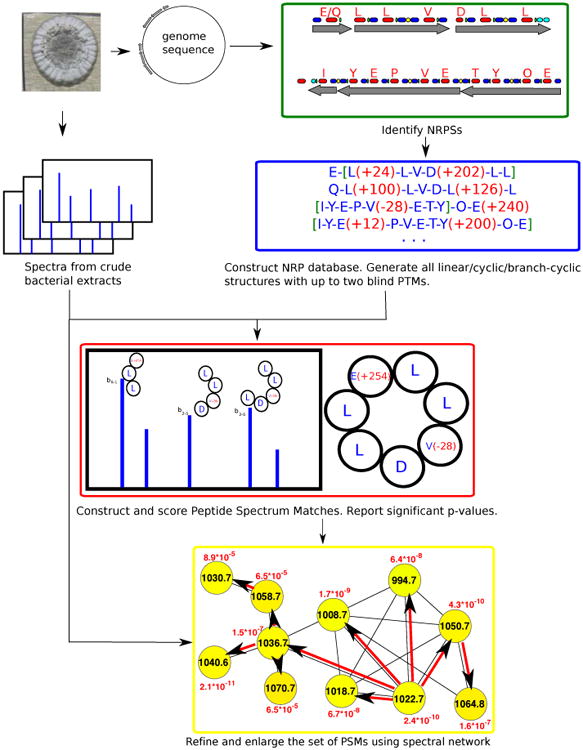
NRPquest pipeline starts with with mining the microbial genome for putative NRPs using NRPSpredictor2 [40] and Antismash [72]. Two blind modifications are added to each NRP and all possible structures (linear/cyclic/branch-cyclic) are considered. PSMs are formed between each spectrum and each putative modified NRP with feasible mass difference. PSMs are scored, and significant PSMs are further analysed by spectral networks. PSMs are rescored based on how well other nodes in their spectral network cluster (connected component) are explained [27].
Constructing database of putative NRPs
NRPquest uses NRPSpredictor2 [40] to identify NRPSs in the genome. NRPSpredictor2 predicts the set of all possible amino acids generated by each adenylation domain in the genome (Fig. 2). By considering all possible peptides formed by these amino acids (each adenylation domain contributes a single amino acid to the corresponding peptide), NRPquest constructs the database of all putative NRPs produced by the organism. NRPquest further searches the genome for methylation domain (PF08242), epimerization domain (TIGR01720), and side chain bond formation domain (cytochrome p450, PF00067) and accounts for the corresponding modification in the database of putative NRPs. If NRPquest finds methylation/epimerization domains, it enforces methylation/epimerization modifications on the corresponding residues. If NRPquest finds cytochrome p450, it considers side chain bond formations between any two arbitrary residues of the peptide, turning a linear peptide into a branch cyclic peptide. For each amino acid sequence in the database of putative NRPs, NRPquest considers linear, cyclic and branch cyclic structures representing these amino acid sequences.
Matching spectral dataset against database of putative NRPs
Each spectrum is matched against each putative peptide in the database of putative NRPs using a brute force algorithm that allows for up to two blind modifications. These blind modifications account for possible inaccurate adenylation specificity prediction of rare non-standard aminoacids (such as kynurenine from daptomycin), modifications (such as modification of homoproline to 4-oxo homoproline in pristinamycin), and fatty acid tails.
Since there is still no large dataset of PSMs formed by cyclic peptides (for learning fragmentation propensities like in [64]), previous studies of cyclic peptides [22, 68] used a somewhat primitive scoring based on the “shared peak” count. NRPquest scores cyclic PSMs using an approach from [68] (Fig. 5) and, to be consistent with the cyclic case, uses the same “shared peak count” approach for linear NRPs.
Computing p-values of PSMs formed by NRPS
NRPquest calculates statistical significance (p-value) of each PSM using MS-DPR algorithm [50] that works for linear, cyclic, and branch-cyclic peptides. It further reports PSMs with p-values below a threshold.
Refining and enlarging the set of identified NRPs using spectral networks
NRPquest constructs a spectral network [11] to refine and enlarge the set of identified PSMs. Most NRPs form families of related peptides, and spectral networks reveal relationships between different spectra without knowing the amino acid sequences corresponding to these spectra. Thus, an individual PSM deemed statistically insignificant may become reliable in the context of multiple related PSMs (and vice versa).
After constructing the spectral network, its connected components (that correspond to families of related peptides) are extracted and the multitag algorithm from [27] is used for identification of all peptides represented by spectra forming this connected component. It further takes advantage of the fact that some spectra in the network have been already annotated by NRPquest. Initializing the spectral network with these reliable PSMs provides the initial tags for the multitag algorithm and makes the approach from [27] more accurate (Fig. 8). Moreover, peptide propagation through spectral network [11, 22] allows one to identify peptide with many modifications (e.g., more than 2) that NRPquest missed during blind searches of individual spectra (since blind searches with more than two modifications become prohibitively time-consuming).
Acknowledgments
This work was supported by the US National Institutes of Health grant 2-P41-GM103484 from the National Center for Research Resources.
References
- 1.Ling LL, Schneider T, Peoples AJ, Spoering AL, Engels I, Conlon BP, Mueller A, Schberle TF, Hughes DE, Epstein S, Jones M, Lazarides L, Steadman VA, Cohen DR, Felix CR, Fetterman KA, Millett WP, Nitti AG, Zullo AM, Chen C, Lewis K. A new antibiotic kills pathogens without detectable resistance. Nature. 2015;517:455–459. doi: 10.1038/nature14098. [DOI] [PMC free article] [PubMed] [Google Scholar]
- 2.Harvey AL, Edrada-Ebel R, Quinn RJ. The re-emergence of natural products for drug discovery in the genomics era. Nature Reviews Drug Discovery. 2015;14:111–129. doi: 10.1038/nrd4510. [DOI] [PubMed] [Google Scholar]
- 3.Kersten R, Yang Y, Cimermancic P, Nam S, Fenical W, Fischbach M, Moore B, Dorrestein PC. A mass spectrometry-guided genome mining approach for natural product peptidogenomics. Nat Chem Biol. 2011;7:794–802. doi: 10.1038/nchembio.684. [DOI] [PMC free article] [PubMed] [Google Scholar]
- 4.Watrous J, Roach P, Alexandrov T, Heath B, Yang J, Kersten R, van der Voort M, Pogliano K, Gross H, Raaijmakers J, Moore B, Laskin J, Bandeira N, Dor-restein P. Mass spectral molecular networking of living microbial colonies. Proc Nat Acad Sci. 2012;109:E1743–1752. doi: 10.1073/pnas.1203689109. [DOI] [PMC free article] [PubMed] [Google Scholar]
- 5.Bouslimani A, Sanchez LM, Garg N, Dorrestein PC. Mass spectrometry of natural products: current, emerging and future technologies. Nat Prod Rep. 2014;31:718–729. doi: 10.1039/c4np00044g. [DOI] [PMC free article] [PubMed] [Google Scholar]
- 6.Ito T, Miyako M. Dereplication of microbial extracts and related analytical technologies. Nat Prod Rep. 2014;67:353–360. doi: 10.1038/ja.2014.12. [DOI] [PubMed] [Google Scholar]
- 7.Challis G, Ravel J. Coelichelin, a new peptide siderophore encoded by the streptomyces coelicolor genome: structure prediction from the sequence of its non ribosomal peptide synthetase. FEMS microbiology letter. 2000;187:111–114. doi: 10.1111/j.1574-6968.2000.tb09145.x. [DOI] [PubMed] [Google Scholar]
- 8.Lautru S, Deeth R, Bailey L, Challis G. Discovery of a new peptide natural product by streptomyces coelicolor genome mining. Nat Chem Biol. 2005;1:265–269. doi: 10.1038/nchembio731. [DOI] [PubMed] [Google Scholar]
- 9.Eng JK, McCormack AL, Yates JR. An approach to correlate tandem mass spectral data of peptides with amino acid sequences in a protein database. J Am Soc Mass Spectrom. 1994;5:976–989. doi: 10.1016/1044-0305(94)80016-2. [DOI] [PubMed] [Google Scholar]
- 10.Perkins DN, Pappin DJ, Creasy DM, Cottrell JS. Probability-based protein identification by searching sequence databases using mass spectrometry data. Electrophoresis. 1999;20:3551–3567. doi: 10.1002/(SICI)1522-2683(19991201)20:18<3551::AID-ELPS3551>3.0.CO;2-2. [DOI] [PubMed] [Google Scholar]
- 11.Bandeira N, Tsur D, Frank A, Pevzner PA. Protein identification by spectral networks analysis. Proc Natl Acad Sci. 2007;104:6140–5. doi: 10.1073/pnas.0701130104. [DOI] [PMC free article] [PubMed] [Google Scholar]
- 12.Pevzner PA, Mulyukov Z, Dancik V, Tang CL. Efficiency of database search for identification of mutated and modified proteins via mass spectrometry. Genome Res. 2001;11:290–299. doi: 10.1101/gr.154101. [DOI] [PMC free article] [PubMed] [Google Scholar]
- 13.Tsur D, Tanner S, Zandi E, Bafna V, Pevzner P. Identification of post-translational modifications via blind search of mass-spectra. Nature Biotechnology. 2005;23:1562–1567. doi: 10.1038/nbt1168. [DOI] [PubMed] [Google Scholar]
- 14.Marahiel MA, Stachelhaus T, Mootz HD. Modular peptide synthetases involved in nonribosomal peptide synthesis. Nat Prod Rep. 1997;7:2651–2674. doi: 10.1021/cr960029e. [DOI] [PubMed] [Google Scholar]
- 15.Schwarzer D, Finking MA, Marahiel R. Nonribosomal peptides: from genes to products. Nat Prod Rep. 2003;20:275–287. doi: 10.1039/b111145k. [DOI] [PubMed] [Google Scholar]
- 16.Oman TJ, van der Donk WA. Follow the leader: the use of leader peptides to guide natural product biosynthesis. Nat Prod Rep. 2010;6:9–18. doi: 10.1038/nchembio.286. [DOI] [PMC free article] [PubMed] [Google Scholar]
- 17.McIntosh JA, Donia MS, Schmidt EW. Ribosomal peptide natural products: bridging the ribosomal and nonribosomal worlds. Nat Prod Rep. 2009;26:537–59. doi: 10.1039/b714132g. [DOI] [PMC free article] [PubMed] [Google Scholar]
- 18.Stachelhaus T, Mootz HD, Marahiel MA. The specificity-conferring code of adenylation domains in nonribosomal peptide synthetases. Chem Biol. 1999;6:493–505. doi: 10.1016/S1074-5521(99)80082-9. [DOI] [PubMed] [Google Scholar]
- 19.Hill AW, Mortishire-Smith RJ. Automated assignment of high-resolution collisionally activated dissociation mass spectra using a systematic bond disconnection approach. Rapid Commun Mass Spectrom. 2005;19:3111–3118. [Google Scholar]
- 20.Halket JM, Waterman D, Przyborowska AM, Patel RKP, Fraser PD, Bramley PM. Chemical derivatization and mass spectral libraries in metabolic profiling by GC/MS and LC/MS/MS. Journal of Experimental Botany. 2005;56:219–243. doi: 10.1093/jxb/eri069. [DOI] [PubMed] [Google Scholar]
- 21.Wolf S, Schmidt S, Mller-Hannemann M, Neumann S. In silico fragmentation for computer assisted identification of metabolite mass spectra. BMC Bioinformatics. 2010;11:148. doi: 10.1186/1471-2105-11-148. [DOI] [PMC free article] [PubMed] [Google Scholar]
- 22.Ng J, Bandeira N, Liu WT, Ghassemian M, Simmons TL, Gerwick WH, Linington R, Dorrestein PC, Pevzner PA. Dereplication and de novo sequencing of nonribosomal peptides. Nat Methods. 2009;6:596–599. doi: 10.1038/nmeth.1350. [DOI] [PMC free article] [PubMed] [Google Scholar]
- 23.Ibrahim A, Yang L, Johnston C, Liu X, Ma B, Magarveya NA. Dereplicating nonribosomal peptides using an informatic search algorithm for natural products (isnap) discovery. Proc Natl Acad Sci. 2012;109:19196–19201. doi: 10.1073/pnas.1206376109. [DOI] [PMC free article] [PubMed] [Google Scholar]
- 24.Mohimani H, Kersten R, Liu WT, Wang M, Purvine SO, Wu S, Brewer HM, Pasa-Tolic L, Moore BS, Pevzner PA, Dorrestein PC. Automated genome mining of ribosomal peptide natural products. ACS chemical biology. 2014;9:1545–1551. doi: 10.1021/cb500199h. [DOI] [PMC free article] [PubMed] [Google Scholar]
- 25.Mohimani H, Liu WT, Kersten R, Moore BS, Dorrestein PC, Pevzner PA. Nrpquest: Coupling mass-spectrometry and genome mining for non ribosomal peptide discovery. Journal of natural products. 2014;77:1902–1909. doi: 10.1021/np500370c. [DOI] [PMC free article] [PubMed] [Google Scholar]
- 26.Medema MH, Paalvast Y, Nguyen DD, Melnik A, Dorrestein PC, Takano E, Bre-itling R. Pep2path: Automated mass spectrometry-guided genome mining of peptidic natural products. PLoS Comput Biol. 2014;10:e1003282. doi: 10.1371/journal.pcbi.1003822. [DOI] [PMC free article] [PubMed] [Google Scholar]
- 27.Mohimani H, Liu WT, Liang Y, Gaudenico S, Fenical W, Dorrestein PC, Pevzner P. Multiplex de novo sequencing of peptide antibiotics. J Comput Biol. 2011;18:1371–1381. doi: 10.1089/cmb.2011.0158. [DOI] [PMC free article] [PubMed] [Google Scholar]
- 28.Mohimani H, Liang Y, Liu WT, Hsieh PW, Dorrestein PC, Pevzner P. Sequencing cyclic peptides by multistage mass spectrometry. J Proteomics. 2011;11:3642–3650. doi: 10.1002/pmic.201000697. [DOI] [PMC free article] [PubMed] [Google Scholar]
- 29.Kavan D, Kuzma M, Lemr K, Schug KA, Havlicek V. Cyclone–a utility for de novo sequencing of microbial cyclic peptides. J Am Soc Mass Spectrom. 2013;24:1177–84. doi: 10.1007/s13361-013-0652-7. [DOI] [PubMed] [Google Scholar]
- 30.Arnison PG, Bibb MJ, Bierbaum G, Bowers AA, Bulaj G, Camarero JA, Campopiano DJ, Clardy J, Cotter PD, Craik DJ, Dittmann E, Donadio S, Dorrestein PC, Entian KD, Fischbach MA, Garavelli JS, Gransson U, Gruber CW, Haft DH, Hemscheidt TK, Hertweck C, Hill C, Horswill AR, Jaspars M, Kelly WL, Klinman JP, Kuipers OP, Link AJ, Liu W, Marahiel MA, Mitchell DA, Moll GL, Moore BS, Nair SK, Nes IF, Norris GE, Olivera BM, Onaka H, Patchett ML, Reaney MJT, Rebuffat S, Ross RP, Sahl HG, Schmidt EW, Selsted ME, Severinov K, Shen B, Sivonen K, Smith L, Stein T, Sssmuth RE, Tagg JR, Tang GL, Vederas JC, Walsh CT, Walton JD, Willey JM, van der Donk WA. Ribosomally synthesized and post-translationally modified peptide natural products: Overview and recommendations for a universal nomenclature. Natural product reports. 2013;30:108–160. doi: 10.1039/c2np20085f. [DOI] [PMC free article] [PubMed] [Google Scholar]
- 31.Velsquez JE, van der Donk WA. Genome mining for ribosomally synthesized natural products. Current Opinion in Chemical Biology. 2011;15:11–21. doi: 10.1016/j.cbpa.2010.10.027. [DOI] [PMC free article] [PubMed] [Google Scholar]
- 32.de Jong A, van Heel AJ, Kok J, Kuipers OP. Bagel2: mining for bacteriocins in genomic data. Nucleic Acids Res. 2010;38:W647651. doi: 10.1093/nar/gkq365. [DOI] [PMC free article] [PubMed] [Google Scholar]
- 33.Li J, Qu X, He X, Duan L, Wu G, Bi D, Deng Z, Liu W, Ou HY. Thiofinder: a web-based tool for the identification of thiopeptide gene clusters in dna sequences. PLoS One. 2012;7:e45878. doi: 10.1371/journal.pone.0045878. [DOI] [PMC free article] [PubMed] [Google Scholar]
- 34.Maksimova MO, Pelczerb I, Link JA. Precursor-centric genome-mining approach for lasso peptide discovery. Proc Natl Acad Sci. 2012;109:15223–15228. doi: 10.1073/pnas.1208978109. [DOI] [PMC free article] [PubMed] [Google Scholar]
- 35.Leikoski N, Fewer DP, Jokela J, Wahlsten M, Rouhiainen L, Sivonen K. Highly diverse cyanobactins in strains of the genus anabaena. Appl Environ Microbiol. 2010;76:701–709. doi: 10.1128/AEM.01061-09. [DOI] [PMC free article] [PubMed] [Google Scholar]
- 36.Hammami R, Zouhir A, Ben Hamida J, Fliss I. Bactibase: a new web-accessible database for bacteriocin characterization. BMC Microbiol. 2007;7:89–94. doi: 10.1186/1471-2180-7-89. [DOI] [PMC free article] [PubMed] [Google Scholar]
- 37.Starcevic A, Zucko J, Simunkovic J, Long PF, Cullum J, Hranueli D. Clustscan: an integrated program package for the semi-automatic annotation of modular biosynthetic gene clusters and in silico prediction of novel chemical structures. Nucleic Acids Res. 2008;36:6882–6892. doi: 10.1093/nar/gkn685. [DOI] [PMC free article] [PubMed] [Google Scholar]
- 38.Li MH, Ung PM, Zajkowski J, Garneau-Tsodikova S, Sherman DH. Automated genome mining for natural products. Nucleic Acids Res. 2009;10:185–194. doi: 10.1186/1471-2105-10-185. [DOI] [PMC free article] [PubMed] [Google Scholar]
- 39.Rausch C, Weber T, Kohlbacher O, Wohlleben W, Huson DH. Specificity prediction of adenylation domains in nonribosomal peptide synthetases (nrps) using transductive support vector machines (tsvms) Nucleic Acids Res. 2005;33:5799–5808. doi: 10.1093/nar/gki885. [DOI] [PMC free article] [PubMed] [Google Scholar]
- 40.Rottig M, Medema MH, Blin K, Weber T, Rausch C, Kohlbacher O. Nrpspredictor2: A web server for predicting nrps adenylation domain specificity. Nucleic Acids Res. 2011;39:W332–W367. doi: 10.1093/nar/gkr323. [DOI] [PMC free article] [PubMed] [Google Scholar]
- 41.Xu Y, Kersten R, Nam S, Lu L, Al-Suwailem A, Zheng H, Fenical W, Dorrestein P, Moore B, Qian P. Bacterial biosynthesis and maturation of the didemnin anti-cancer agents. J Am Chem Soc. 2012;134:8625–8632. doi: 10.1021/ja301735a. [DOI] [PMC free article] [PubMed] [Google Scholar]
- 42.Tang XJ, Thibault P, Boyd RK. Characterization of the tyrocidine and gramicidin fractions of the tyrothricin complex from bacillus brevis using liquid chromatography and mass spectrometry. Int J Mass Spectrom Ion Processes. 1992;122:153–179. [Google Scholar]
- 43.Pevzner PA, Dancik V, Tang CL. How nature morphs peptide scaffolds into antibiotics. J Comput Biol. 2000;7:777–787. doi: 10.1089/10665270050514927. [DOI] [PubMed] [Google Scholar]
- 44.Krauss M, Singer H, Hollender J. Lchigh resolution ms in environmental analysis: from target screening to the identification of unknowns. Analytical and bioanalytical chemistry. 2010;397:943–951. doi: 10.1007/s00216-010-3608-9. [DOI] [PubMed] [Google Scholar]
- 45.Bolton EE, Wang Y, Thiessen PA, Bryant SH. Pubchem: integrated platform of small molecules and biological activities. Anual report in computational chemistry. 2008;4:217–241. [Google Scholar]
- 46.Pence HE, Williams A. Chemspider: an online chemical information resource. Journal of Chemical Education. 2010;87:1123–1124. [Google Scholar]
- 47.Kanehisa M, Goto S, Sato Y, Furumichi M, Tanabe M. Kegg for integration and interpretation of large-scale molecular data sets. Nucleic acids research. 2012;40:109–114. doi: 10.1093/nar/gkr988. [DOI] [PMC free article] [PubMed] [Google Scholar]
- 48.Caboche S, Pupin M, Leclre V, Fontaine A, Jacques P, Kucherov G. Norine: a database of nonribosomal peptides. Nucleic Acids Res. 2008;36:D326–D331. doi: 10.1093/nar/gkm792. [DOI] [PMC free article] [PubMed] [Google Scholar]
- 49.Kim S, Gupta N, Pevzner P. Spectral probabilities and generating functions of tandem mass spectra: A strike against decoy databases. J Proteome Res. 2008;7:3354–3363. doi: 10.1021/pr8001244. [DOI] [PMC free article] [PubMed] [Google Scholar]
- 50.Mohimani H, Kim S, Pevzner PA. A new approach to evaluating statistical significance of spectral identifications. J Prot Res. 2013;12:1560–1568. doi: 10.1021/pr300453t. [DOI] [PMC free article] [PubMed] [Google Scholar]
- 51.Lam H, Deutsch EW, Eddes JS, Eng JK, King N, Stein SE, Aebersold R. Development and validation of a spectral library searching method for peptide identification from ms/ms. Proteomics. 2007;7:655–667. doi: 10.1002/pmic.200600625. [DOI] [PubMed] [Google Scholar]
- 52.Heller S. The history of the nist/epa/nih mass spectral database. Todays Chemist at Work. 1999;8:45–46. [Google Scholar]
- 53.Wishart DS, Knox C, Guo AC, Eisner R, Young N, Gautam B, Hau DD, Psychogios N, Dong E, Bouatra S, Mandal R, Sinelnikov I, Xia J, Jia L, Cruz JA, Lim E, Sobsey CA, Shrivastava S, Huang P, Liu P, Fang L, Peng J, Fradette R, Cheng D, Tzur D, Clements M, Lewis A, De Souza A, Zuniga A, Dawe M, Xiong Y, Clive D, Greiner R, Nazyrova A, Shaykhutdinov R, Li L, Vogel HJ, Forsythe I. Hmdb: a knowledgebase for the human metabolome. Nucleic Acids Res. 2009;37:D603–10. doi: 10.1093/nar/gkn810. [DOI] [PMC free article] [PubMed] [Google Scholar]
- 54.Horai H, Arita M, Kanaya S, Nihei Y, Ikeda T, Suwa K, Ojima Y, Tanaka K, Tanaka S, Aoshima K, Oda Y, Kakazu Y, Kusano M, Tohge T, Matsuda F, Sawada Y, Hirai MY, Nakanishi H, Ikeda K, Akimoto N, Maoka T, Takahashi H, Ara T, Sakurai N, Suzuki H, Shibata D, Neumann S, Iida T, Tanaka K, Funatsu K, Matsuura F, Soga T, Taguchi R, Saito K, Nishioka T. Massbank: a public repository for sharing mass spectral data for life sciences. J Mass Spectrom. 2010;45:703–14. doi: 10.1002/jms.1777. [DOI] [PubMed] [Google Scholar]
- 55.Smith CA, O'Maille G, Want EJ, Qin C, Trauger SA, Brandon TR, Custodio DE, Abagyan R, Siuzdak G. Metlin: a metabolite mass spectral database. Ther Drug Monit. 2005;6:747–51. doi: 10.1097/01.ftd.0000179845.53213.39. [DOI] [PubMed] [Google Scholar]
- 56.Ausloos P, Clifton CL, Lias SG, Mikaya AI, et al. The critical evaluation of a comprehensive mass spectral library. J Am Soc Mass Spectrom. 1999;10:287–299. doi: 10.1016/S1044-0305(98)00159-7. [DOI] [PubMed] [Google Scholar]
- 57.Stein SE, Scott DR. Optimization and testing of mass spectral library search algorithms for compound identification. J Am Soc Mass Spectrom. 1994;5:859–866. doi: 10.1016/1044-0305(94)87009-8. [DOI] [PubMed] [Google Scholar]
- 58.Domokos L, Hennberg D, Weimann B. Computer-aided identification of compounds by comparison of mass spectra. Anal Chim Acta. 1984;165:61–74. [Google Scholar]
- 59.Craig R, Cortens JC, Fenyo D, Beavis RC. Using annotated peptide mass spectrum libraries for protein identification. J Proteome Res. 2006;5:1843–1849. doi: 10.1021/pr0602085. [DOI] [PubMed] [Google Scholar]
- 60.Lam H, Aebersold R. Spectral library searching for peptide identification via tandem ms. Methods Mol Biol. 2010;604:95–103. doi: 10.1007/978-1-60761-444-9_7. [DOI] [PubMed] [Google Scholar]
- 61.Lam H, Deutsch EW, Aebersold R. Artificial decoy spectral libraries for false discovery rate estimation in spectral library searching in proteomics. J Proteome Res. 2010;9:605–610. doi: 10.1021/pr900947u. [DOI] [PubMed] [Google Scholar]
- 62.Wang M, et al. Gnps - global natural products social molecular networking. 2015 submitted. [Google Scholar]
- 63.Milman BL, Zhurkovich IK. Identification of toxic cyclopeptides based on mass spectral library matching analytical chemistry research. Analytical Chemistry Research. 2014;1:8–15. [Google Scholar]
- 64.Dancik V, Addona TA, Clauser KR, Vath JE, Pevzner PA. De novo peptide sequencing via tandem mass spectrometry. J Comput Biol. 1999;6:327–42. doi: 10.1089/106652799318300. [DOI] [PubMed] [Google Scholar]
- 65.Ma B, Zhang K, Hendrie C, Liang C, Li M, Doherty-Kirby A, Lajoie G. Peaks: powerful software for peptide de novo sequencing by tandem mass spectrometry. Rapid Commun Mass Spectrom. 2003;17:2337–42. doi: 10.1002/rcm.1196. [DOI] [PubMed] [Google Scholar]
- 66.Frank A, Pevzner P. Pepnovo: De novo peptide sequencing via probabilistic network modeling. Anal Chem. 2005;77:964–983. doi: 10.1021/ac048788h. [DOI] [PubMed] [Google Scholar]
- 67.Guthals A, Boucher C, Bandeira N. The generating function approach for peptide identification in spectral networks. J Comput Biol. 2014 doi: 10.1089/cmb.2014.0165. page in press. [DOI] [PMC free article] [PubMed] [Google Scholar]
- 68.Mohimani H, Liu WT, Mylne JS, Poth AG, Colgrave ML, Tran D, Selsted ME, Dorrestein PC, Pevzner P. Cycloquest: Identification of cyclopeptides via database search of their mass spectra against genome databases. J Prot Res. 2011;10:4505–4512. doi: 10.1021/pr200323a. [DOI] [PMC free article] [PubMed] [Google Scholar]
- 69.Frank AM, Pesavento JJ, Mizzen CA, Kelleher NL, Pevzner PA. Interpreting top-down mass spectra using spectral alignment. Genome Res. 2008;80:2499–505. doi: 10.1021/ac702324u. [DOI] [PubMed] [Google Scholar]
- 70.Kim S, Pevzner P. Ms-gf+ makes progress towards a universal database search tool for proteomics. Nature communications. 2014;5 doi: 10.1038/ncomms6277. [DOI] [PMC free article] [PubMed] [Google Scholar]
- 71.Na S, Bandeira N, Paek E. Fast multi-blind modification search through tandem mass spectrometry. Mol Cell Proteomics. 2012;11 doi: 10.1074/mcp.M111.010199. M111.010199. [DOI] [PMC free article] [PubMed] [Google Scholar]
- 72.Medema MH, Blin K, Cimermancic P, Jager V, Zakrzewski P, Fischbach MA, Weber T, Takan E, Breitling R. antismash: rapid identification, annotation and analysis of secondary metabolite biosynthesis gene clusters in bacterial and fungal genome sequences. Nucleic Acids Res. 2011;39:W339–W346. doi: 10.1093/nar/gkr466. [DOI] [PMC free article] [PubMed] [Google Scholar]