Abstract.
Damage to the inferior and fragile water and sanitation infrastructure of Haiti after Hurricane Matthew has created an urgent public health emergency in terms of likelihood of cholera occurring in the human population. Using satellite-derived data on precipitation, gridded air temperature, and hurricane path and with information on water and sanitation (WASH) infrastructure, we tracked changing environmental conditions conducive for growth of pathogenic vibrios. Based on these data, we predicted and validated the likelihood of cholera cases occurring past hurricane. The risk of cholera in the southwestern part of Haiti remained relatively high since November 2016 to the present. Findings of this study provide a contemporary process for monitoring ground conditions that can guide public health intervention to control cholera in human population by providing access to vaccines, safe WASH facilities. Assuming current social and behavioral patterns remain constant, it is recommended that WASH infrastructure should be improved and considered a priority especially before 2017 rainy season.
INTRODUCTION
Prediction of an outbreak of diarrheal disease, specifically cholera, following a natural disaster remains a challenge, especially in regions lacking safe water, sanitation, and hygiene (WASH) infrastructure. The underlying mechanism of a cholera outbreak is associated with disruption in the human access to safe WASH infrastructure that results in the population using unsafe water containing pathogenic vibrios. Previous research1–9 showed that the presence and abundance of Vibrio cholerae, the causative agent of cholera, are related to modalities of the environment and regional weather as well as the climate systems.10–12 Major cholera outbreaks occur in two dominant forms: 1) epidemic, characterized by a sudden and sporadic occurrence of a large number of cholera cases and 2) endemic, in which human cholera cases occur on annual scales with distinct and characteristic seasonality.7,11 Our dominant hypothesis for epidemic cholera is that an elevated temperature followed by heavy precipitation, in concatenation with an insufficient and damaged WASH infrastructure, places the human population at high risk of interaction with cholera bacteria and subsequently to outbreak of the disease.7,13
Natural disasters characteristically leave a trail of destruction, the result of which may be a human population deprived of access to WASH14 infrastructure. For example, under normal circumstances, the likelihood of a cholera outbreak is low, since the human population adapts to its specific behavioral pattern of water use. However, following a natural disaster, human behavior will change, if the availability, use pattern, and storage capacity of drinking water are altered as a result of the WASH infrastructure having been severely damaged and/or rendered unusable.15 Case in point, Hurricane Matthew lashed Haiti with heavy rainfall for 3 days, from October 2 to 4, 2016. The question that arises is whether the particular region hit by hurricane will be at risk for a cholera epidemic. In addition, can appropriate intervention and mitigation strategies be identified and communicated to relevant policy-makers. Forecasting a cholera outbreak is challenging because of the lack of data on pathogen abundance in local water systems, weather and climate patterns, and existing WASH infrastructure. Vibrios, including V. cholerae are autochthonous to the natural aquatic ecosystem, hence eradication is not feasible.16 Therefore, the objective of this research was to use our current hypothesis of the epidemic form of cholera to forecast probabilistic risk of the disease occurrence in Haiti after Hurricane Matthew. The utility of high spatial and temporal resolution satellite products to identify regions requiring attention of policy-makers to institute cholera mitigation strategies was also explored.
MATERIALS AND METHODS
Monthly air temperature data at spatial resolution of 2.5° × 2.5° were obtained from the National Center for Environmental Prediction. Daily precipitation data from the Global Precipitation Mission (GPM), accumulated to create a monthly dataset at 0.1° × 0.1° resolution. Long-term average precipitation was obtained using monthly data (3B43 product) from the Tropical Rainfall Measuring Mission (TRMM) at spatial resolution of 0.25° × 0.25°. The TRMM dataset was resampled to 0.1° × 0.1° to align with the GPM data. Data on track points and wind swath of Hurricane Matthew were collected from the National Hurricane Center. Administrative boundaries, roads, and river data for Haiti were obtained from the Grand Valley State University Program of Safe and Sustainable Water for Haiti (http://www.gvsu.edu/haitiwater/links-to-gis-data-for-haiti- 9.htm). Population density data (GPWv4) were acquired from the NASA Socioeconomic Data and Applications Center. Analysis was done using the R-programming language platform (v3.2.3) and ArcMap (v10.2.1) (Esri, Redlands, CA).
Spatial hydroclimatic analysis.
A theoretical pathway as proposed in our previous study11 was used to evaluate hydroclimatic control of the risk of cholera in Haiti. This pathway argues that the probability of epidemic cholera in a human population increases if the region experiences a 2 month above average air temperature, followed by 1 month of above average precipitation. These two conditions must be accompanied by damage to WASH infrastructure, further facilitating interaction of cholera bacteria with humans and thereby leading to an outbreak. We estimated monthly anomalies (defined as departure from an average condition) for both air temperature and satellite precipitation data, using the equation 1.
| (1) |
For example, to calculate air temperature anomalies for a given month (e.g., September), an average for monthly data from 1981 to 2016 was determined and subtracted from the value for the corresponding month of year 2016. The resulting positive value (anomaly) implies that the month is warmer, based on the historical mean condition and vice versa. For estimation of a precipitation anomaly for a given month, an average monthly data value was estimated using TRMM data and subtracting it from the corresponding monthly GPM value for year 2016. As was determined for air temperature, a positive precipitation anomaly implied a wetter month, compared with the historical mean condition and vice versa. These anomalies were calculated for both monthly total precipitation and monthly mean air temperature, covering all pixels over Haiti.
Composite weighted raster overlay for cholera risk mapping.
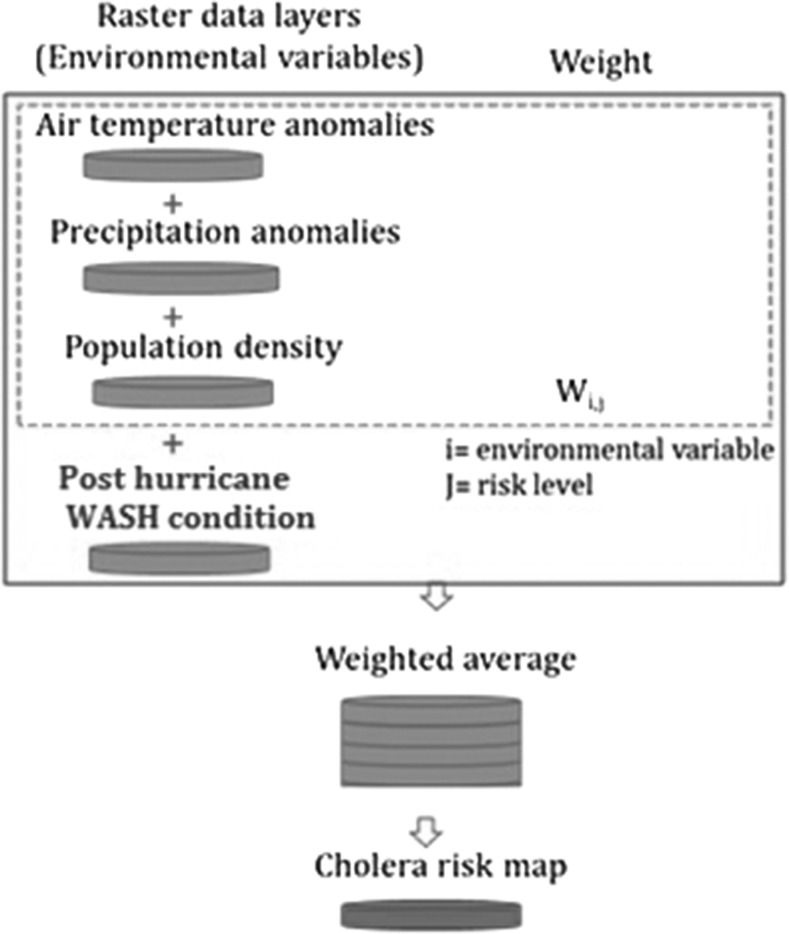
We used a weighted raster overlay (WRO) algorithm to produce a risk map for cholera, risk being defined as the probability of occurrence of cholera in a region. The WRO algorithm is a geospatial method that applies a common measurement scale of values to generate an integrated composite from several dissimilar raster layers. Figure 1 shows simplified steps to apply this algorithm to develop cholera risk maps. The algorithm begins by selecting appropriate hydroclimatic and societal variables associated with the triggering of epidemic cholera. The dataset includes precipitation and air temperature anomalies, human population parameters, and hurricane wind swath and track. Each raster layer was classified as a risk cluster and assigned an integer value based on a predefined evaluation scale (Table 1). For each variable, the maximum and minimum value of the evaluation scale represents two extreme risk conditions, for example, very high or very low risk. The intermediate values of the evaluation scale represent in between risk conditions for the variable of interest. That is, the newly generated values represent reclassification of the original raster values. Each raster layer was classified according to an evaluation scale of 0 (very low risk) to 4 (very high risk). For precipitation, an anomalous condition greater than one standard deviation (66% confidence interval based on analysis of historical data) from the mean (greater than 5 mm/day) was considered high risk for cholera and assigned a risk level value of 3. An extreme of anomalous condition (greater than 15 mm/day: six standard deviations representing 99% confidence interval) was categorized as a very high risk of cholera and was assigned the risk level value of 4. Similarly, for air temperature, an anomalous value greater than one standard deviation from the mean (greater than 1°C) was considered to be a moderately high risk of cholera and was assigned a risk level value of 2. Extremely anomalous temperature values, greater than 2°C, were considered very high risk for a cholera outbreak and were assigned a risk level value of 4. For wind swath, first 50 miles of the radius from the path of a hurricane was considered nearest in proximity, that is, “closest.” Therefore it was considered to provide the highest risk of damage to WASH infrastructure and was assigned the risk level value of 4. Similarly, inland regions located within 50–100 miles, 100–150 miles, and 150–200 miles radius were assigned the risk levels of 3, 2, and 1, respectively.
Figure 1.
Composite weighted raster overlay algorithm.
Table 1.
Risk classification for each layer
| Risk level | Precipitation anomalies (mm/day) | Temperature anomalies (°C) | Population densities (count per km2) | Wind swath of hurricane |
|---|---|---|---|---|
| Very high | 4 (> 15) | 4 (> 2) | 4 (> 1,000) | 4 (closest to track point) |
| High | 3 (> 5) | 3 (> 1) | 3 (> 500) | 3 |
| Moderate high | 2 (> 3) | 2 (> 0.5) | 2 (> 250) | 2 |
| Low | 1 (> 1) | 1 (0.25) | 1 (> 25) | 1 |
| Very Low | 0 | 0 | 0 | 0 (outside wind swath) |
Each of the reclassified variable was given equal weight and a multiplier to emphasize the relative importance of the process with respect to trigger of a cholera outbreak. All weighted and reclassified raster layers were added to create a risk composite, representing the influence of each of the variables. To estimate risk for a given region, the composite was spread across the lowest possible administrative area polygon, for example, level 3 (county scale). The mean of the pixels within a polygon was thereafter, assigned a risk value. The risk raster layer was rescaled between two values of the composite (e.g., above which the region was at very high and very low risk). The maps were then rescaled between 0 and 1, an important step for future comparison of all the regional risk maps at the same scale.
RESULTS
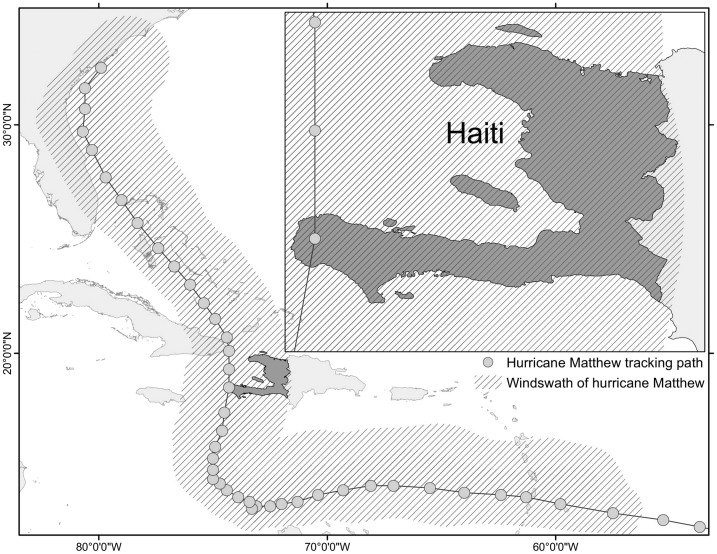
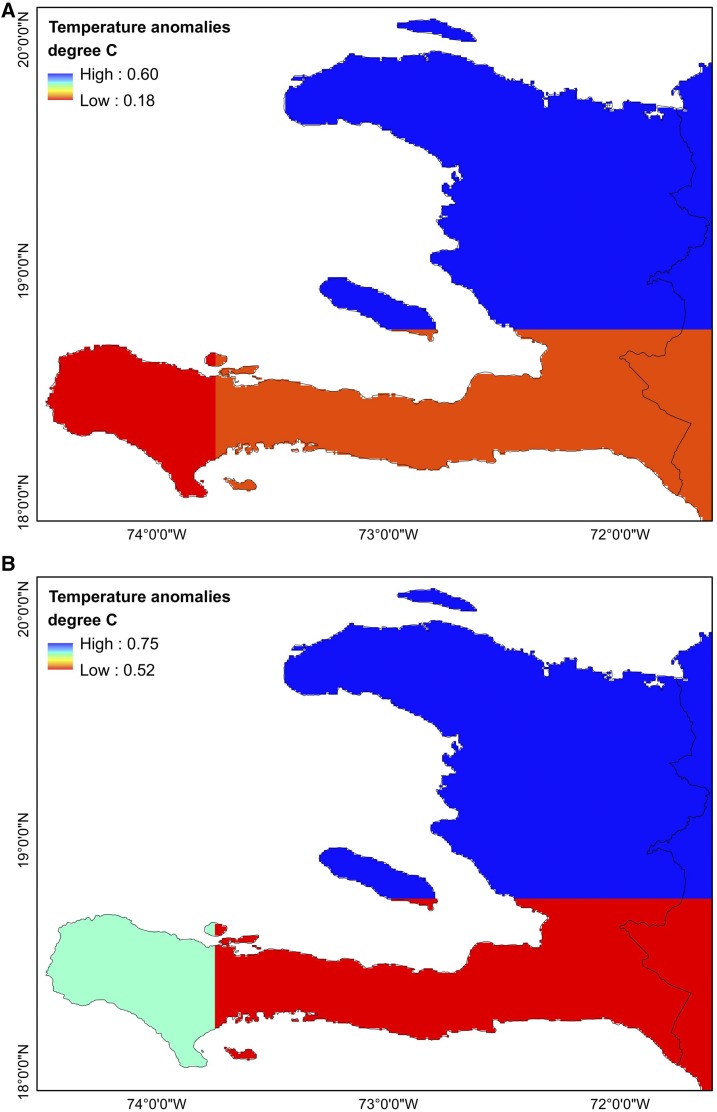
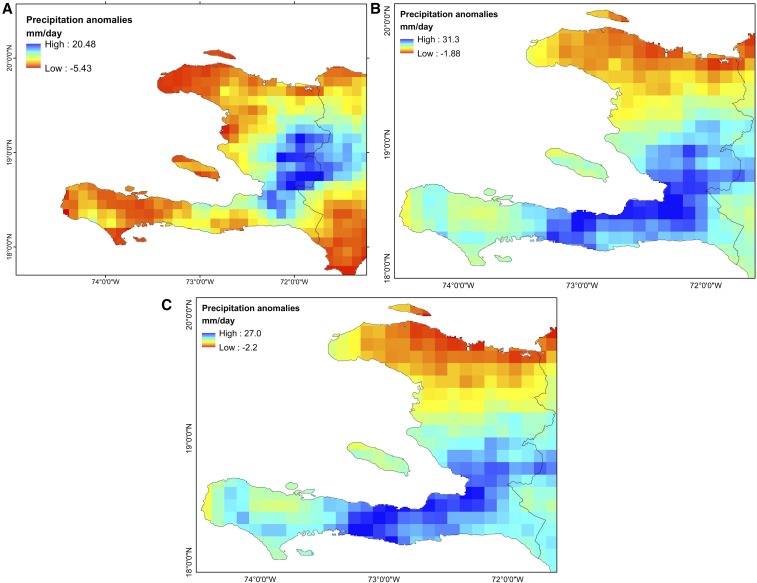
The wind swath of Hurricane Matthew covered almost the entire country of Haiti. However, the most intense precipitation occurred in the southwestern part of the region (Figure 2). Our previous hypothesis (see Jutla and others11) suggested that a period of warm temperatures, followed by heavy precipitation, would provide conditions favorable for growth of vibrios in the aquatic environment. Therefore, anomalies of air temperature were calculated. Figure 3 shows that the entire region experienced warm temperatures (positive anomalies) during the months of August (Figure 3A) and September (Figure 3B). Average temperatures for the entire country ranged between 32°C and 39°C, with the north significantly warmer than the southern part of the country. With prevailing warm temperatures, the region provided conditions optimum for growth of vibrios. Figure 4 shows anomalies for precipitation in Haiti during the months of September and October 2016. Anomalies for the entire month of September (Figure 4A) indicate, as shown by the red color, drier conditions (precipitation lower than average), whereas blue colored regions experienced wetter than the long-term average for the month of September. Most of Haiti was dry, except for the middle part of the country. Figure 4B shows the monthly anomaly from September 7 to October 6, 2016, during which time Hurricane Matthew struck the region. The northern parts of Haiti remained dry, whereas the southern parts were wetter than average for the same duration of time more than the last 17 years. A similar observation was made for the month starting from September 14 and ending on October 13, 2016 (Figure 4C).
Figure 2.
Hurricane Matthew tracking over Haiti.
Figure 3.
(A) August air temperature anomalies and (B) September air temperature anomalies. This figure appears in color at www.ajtmh.org.
Figure 4.
(A) September (1–30) precipitation anomalies, (B) (September 7–October 6) precipitation anomalies, and (C) (September 14–October 13) precipitation anomalies. This figure appears in color at www.ajtmh.org.
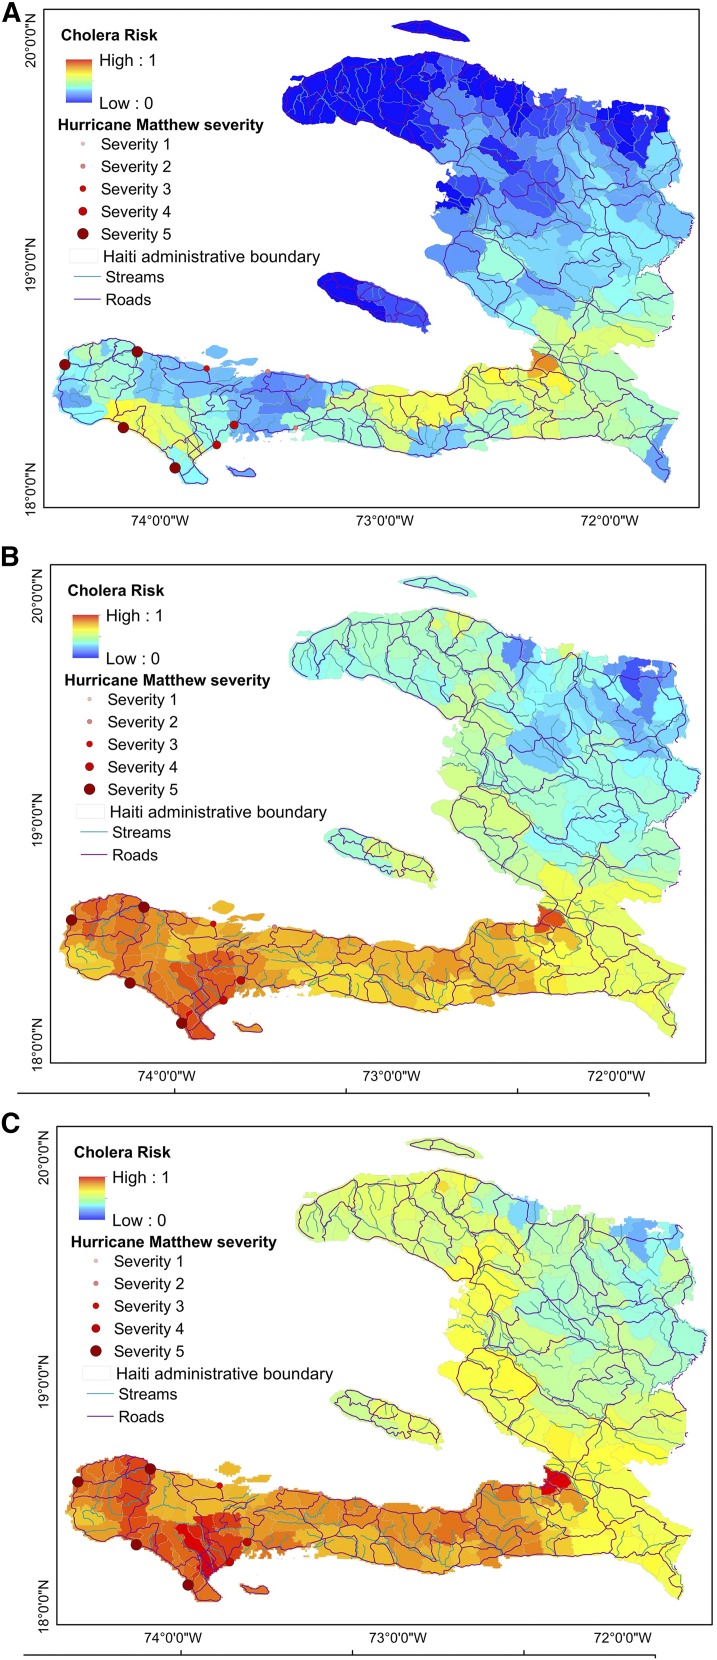
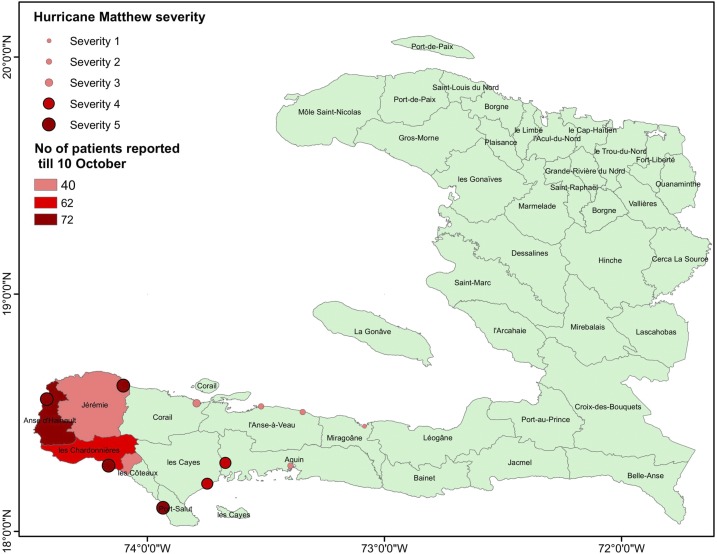
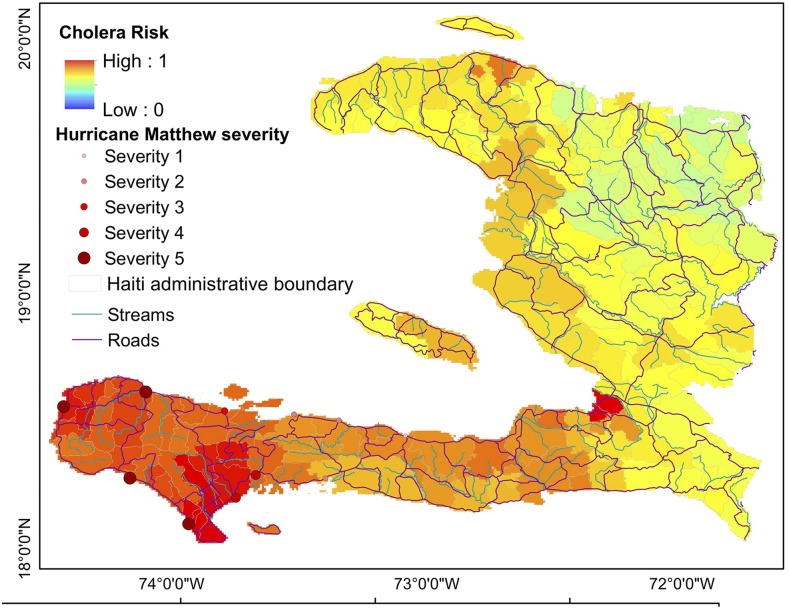
We used the WRO algorithm to develop cholera risk map for several months following the hurricane, identifying regions at risk for a cholera outbreak. A pre-hurricane scenario, using August air temperature September precipitation, and normal WASH infrastructure, showed relatively little to no risk of a significant cholera outbreak (risk value less than 0.5) for the entire country, except for some regions in the central part of country, where risk of cholera was high (Figure 5A). Using the same logic, a cholera risk map for the 1-week post-hurricane period was developed (Figure 5B), showing that the risk of cholera was very high in regions where there was heavy precipitation and high winds of the hurricane damaging an already insufficient WASH infrastructure. The expectation therefore, was that cholera cases could occur within 2–4 weeks, if the WASH infrastructure remain damaged and insufficient. Dots on the map indicate severity of the hurricane (data extracted from http://resiliencesystem.org/). Further, continuous monitoring of the region, using hydroclimatic parameters allowed production of a risk map for the month of October 14 to November 13, 2016, (Figure 5C) the interpretation of which was similar to that taken from Figure 5B. As a preliminary validation of the prediction of cholera, Figure 6 shows that cholera cases indeed, had begun to occur in the region (up to October 10), matching well with regions identified as being within high-risk cholera zones (Figure 5B). Figure 7 shows prediction of cholera for the month of November 2016, for these regions where Hurricane Matthew had struck remaining at risk of cholera, if the WASH infrastructure remained unchanged, that is, insufficient and damaged.
Figure 5.
(A) Cholera risk map based on pre-hurricane hydroclimatic conditions for the month of September 2016, (B) cholera risk map for the post-hurricane period October 7–November 06, 2016, and (C) cholera risk map for post-hurricane period October 14–November 13, 2016. This figure appears in color at www.ajtmh.org.
Figure 6.
Cholera in Haiti up to October 10, 2016. This figure appears in color at www.ajtmh.org.
Figure 7.
Predictive risk map for cholera post-hurricane period November 1–30, 2016. This figure appears in color at www.ajtmh.org.
DISCUSSION
The advantage of predicting conditions optimal for cholera to occur is an improved capability for the public health system to act in time to prevent disease outbreak, that is, to provide appropriate and timely WASH infrastructure and introduce vaccination for the most vulnerable of the population. There is overwhelming evidence that cholera bacteria are native to the aquatic environment,4,6,8,11,16–18 therefore the probability of weather and regional climatic conditions influencing exposure of human population to pathogenic vibrios in their drinking water is high if WASH conditions are insufficient and/or damaged. Cholera occurs when humans drink water containing the causative agent, V. cholerae, in sufficient concentration to cause illness.19 There are two schools of thought concerning the route of infection of cholera in human communities. One promotes the hypothesis that the trigger of cholera in the human population occurs only by introduction of infected individual(s) to an unaffected population.20,21 This hypothesis assumes that the bacteria are carried by asymptomatic human(s) capable of contaminating regional water systems, resulting in an explosive prevalence of cholera. The second school of thought divides the cholera outbreak mechanism into two distinct subroutes. The trigger of the infection is usually through interaction of human populations with the aquatic ecosystem (ponds, rivers, etc.) containing autochthonous pathogenic vibrios.1,9,11,17 Transmission of the disease occurs through human-environment-human route, where infected individuals reintroduce the bacteria to the water resource,8,22 so that new infections occur from existing water sources and also from person-to-person contacts with water, when the cases of cholera expand to an outbreak. Our previous results, based on microbiological studies,23 supported by climatic analysis of epidemic cholera in several regions of the world (Bangladesh, India, South America, and Africa), argue that a cholera epidemic is a complex process, where initial interaction of humans with contaminated water from the natural environment triggers the first step of the process, which then leads to an outbreak of disease, supported by secondary transmission routes.7,11 Results of this study strengthen the hypothesis that environmental conditions conducive to growth of cholera bacteria in the aquatic environment allow prediction of cholera. Interaction of the human population with the pathogen may occur approximately 1 month in advance of an outbreak. Satellite based estimates of precipitation and gridded air temperature data analysis suggest that Haiti is at continued high risk of cholera (Figure 6). A few cholera cases have already begun to occur in the southwestern part of Haiti, validating prediction of cholera in that region based on a Haiti Ministry of Public Health and Population” data (http://mspp.gouv.ht/site/downloads/Texte%20cholera%2010%20octobre%202016%202.pdf).
With respect to public health policy, the vulnerable human population of Haiti should be provided with safe drinking water and adequate sanitation facilities. Therefore, the probability of weather and regional climatic conditions enhancing exposure of the population to pathogenic vibrios in the water used as a source of drinking water is high if WASH conditions are insignificant and/or damaged. If there had been strong emphasis on providing WASH infrastructure as a short-term relief to the communities, it would have had a markedly preventative effect following initiation of the cholera epidemic in Haiti during October 2010. In the current scenario, Hurricane Matthew lashed Haiti in October of 2016, and climatic conditions were again favorable for cholera bacteria to become abundant in the aquatic environment, with the greater likelihood of exposure of the population to the disease since both water and sanitation were insufficient. However, as the risk of cholera lessens in the coming months, a sustained effort to rebuild the WASH infrastructure should be undertaken before cholera occurs, especially during the rainy season in 2017 and thereafter.
Although results of our prediction algorithm are promising, some limitations remain, normally the coarse grid representation of the data for air temperature and some latency in availability of precipitation dataset from the GPM. These limitations do not impact the algorithm directly since contextual interpretation of pixels is used in the analysis. Lack of field data collection protocols to test for vibrios in the aquatic environment immediately after a natural disaster remain an impediment. Water resources (ponds, rivers, etc.) should be monitored immediately after a natural disaster in regions of the world where there is insufficient WASH infrastructure. Finally, satellites provide a valuable proxy channel for the development and validation of heuristic prediction algorithms.
Acknowledgments:
This research is funded from a NASA grant (NNX15AF71G).
REFERENCES
- 1.Alam M, et al. , 2006. Seasonal cholera caused by Vibrio cholerae serogroups O1 and O139 in the coastal aquatic environment of Bangladesh. Appl Environ Microbiol 72: 4096–4104. [DOI] [PMC free article] [PubMed] [Google Scholar]
- 2.Ali M, Emch M, Donnay JP, Yunus M, Sack RB, 2002. Identifying environmental risk factors for endemic cholera: a raster GIS approach. Health Place 8: 201–210. [DOI] [PubMed] [Google Scholar]
- 3.Cash BA, Rodó X, Emch M, Yunus M, Faruque ASG, Pascual M, 2014. Cholera and shigellosis: different epidemiology but similar responses to climate variability. PLoS One 9: e107223. [DOI] [PMC free article] [PubMed] [Google Scholar]
- 4.Faruque SM, Naser IB, Islam MJ, Faruque ASG, Ghosh AN, Nair GB, Sack DA, Mekalanos JJ, 2005. Seasonal epidemics of cholera inversely correlate with the prevalence of environmental cholera phages. Proc Natl Acad Sci USA 102: 1702–1707. [DOI] [PMC free article] [PubMed] [Google Scholar]
- 5.Hashizume M, Wagatsuma Y, Hayashi T, Saha SK, Streatfield K, Yunus M, 2009. The effect of temperature on mortality in rural Bangladesh–a population-based time-series study. Int J Epidemiol 38: 1689–1697. [DOI] [PubMed] [Google Scholar]
- 6.Huq A, et al. , 2005. Critical factors influencing the occurrence of Vibrio cholerae in the environment of Bangladesh. Appl Environ Microbiol 71: 4645–4654. [DOI] [PMC free article] [PubMed] [Google Scholar]
- 7.Jutla A, Aldaach H, Akanda AS, Huq A, Colwell RR, 2015. Satellite based assessment of hydroclimatic conditions related to cholera in Zimbabwe. PLoS One 10: e0137828. [DOI] [PMC free article] [PubMed] [Google Scholar]
- 8.Rinaldo A, Rigon R, Banavar JR, Maritan A, Rodriguez-Iturbe I, 2014. Evolution and selection of river networks: statics, dynamics, and complexity. Proc Natl Acad Sci USA 111: 2417–2424. [DOI] [PMC free article] [PubMed] [Google Scholar]
- 9.Singleton FL, Attwell RW, Jangi MS, Colwell RR, 1982. Influence of salinity and organic nutrient concentration on survival and growth of Vibrio cholerae in aquatic microcosms. Appl Environ Microbiol 43: 1080–1085. [DOI] [PMC free article] [PubMed] [Google Scholar]
- 10.Pascual M, 2000. Cholera dynamics and El Nino-southern oscillation. Science 289: 1766–1769. [DOI] [PubMed] [Google Scholar]
- 11.Jutla A, Whitcombe E, Hasan N, Haley B, Akanda A, Huq A, Alam M, Sack RB, Colwell R, 2013. Environmental factors influencing epidemic cholera. Am J Trop Med Hyg 89: 597–607. [DOI] [PMC free article] [PubMed] [Google Scholar]
- 12.Finger F, Knox A, Bertuzzo E, Mari L, Bompangue D, Gatto M, Rodriguez-Iturbe I, Rinaldo A, 2014. Cholera in the Lake Kivu region (DRC): integrating remote sensing and spatially explicit epidemiological modeling. Water Resour Res 50: 5624–5637. [Google Scholar]
- 13.Akanda AS, Jutla AS, Gute DM, Sack RB, Alam M, Huq A, Colwell RR, Islam S, 2013. Population vulnerability to biannual cholera outbreaks and associated macro-scale drivers in the Bengal Delta. Am J Trop Med Hyg 89: 950–959. [DOI] [PMC free article] [PubMed] [Google Scholar]
- 14.Bartlett JG, 2008. Infectious diseases associated with natural disasters. The Social Ecology of Infectious Diseases. Elsevier, 351–377. Available at: http://linkinghub.elsevier.com/retrieve/pii/B9780123704665500182. Accessed March 16, 2016.
- 15.Watson JT, Gayer M, Connolly MA, 2007. Epidemics after natural disasters. Emerg Infect Dis 13: 1–5. [DOI] [PMC free article] [PubMed] [Google Scholar]
- 16.Colwell RR, 1996. Global climate and infectious disease: the cholera paradigm. Science 274: 2025–2031. [DOI] [PubMed] [Google Scholar]
- 17.Huq A, Small EB, West PA, Huq MI, Rahman R, Colwell RR, 1983. Ecological relationships between Vibrio cholerae and planktonic crustacean copepods. Appl Environ Microbiol 45: 275–283. [DOI] [PMC free article] [PubMed] [Google Scholar]
- 18.Koelle K, Rodó X, Pascual M, Yunus M, Mostafa G, 2005. Refractory periods and climate forcing in cholera dynamics. Nature 436: 696–700. [DOI] [PubMed] [Google Scholar]
- 19.Bartram J, 2008. Flowing away: water and health opportunities. Bull World Health Organ 86: 2. [DOI] [PMC free article] [PubMed] [Google Scholar]
- 20.Eppinger M, et al. , 2014. Genomic epidemiology of the Haitian cholera outbreak: a single introduction followed by rapid, extensive, and continued spread characterized the onset of the epidemic. MBio 5: e01721. [DOI] [PMC free article] [PubMed] [Google Scholar]
- 21.Frerichs RR, Keim PS, Barrais R, Piarroux R, 2012. Nepalese origin of cholera epidemic in Haiti. Clin Microbiol Infect 18: E158–E163. [DOI] [PubMed] [Google Scholar]
- 22.Codeco CT, Lele S, Pascual M, Bouma M, Ko AI, 2008. A stochastic model for ecological systems with strong nonlinear response to environmental drivers: application to two water-borne diseases. J R Soc Interface 5: 247–252. [DOI] [PMC free article] [PubMed] [Google Scholar]
- 23.Hasan NA, et al. , 2012. Genomic diversity of 2010 Haitian cholera outbreak strains. Proc Natl Acad Sci USA 109: E2010–E2017. [DOI] [PMC free article] [PubMed] [Google Scholar]


