Abstract
Visualization of anatomy in real time is of critical importance for motion management in lung cancer radiotherapy. To achieve real-time, and high-contrast in-treatment imaging, we propose a novel scheme based on the measurement of Compton scatter photons. In our method, a slit x-ray beam along the superior-inferior (SI) direction is directed to the patient, (intersecting the lung region at a 2D plane) containing most of the tumor motion trajectory. X-ray photons are scattered off this plane primarily due to the Compton interaction. An imager with a pinhole or a slat collimator is placed at one side of the plane to capture the scattered photons. The resulting image, after correcting for incoming fluence inhomogeneity, x-ray attenuation, scatter angle variation, and outgoing beam geometry, represents the linear attenuation coefficient of Compton scattering. This allows the visualization of the anatomy on this plane. We performed Monte Carlo (MC) simulation studies both on a phantom and a patient for proof-of-principle purposes. In the phantom case, small tumor-like structure could be clearly visualized. The contrast-resolution calculated using tumor/lung as foreground/background for kV fluoroscopy, cone-beam CT (CBCT), and scattering image were 0.037, 0.70, and 0.54, respectively. In the patient case, tumor motion could be clearly observed in the scatter images. Imaging dose to the voxels directly exposed by the slit beam was ~0.4 times of that under a single CBCT projection. These studies demonstrated the potential of the proposed imaging scheme to capture the instantaneous anatomy of a patient on a 2D plane with a high image contrast. Clear visualization of the tumor motion may facilitate marker-less tumor tracking.
1. Introduction
Motion management is an important component of image guided radiotherapy (IGRT) for treatment accuracy and planning margin reduction in lung cancer (Keall et al., 2006). Over the years, time-resolved imaging modalities have been developed and clinically employed to visualize time-dependent anatomy. For instance, 4D-CT is routinely used for treatment planning (Low et al., 2003; Pan et al., 2004; Keall et al., 2004), and 4D cone beam CT (CBCT) is increasingly being employed to aid pre-treatment patient positioning (Sonke et al., 2005; Kriminski et al., 2005; Li et al., 2006; Dietrich et al., 2006; Purdie et al., 2006; Lu et al., 2007; Leng et al., 2008; Bergner et al., 2009; Jia et al., 2012a; Wang and Gu, 2013; Park et al., 2013; Yan et al., 2014; Zheng et al., 2011). Nonetheless, due to possible variations in patient motion patterns from the treatment planning stage to the actual treatment delivery stage (Zhao et al., 2011), it is still necessary to develop in-treatment imaging methods to obtain real-time anatomy information. Here, the term “real-time” has two meanings. First, the imaging modality should deliver anatomy information with a high temporal resolution. Second, the image should be immediately available, or shortly delayed, as to reflect instantaneous anatomy.
Currently employed methods for in-treatment motion monitoring can be generally categorized as follows. Methods in the first category rely on implanted fiducial markers that are easily visible on kV or MV x-ray projection images (Shirato et al., 2000; Shimizu et al., 2001; Sharp et al., 2004; Jiang, 2006). These methods, however, are less preferred clinically due to the invasiveness of the procedure with potential risk of pneumothorax (Arslan et al., 2002; Kothary et al., 2009). Marker migration is also a concern (Kitamura et al., 2002; Nelson et al., 2007) as it may hinder tracking accuracy and effectiveness. In particle therapy, implanted metallic markers may not be acceptable. These markers could impair dose distribution due to the sensitivity of dose to material on the beam paths in these treatment modalities (Giebeler et al.; Cheung et al., 2010).
In-treatment marker-less motion monitoring is another category. One widely used approach is to monitor the motion of anatomical surrogates, such as surface markers or diaphragm position (Ford et al., 2002; Vedam et al., 2003). These methods may still present poor correlation between the surrogate and tumor motion (Ahn et al., 2004; Hoisak et al., 2004; Tsunashima et al., 2004; Yan et al., 2006). Projection based imaging methods are another subcategory of marker-less motion monitoring and include kV fluoroscopy and MV Beam Eye View (BEV) images (Berbeco et al., 2004; Jiang, 2004; Berbeco et al., 2005; Cho et al., 2009; Lin et al., 2009; Rottmann et al., 2010; Yang et al., 2012; Rottmann et al., 2013; Yan et al., 2013; Zhang et al., 2014). However, the projection nature of these approaches superimposes 3D anatomy on a 2D plane. This inherently limits image contrast and visibility of the target, especially when the tumor moves behind a high intensity structure, e.g. bone. Novel methods have recently been proposed in combination with a lung motion model to derive the volumetric image corresponding to a single x-ray projection via 2D-3D registration techniques (Li et al., 2010; Li et al., 2011) or machine learning techniques (Xu et al., 2015; Zhao et al., 2014). Robustness of these systems is still a concern for routine application. In addition, all projection methods are associated with the imaging radiation dose exposed to patient. For example, the dose of kV ouroscopic imaging to the skin surface can be significant during tumor tracking (Shirato et al., 2004).
In this paper, we will propose a method for real-time imaging of patient anatomy on a 2D plane by measuring scattered x-ray photons. This system can directly visualize patient anatomy in a time-resolved manner with a high image contrast. We also report a set of proof-of-principle studies to demonstrate its potential feasibility.
2. Materials and Methods
2.1 System design
2.1.1 Compton scattering imaging
When an x-ray travels in medium, it is scattered by Compton and Rayleigh interactions. The Compton interaction is the dominant type in the diagnostic x-ray energy range with effective energies of 60–80keV, occupying over 90% of the events (Glover, 1982). While the Rayleigh interaction scatters photons primarily in the forward direction, the Compton interaction scatters them more homogeneously in all directions. The scattering angle distribution is governed by the Klein-Nishina (KN) formula (Klein and Nishina, 1929). If we place an imaging detector outside the object not directly opposite the x-ray source, as illustrated in Figure 1, the acquired scattered photons mainly derive from the Compton interaction channel, in spite of certain amount from Rayleigh and multiple scattering events. These scattered photons carry information from the object, which in principle can be used for imaging purposes.
Figure 1.
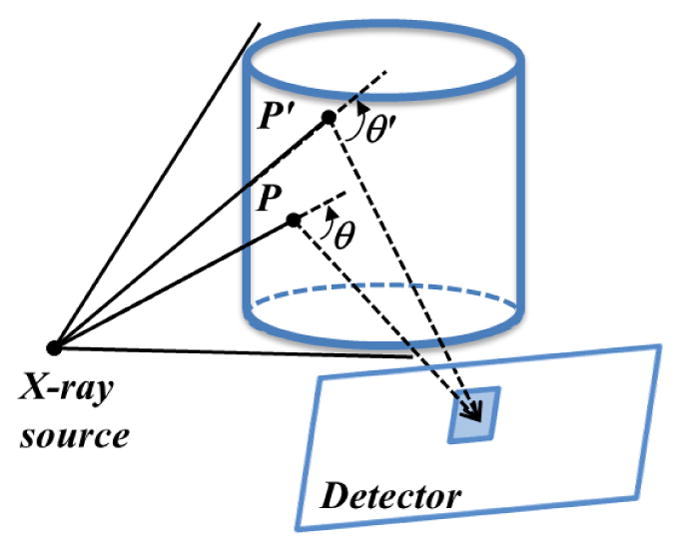
Compton scattering imaging. X-ray photons are scattered in the object and detected at the imager. A detector pixel detects scattered photons from all the illuminated voxels, e.g. P and P′.
A detector pixel captures scattered photons from all voxels illuminated by the x-ray source, as illustrated in Figure 1. The information from the entire object is hence blended, making it difficult to decode the anatomy information. Therefore, reducing the degree of information mixing is the major challenge for effective use of the captured photons as an imaging modality. For instance, energy discrimination using photon-counting detection technology was proposed to selectively acquire photons with a specific energy (Truong and Nguyen, 2012). These scattered photons can only come from subset voxels of the entire volume due to geometry constraints associated with energy selection. It was hence possible to develop a back-projection type reconstruction algorithm to retrieve the volumetric image. In this paper, we propose the use of mechanical collimation to reduce information mixing, as presented in the next section.
2.1.2 Tumor tracking using Compton scattering imaging: proposed scheme
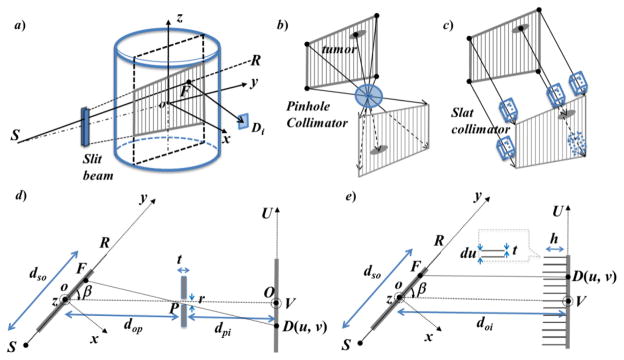
For tumor-tracking purposes, visualization of the coronal/sagittal plane containing most of the tumor motion trajectory is usually sufficient (Seppenwoolde et al., 2002). We propose to use a slit to collimate an incoming x-ray beam in a fan-beam form along the patient superior-inferior direction. Under this configuration, photons are only scattered off a plane defined by the x-ray beam and carry anatomy information on the same plane, as shown by the shaded area in Figure 2a). To further impose correspondence between the signal detected by a pixel and a voxel, we used a geometry collimation system in front of the detector. Two types of collimators, namely a pinhole collimator or a slat collimator, can be employed as illustrated in Figure 2b) and c), respectively. This design enables a one-to-one correspondence between each imager pixel and a voxel on the incoming x-ray plane.
Figure 2.
a) The proposed tumor tracking scheme using Compton scattering imaging using b) pinhole collimation or c) slat collimation. d–e) An illustration of the system geometry viewed from the patient superior direction.
Figure 2d) and e) illustrate the configuration of the pinhole design and the slat collimation design in detail. In both cases, the imager is placed at a direction with an angle β from the incoming fan beam. dso is the source (S)-to-isocenter (o) distance. In Figure 2d), dop and dpi are the isocenter-to-pinhole (P) distance and the pinhole-to-imager (O) distance, respectively. The thickness and the diameter of the pinhole are t and r, respectively. With this pinhole collimation, each pixel D on the imager plane has a unique corresponding voxel F, so that voxel F, pixel D and pinhole P are on a straight line. In Figure 2e), doi is the isocenter-to-imager distance. The height of the 2D slat grids is h and the thickness of the septa is t. Similarly, geometry collimation defines a correspondence between each detector pixel D and the voxel F that is right in front of it.
With this design, the signal for the first-order Compton scattered photon at a pixel D can be approximately expressed as
| (1) |
where the two exponential functions are x-ray attenuations along the incoming and the outgoing ray lines. μ and μC are x-ray total and Compton linear attenuation coefficient, respectively. is the KN differential cross section at the voxel F evaluated at an angle formed by the line SF and FD. f(F) is the incoming x-ray fluence intensity towards voxel F, and G(F) is a geometry factor for the outgoing x-ray due to the converging/diverging beam in the pinhole case.
We can derive the image μC(F) from this equation after dividing the measurement g(D) by the known f(F), G(F) and , as well as the two exponential terms. The exponential terms can be computed based on the patient’s CT image that is typically available in radiotherapy. Note that the detector pixel D is a function of the voxel location F due to the geometry constraint imposed by the collimation system. We denote this as D(F) without explicitly writing out the complete function form for simplicity. In this approach, the 2D image μC (F) represents the anatomy in the x-ray plane. The mechanical collimation imposes a one-to-one correspondence between a voxel in the imaged plane and a detector pixel. The conversion from the measurement g(D) to the image μC(F) is computationally straightforward. Hence, this method may potentially allow visualization of the instantaneous anatomy in the plane of interest. We would also like to point out that deriving μC(F) from Eq. (1) is an approximation, as it omitted many realistic factors such as multiple scattering and polychromatic spectrum of the beam. The acceptable experimental results demonstrated the validity of our approximation.
2.2 Image correction
In this section, we present more details on computing four correction terms that convert the measurement g(D) to the actual image μC(F). Correction terms are termed as fluence and geometry correction (C1), incoming beam attenuation correction (C2), scattering angle correction (C3), and outgoing beam attenuation correction (C4).
2.2.1 Fluence and geometry correction
The correction term C1(F) = f(F)G(F) is a 2D function of the voxel location F defined on the plane of interest. First, the incoming x-ray photon fluence may not be homogeneous. The term f(F) is simply the x-ray intensity along the direction from the source to voxel F. For the outgoing beam, the geometrically converging/diverging form in the pinhole design allows each detector pixel D to receive photons scattered from a particular region on the plane of interest. G(F) is proportional to the region size. This factor is , where δ is the angle between the normal vector of the x-ray plane and the line FD. Derivation of this formula can be found in the Appendix. In the case of parallel slat collimation, geometry correction factor G(F) =1, as all the detector pixels receive photons from regions of the same size.
Once the correction function C1(F) is computed for each voxel F, we can apply this factor by dividing the measured image g(D(F)) by C1(F) voxel wise.
2.2.2 Scattering angle correction
Let θ be the Compton scattering angle at voxel F. According to KN (Klein and Nishina, 1929), the differential cross section is expressed as , with P being the ratio of photon energy after and before the scatter event, . E is the incoming photon energy and mec2 =511 keV is the rest energy of an electron. We computed the term and applied it to the measurement g(D(F)). Note that the incoming beam is poly-energetic. We used its mean energy in this calculation step as an approximation. So are in the next two attenuation correction terms.
2.2.3 Incoming and outgoing attenuation correction
Incoming and outgoing attenuation terms are expressed as and , respectively. The line integrals in the exponential functions can be simply performed using a ray-tracing algorithm, e.g. Siddon’s algorithm (Siddon, 1985), along corresponding paths through the volumetric image of the x-ray total attenuation coefficient. The total attenuation coefficient μ(x) is obtained from the CT image according to the definition of CT number, i.e. , where μw is the linear attenuation coefficient for water and HU is the Hounsfield number of the CT image.
2.3 Simulation studies
We performed several proof-of-concept Monte Carlo (MC) simulation studies to evaluate the feasibility of the proposed x-ray scatter imaging method. All computations were conducted using a toolkit developed in-house for photon transport MC simulation on a graphics processing unit (GPU) platform (Jia et al., 2012b). The simulation considered all possible interactions including photoelectrical, Rayleigh, Compton and multiple-scattering events. In all cases, an imager size of 40 × 30 cm2 with a resolution of 512 × 384 pixels was used. We set |dop| + |dpi| = |doi| =50 cm and |ds| =100 cm to mimic a typical setup of an On-Board-Imaging system on a Varian linear accelerator (Varian Medical System, Palo Alto, CA). In each case, a point x-ray source was used. The incoming x-ray beam was collimated to a size of 0.2 × 20 cm2 at the isocenter, with 20 cm along the superior-inferior (SI) direction. A polyenergetic x-ray spectrum of 120 kVp was used. An ideal detector response was assumed which captured all the photons hitting on it. The number of source photon histories was 5 × 10¹¹ unless stated otherwise.
We designed a digital cylinder phantom composed of an outer shell with 0 HU. The height, diameter and shell thickness of the cylinder were 19.2 cm, 18 cm and 1.5 cm, respectively. The cylinder was filled with lung material of -700 HU. Three small cylinder shape “tumor” objects with tissue material of 50 HU were placed in the central region of the cylinder. The diameter and height of these three cylinders were 0.6 cm. The distance between centers of every two neighboring small cylinders was 1.8 cm. The phantom is illustrated in Figure 3a).
Figure 3.
Phantoms used in our simulation studies. (a) A digital cylindrical phantom and (b) a phantom created with a patient CT. For each phantom, the left subfigure is a 3D rendering and the right one shows cross section images.
As an initial test, was used to demonstrate the feasibility of deriving the 2D cross sectional images of interest from measured scattering photons. For the pinhole setup, |dop| and |dpi| were set as 20 cm and 30 cm, respectively. We reduced its diameter r from 1.5 cm to 0.3 cm to test spatial resolution (SR). We chose 0.3 cm as the minimal value, because it corresponds to a 0.5 cm SR, as quantified by Full Width at Half Maximum (FWHM) ( (Zeng, 2007)). This may be considered sufficient, because lung tumor size typically ranges from 0.5 cm to 5 cm according to the population statistical report (Swensen et al., 2005). The thickness t =0.2 cm was used and we assumed that the scattered photon could only pass through the pinhole to reach the detector. For slat geometry, 2D septa with t =0.01 cm were used. We then increased the septa height h from 2 cm to 10 cm. Similarly to the pinhole case, the height of 10 cm corresponds to a SR of about 0.5 cm ( (Halama, 2003), where du is the pixel size). The purpose of these steps was to investigate the image quality as a function of the pinhole size r or the septa height h and determine the appropriate values in each context.
We also used the same MC simulation tool to generate x-ray projection images in a typical CBCT scan and reconstructed a 3D CBCT image with the conventional FDK algorithm (Feldkamp et al., 1984). The CBCT image was used to generate incoming and outgoing beam attenuation correction (C2 and C4). After applying all the correction factors, we evaluated “tumor” visibility by two metrics. One is contrast-resolution (CR) defined as , where A represents the average of image intensity value over the corresponding regions of interest. fF and fB are the small tumors (foreground) and the nearby lung (background), respectively. Another metrics we used for the evaluation is contrast-noise-ratio (CNR) defined as , where S represents standard deviation.
In the second test, we used a digital phantom created with a 4D-CT scan of a lung cancer patient, as shown in Figure 3b). The 4D-CT had 10 phases over a respiratory cycle. The size of the slit x-ray beam was 0.2 × 6.78 cm2 at the isocenter. Compared to the previous case, the beam coverage along the SI direction was reduced but still large enough to cover the tumor motion range. |dop| and |dpi| were set to 30 cm and 20 cm, respectively, to place the pinhole collimator far from the patient to avoid collision with the body. All other setups were the same as in the previous experiment.
In addition, we also conducted MC dose calculations using our GPU toolkit (Jia et al., 2012c) to evaluate the imaging dose. In particular, we compared three scenarios. The first scenario was a single CBCT x-ray projection from the posterior-anterior direction with an illumination field of 26.7 × 20.0 cm2 at the isocenter, corresponding to a typical CBCT flat panel of 40 × 30 cm2. The second scenario was a collimated x-ray projection only covering a square region of 6.78 × 6.78 cm2 at the isocenter. The purpose for this small field was to compare it with the third scenario, i.e. the proposed slit beam setup with a field size of 0.2 × 6.78 cm2. In these cases, the x-ray tube mAs was set to be the same for fair comparison.
3. Results
3.1 Spatial resolution vs. collimator parameters
Figure 4 shows raw images acquired at the detector corresponding to different configurations. Photon numbers were set to 5 × 10¹¹ in each case. The images generally show higher intensity on the left hand side, corresponding to the direction where the x-ray entered the object. In terms of pinhole geometry, when the diameter was large, i.e., r =1.5 cm, the SR of the image was low, causing tumors to be blurred and not easily distinguished from the background (Figure 4a-1). As the pinhole diameter was reduced, the SR and tumor visibility got improved. At the same time, since the small pinhole reduced the number of photons reaching the detector, the overall image intensity was lowered. As predicted by the aforementioned SR calculation, we found that the 0.3 cm diameter of the pinhole yielded a sufficient SR for tumor delineation. A similar phenomenon was observed in the slat collimator design. With a slat height of 10.0 cm, tumors were well delineated. In contrast, they were blurred with a slat height of 5 cm or less. In addition, when comparing c-1) and c-2), it was observed that slat collimation led to an image with a slightly higher intensity, indicating that more photons reached the detector. Our results are consistent with a previous theoretical study (Zeng, 2007).
Figure 4.
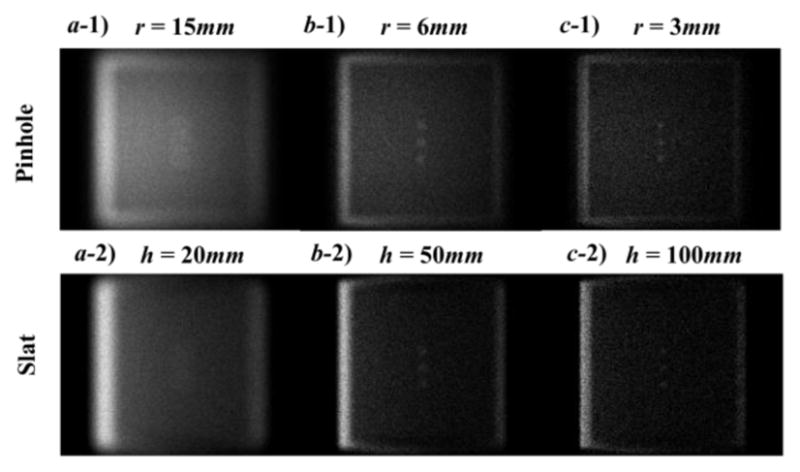
Top: raw images under the pinhole geometry with different diameters of 15 mm (a-1), 6mm (b-1) and 3mm(c-1). Bottom: raw images under the slat geometry with different heights of 20 mm (a-2), 50 mm (b-2) and 100 mm (c-2).
3.2 Image correction
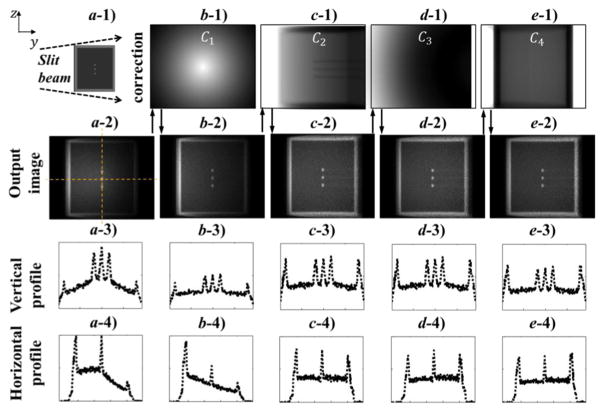
The method described in Section 2.2 allowed us to obtain an image showing the Compton scattering attenuation coefficient μC on the plane of an incoming x-ray beam. Figure 5 shows correction factors for the pinhole setup, as well as intermediate results obtained with the application of those factors.
Figure 5.
Image corrections. a-1) Illustration of illumination geometry. b-1)-e-1) Images of different correction factors. a-2)-e-2) Images during the stage of applying these correction factors. a-3)-e-3) and a-4)-e-4) are image intensity profiles along the dashed lines in a-2) during the image correction steps.
First, the raw image had relatively higher intensities in the central region along the vertical direction due to the inhomogeneous incoming photon fluence (higher in the middle). The inhomogeneity along the horizontal direction was caused by the combination of incoming beam attenuation and focusing/diverging geometry for the outgoing x-ray beam. After applying the correction factor C1, the image intensity became more homogeneous along the vertical direction. Second, along the horizontal direction, the intensity showed a general decaying trend mainly ascribed to beam attenuation. The factor for beam attenuation C2 addressed this horizontal inhomogeneity. After applying these two corrections, there was still slight horizontal inhomogeneity, as indicated by a lower right peak height on the horizontal profile as compared to the left. The third factor C3 corrected this horizontal inhomogeneity by considering different Compton scatter differential cross sections at different locations of the image. Last, outgoing ray lines for pixels at the peripheral regions were further attenuated due to longer travel distance. The last factor C4 amplified image intensity in the peripheral region relative to the central region, as evidenced by comparing peak height at the image periphery before and after the correction. The results for the slat collimation geometry were similar to the pinhole geometry (data not shown).
3.3 Contrast comparison
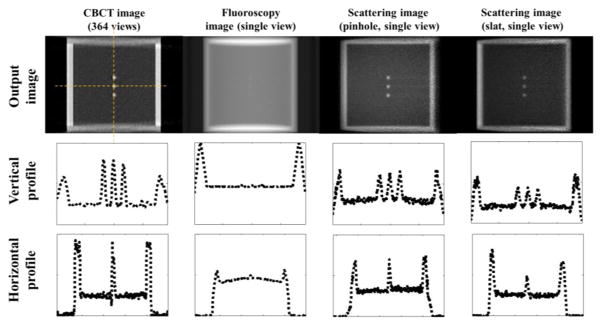
Figure 6 presents a side-by-side comparison among CBCT, fluoroscopy and scattering imaging. CBCT was reconstructed from 364 x-ray projection images simulated with our MC tool. The CR for the CBCT, fluoroscopic image, and scattering image with pinhole were 0.7, 0.037, 0.54, respectively. CR of the fluoroscopy image was significantly lower than other images due to its x-ray projection nature. It was challenging to visualize the ‘tumor’ even for the simplest phantom in our study, as evidenced by the very small peaks in the middle region of the image profiles. CBCT offered superior image contrast because of its volumetric imaging capability. In the sagittal view, tumors (~50HU) stood out clearly from the lung background (~ −700HU). However, since CBCT reconstruction requires multiple projections measured at different view angles it cannot be used for real time imaging. In comparison, the proposed scattering image attained a high CR.
Figure 6.
Comparison among different imaging modalities. Columns from left to right: CBCT, radiographic projection, and the proposed scattering imaging in two different setups. Each image is normalized to [0, 1] and the displaying window is [0.05, 1]. Rows from top to bottom: the reconstructed images, vertical and horizontal profiles.
Since display window can be adjusted to visualize low contrast objects, CNR is another important quantity to justify visibility. When using the same photon number to simulate a projection and a scatter image, it was found that the CNR for the three cases were 67, 45, and 3.8. The CNR for the scattering image was significantly lower than the other two due to the much less number of photons reaching the detector. However, the advantage of our method is to get a cross-sectional image. This makes the targeted object clearly standing out from the background. In contrast, a fluoroscopic image projects 3D object to a 2D plane and reduces the contrast. The CNR study may actually favor the fluoroscopic image, as the small objects in this phantom were placed in a homogeneous and low-density background. In reality, a human body is much more complicated than this simple phantom, and many other structures could be in line with the tumor along the beam direction. Hence, the CNR for a real patient case is expected to be substantially lower than in this ideal case. However, the CNR for the scatter imaging in the patient case may be less affected by the anatomy complexity.
3.4 Scattering images in a simulated patient case
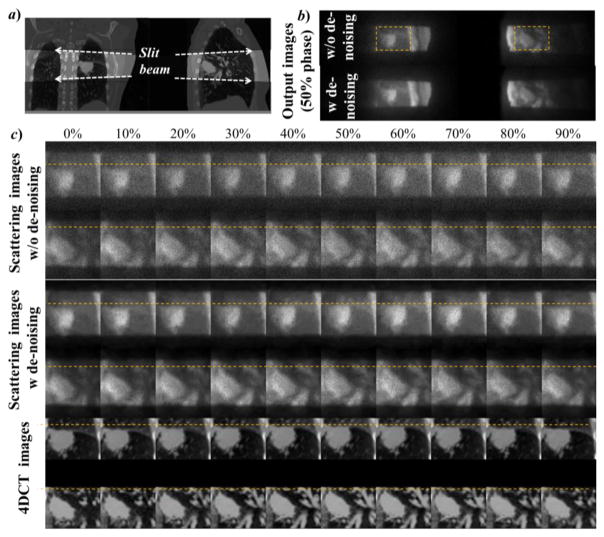
We also performed simulation studies to test the use of the proposed scatter x-ray imaging to visualize the moving anatomy of a lung cancer patient. Two simulations were performed using left-right and posterior-anterior illuminations. The x-ray source was placed on the side close to the tumor to increase visibility. Figure 7 shows the simulation results of the raw data acquired. Compared to the anatomy in Figure 7a, our proposed method was able to retrieve the corresponding coronal/sagittal scattering images (Figure 7b) with a clear visualization of the tumor inside the lung. While the image quality of the scattering image was apparently inferior to that of a 4DCT image (Figure 7c), it still contained the anatomy and motion information for tumor tracking. In addition, we applied the denoising algorithm BM3D (Dabov et al., 2007) on the raw image to improve image quality.
Figure 7.
MC simulated scattering imaging for tumor tracking in a lung patient case. a) The anatomy in coronal (left) and sagittal (right) planes to be imaged by the slit beam. b) 50% phase of the coronal and the sagittal view of the raw scattering images. c) zoom-in view of the scattering images at the ROIs shown for b) for all ten respiratory phases, as well as the corresponding 4DCT images.
3.5 Imaging dose
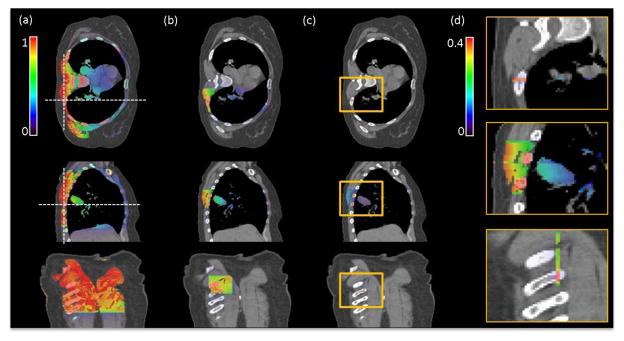
Figure 8 shows the comparison of the imaging dose distribution in three scenarios, namely a single CBCT projection, a reduced field size projection, and the slit beam in the scattered imaging method. As the irradiation field size decreased, the integral dose to the patient body was dramatically reduced. With the slit beam setup, the dose was limited to the region under x-ray illumination, whereas the dose to critical organs, including the spinal cord and the heart, was substantially lower than in the other two cases. In addition, in the region that was directly exposed to the slit x-ray beam, the local dose was about 40% of that in a CBCT projection, as indicated by the color bars in Figure 8. This occurred, because the reduced exposure area also reduced the scattered photon dose. From the last view of Fig. 8, the dose distribution seems to only exist in the irradiated area. This is purely due to the relatively wide display window that was selected for the purpose of comparing dose with the CBCT case. In fact, the dose distribution spread around the slit area due to photon scattering, although the dose outside the irradiation area was relatively low.
Figure 8.
Results of the MC imaging dose calculation for a lung cancer patient. a) CBCT projection with a large field of 26.7 × 20.0cm2 at isocenter. b) Projection with a reduced field of 6.78 × 6.78 cm2. c) The slit beam with 0.2 × 6.78 cm2 corresponding to the setup shown in Figure 7a) right. d) Zoom-in regions inside the yellow boxes in c) displayed with a narrowed window of [0, 0.4]. The three rows represent transverse, sagittal and coronal views, respectively. Dash lines in a) indicate the location of other views.
4. Discussions
4.1 Photon counts
The purpose of this paper is to propose an idea of scattering x-ray imaging and to perform initial and proof-of-concept studies to demonstrate its potential. While our simulations have shown some promising results, there is a long way to go to test the feasibility. The largest concern regarding the feasibility is whether there are sufficient photons at the detector to form an image with acceptable quality. In fact, incoming photons are scattered towards the 4π solid angle and the detector only captures those at a particular direction. collimation in front of the detector further reduces the number of photons hitting a detector pixel. These factors significantly limit the photon counts. We have performed MC simulations and recorded photon fluence at the detector in a typical CBCT projection and in the proposed imaging method. It was found that the photon fluence at the scattering image detector was ~104 to ~105 times lower than at the CBCT detector. This indicates that a standard CBCT flat-panel detector is probably not sensitive enough to this weak signal. A new or different detector for this proposed modality is hence needed. With a relatively low counting rate, detectors based on detecting and processing each photon should provide technical advantages compared to conventional x-ray detectors, such as image enhancement with energy selection and post-acquisition online data correction. For instance, a detector with a design similar to a dedicated high-resolution low-to-medium energy (around 20 to 100 keV) gamma camera (Lazaro et al., 2003; Pani et al., 2003) may potentially be applicable for this application, although detailed detector designs, such as determining critical parameters of collimator, discrete or continuous scintillator, photon sensor and processing electronics, need to be carefully studied and optimized in order to provide the desired x-ray imaging performance. It is our on-going study to perform more comprehensive MC simulations to quantify the desired characteristics of the detector, e.g. energy window, spatial resolution, sensitivity, contrast to noise ratio, etc. In fact, our proposed scattering imaging scheme is similar to that in Single Photon Emission Computed Tomography (SPECT). In both cases, spatial collimation is used to provide geometry information at the cost of reducing photon counts. The difference is that SPECT uses internal emission as the photon source, whereas ours employs scattered incoming x-ray as the source. Hence, other well-established techniques in SPECT such as multiple detectors and collimators can be used to improve system sensitivity. Using a higher mAs than in CBCT is also beneficial, although imaging dose and potentially skin erythema may become limiting factors. These issues will be investigated in subsequent studies.
4.2 Image correction for moving anatomy
Factors C2 and C4 for incoming and outgoing x-ray attenuation depend on CT images. For instance, lung anatomy motion and density variation with respiration will impact these terms. For real-time quantitative applications, it is challenging to use instantaneous CT images to compute these factors. However, the uncorrected results shown in Figure 7 demonstrate a clear tumor structure that may be sufficient for tumor tracking purposes. Hence computing correction factors may not be needed to improve fidelity of image intensity. Meanwhile, there may be other methods to approximately compute these factors, such as based on a motion-averaged patient CT image.
4.3 MV scattering
Another concern for in-treatment imaging is the interference from the MV treatment beam. A treatment beam typically shows much higher intensity compared to the kV imaging beam, therefore scattered photons from the MV beam may contribute significantly to the detected signal. For potential application in tumor tracking, a possible setup is to mount the detector at 45 degree direction relative to the kV beam and 135 degree to the MV beam, as illustrated in Fig. 9. For MV beam, the backscattered photons account for only a small fraction of scattered photons due to Klein-Nishina formula. In addition, as opposed to being scattered from a plane in the proposed imaging scheme, the MV scattered photons are from a volume. Hence, they will possibly form a smooth background on top of the expected kV images. It is our future study to conduct additional simulations using an MV photon transport MC package to investigate this issue. If the MV scattered photons were found to be a problem, potential solutions may be to use energy discrimination in a gamma camera detector to distinguish and eliminate MV-scattered photons. It may also be possible to design beam sequence to quickly alternate MV and kV beams to reduce MV interference on kV imaging.
Figure 9.
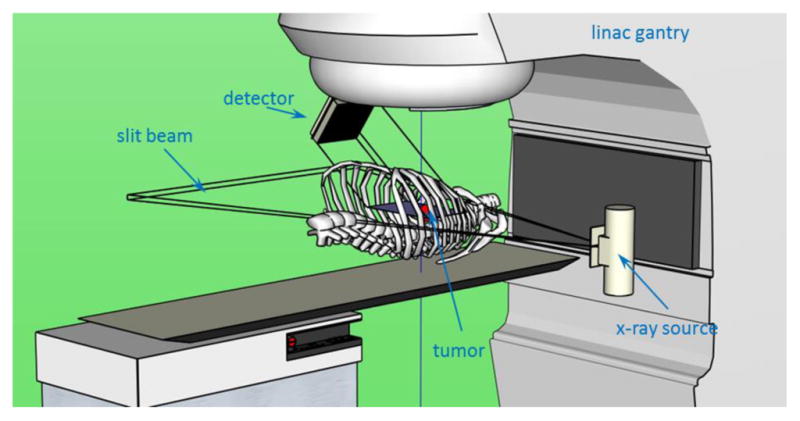
Illustration of a possible setup on an existing linac for tumor tracking.
5. Conclusions
We propose a new imaging modality that uses x-ray scattered photons to image cross sectional anatomy of the patient. This method may provide a new approach for real-time, marker-less tumor tracking. We performed MC simulation studies for proof-of-concept purposes and showed the following: 1) Preliminary studies demonstrated the potential to retrieve a cross sectional image. The image contrast is superior to fluoroscopy and is comparable with CBCT. 2) The proposed imaging method acquires an instantaneous anatomy image. Applying correction factors to derive the actual image is computationally easy. This allows cine-mode imaging, which could be used for real-time tumor tracking. 3) Upon direct comparison, the slat is preferable to the pinhole due to higher photon counts. It does not require a component that is close to the patient, namely the pinhole, which is more suitable for the integration on a linear accelerator.
Figure 10.
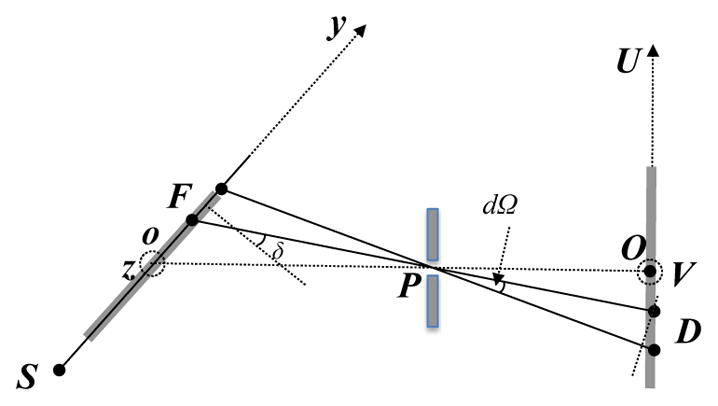
Illustration of geometry for the derivation of G(F) in the pinhole geometry.
Acknowledgments
This work is supported in part by NIH (1R01CA154747-01, 1R21 CA178787-01A1 and 1R21 EB017978-01A1). The authors would like to thank Dr. Damiana Chiavolini for proofreading the manuscript.
Appendix. Derivation of geometry factor G(F)
Geometry factor G(F) for the outgoing beam in the pinhole setup is due to converging/diverging geometry. It makes the area scattering photons to each detector pixel D a variable depending on its location. For each F, G(F) is proportional to the area size.
Without losing generality, consider a detector D that has a unit area. We first computed its projection to the direction of the outgoing ray line PD. This was achieved by multiplying by the cosine of the angle between PD and OP, i.e. . The solid angle of this detector with respect to the pinhole was calculated as . For the region around the voxel F where the photons to this pixel D are from, its projection to the direction of the ray line is . Finally, let δ be the angle between the normal vector of the x-ray plane and line FD. Dividing by cos δ yields the geometry factor .
In the case of the parallel slat collimation, geometry correction factor G(F) =1, as all the detector pixels received photons from regions of the same size.
References
- Ahn S, Yi B, Suh Y, Kim J, Lee S, Shin S, Choi E. A feasibility study on the prediction of tumour location in the lung from skin motion. British journal of radiology. 2004;77:588–96. doi: 10.1259/bjr/64800801. [DOI] [PubMed] [Google Scholar]
- Arslan S, Yilmaz A, Bayramgürler B, Uzman O, Nver E, Akkaya E. CT-guided transthoracic fine needle aspiration of pulmonary lesions: accuracy and complications in 294 patients. Medical science monitor: international medical journal of experimental and clinical research. 2002;8:CR493. [PubMed] [Google Scholar]
- Berbeco R, Mostafavi H, Sharp GC, Jiang SB. Tumor tracking in the absence of radiopaque markers. The 14th International Conference on the Use of Computers in Radiation Therapy; Seoul, Korea: Jeong Publishing; 2004. pp. 433–36. [Google Scholar]
- Berbeco RI, Mostafavi H, Sharp GC, Jiang SB. Towards fluoroscopic respiratory gating for lung tumours without radiopaque markers. Phys Med Biol. 2005;50:4481. doi: 10.1088/0031-9155/50/19/004. [DOI] [PubMed] [Google Scholar]
- Bergner F, Berkus T, Oelhafen M, Kunz P, Pan T, Kachelrieß M. Autoadaptive phase-correlated (AAPC) reconstruction for 4D CBCT. Med Phys. 2009;36:5695. doi: 10.1118/1.3260919. [DOI] [PMC free article] [PubMed] [Google Scholar]
- Cheung J, Kudchadker RJ, Zhu XR, Lee AK, Newhauser WD. Dose perturbations and image artifacts caused by carbon-coated ceramic and stainless steel fiducials used in proton therapy for prostate cancer. Phys Med Biol. 2010;55:7135. doi: 10.1088/0031-9155/55/23/S13. [DOI] [PubMed] [Google Scholar]
- Cho B, Poulsen PR, Sloutsky A, Sawant A, Keall PJ. First demonstration of combined kV/MV image-guided real-time dynamic multileaf-collimator target tracking. International Journal of Radiation Oncology* Biology* Physics. 2009;74:859–67. doi: 10.1016/j.ijrobp.2009.02.012. [DOI] [PMC free article] [PubMed] [Google Scholar]
- Dabov K, Foi A, Katkovnik V, Egiazarian K. Image denoising by sparse 3-D transform-domain collaborative filtering. Image Processing, IEEE Transactions on. 2007;16:2080–95. doi: 10.1109/tip.2007.901238. [DOI] [PubMed] [Google Scholar]
- Dietrich L, Jetter S, Tücking T, Nill S, Oelfke U. Linac-integrated 4D cone beam CT: first experimental results. Phys Med Biol. 2006;51:2939. doi: 10.1088/0031-9155/51/11/017. [DOI] [PubMed] [Google Scholar]
- Feldkamp L, Davis L, Kress J. Practical cone-beam algorithm. JOSA A. 1984;1:612–9. [Google Scholar]
- Ford E, Mageras G, Yorke E, Rosenzweig K, Wagman R, Ling C. Evaluation of respiratory movement during gated radiotherapy using film and electronic portal imaging. International Journal of Radiation Oncology* Biology* Physics. 2002;52:522–31. doi: 10.1016/s0360-3016(01)02681-5. [DOI] [PubMed] [Google Scholar]
- Giebeler A, Fontenot J, Balter P, Ciangaru G, Zhu R, Newhauser W. Dose perturbations from implanted helical gold markers in proton therapy of prostate cancer. Journal of applied clinical medical physics/American College of Medical Physics. 10:2875. doi: 10.1120/jacmp.v10i1.2875. [DOI] [PMC free article] [PubMed] [Google Scholar]
- Glover G. Compton scatter effects in CT reconstructions. Med Phys. 1982;9:860–7. doi: 10.1118/1.595197. [DOI] [PubMed] [Google Scholar]
- Halama J. Med Phys. AMER ASSOC PHYSICISTS MEDICINE AMER INST PHYSICS STE 1 NO 1, 2 HUNTINGTON QUADRANGLE; MELVILLE, NY 11747-4502 USA: 2003. Advances and quality assurance in gamma camera & SPECT systems; p. 1392. [Google Scholar]
- Hoisak JDP, Sixel KE, Tirona R, Cheung PCF, Pignol JP. Correlation of lung tumor motion with external surrogate indicators of respiration. International Journal of Radiation Oncology* Biology* Physics. 2004;60:1298–306. doi: 10.1016/j.ijrobp.2004.07.681. [DOI] [PubMed] [Google Scholar]
- Jia X, Tian Z, Lou Y, Sonke J-J, Jiang SB. Four-dimensional cone beam CT reconstruction and enhancement using a temporal nonlocal means method. Medical Physics. 2012a;39:5592–602. doi: 10.1118/1.4745559. [DOI] [PMC free article] [PubMed] [Google Scholar]
- Jia X, Yan H, Folkerts M, Jiang S. GDRR: A GPU Tool for Cone-Beam CT Projection Simulations. Med Phys. 2012b;39:3890. doi: 10.1118/1.4766436. [DOI] [PMC free article] [PubMed] [Google Scholar]
- Jia X, Yan H, Gu XJ, Jiang SB. Fast Monte Carlo simulation for patient-specific CT/CBCT imaging dose calculation. Phys Med Biol. 2012c;57:577–90. doi: 10.1088/0031-9155/57/3/577. [DOI] [PubMed] [Google Scholar]
- Jiang S. Tracking tumor with dynamic MLC: Be SMART. Proc. 14th Conf. on the Use of Computers in Radiation Therapy; Seoul, Korea. May 2004; 2004. p. 47. [Google Scholar]
- Jiang SB. Seminars in radiation oncology. Elsevier; 2006. Radiotherapy of mobile tumors; pp. 239–48. [DOI] [PubMed] [Google Scholar]
- Keall P, Starkschall G, Hee Shukla, Forster K, Ortiz V, Stevens C, Vedam S, George R, Guerrero T, Mohan R. Acquiring 4D thoracic CT scans using a multislice helical method. Physics in Medicine and Biology. 2004;49:2053. doi: 10.1088/0031-9155/49/10/015. [DOI] [PubMed] [Google Scholar]
- Keall PJ, Mageras GS, Balter JM, Emery RS, Forster KM, Jiang SB, Kapatoes JM, Low DA, Murphy MJ, Murray BR, Ramsey CR, Van Herk MB, Vedam SS, Wong JW, Yorke E. The management of respiratory motion in radiation oncology report of AAPM Task Group 76. Medical Physics. 2006;33:3874–900. doi: 10.1118/1.2349696. [DOI] [PubMed] [Google Scholar]
- Kitamura K, Shirato H, Shimizu S, Shinohara N, Harabayashi T, Shimizu T, Kodama Y, Endo H, Onimaru R, Nishioka S. Registration accuracy and possible migration of internal fiducial gold marker implanted in prostate and liver treated with real-time tumor-tracking radiation therapy (RTRT) Radiother Oncol. 2002;62:275–81. doi: 10.1016/s0167-8140(02)00017-8. [DOI] [PubMed] [Google Scholar]
- Klein O, Nishina Y. Über die Streuung von Strahlung durch freie Elektronen nach der neuen relativistischen Quantendynamik von Dirac. Zeitschrift für Physik. 1929;52:853–68. [Google Scholar]
- Kothary N, Heit JJ, Louie JD, Kuo WT, Loo BW, Jr, Koong A, Chang DT, Hovsepian D, Sze DY, Hofmann LV. Safety and efficacy of percutaneous fiducial marker implantation for image-guided radiation therapy. J Vasc Interv Radiol. 2009;20:235–9. doi: 10.1016/j.jvir.2008.09.026. [DOI] [PubMed] [Google Scholar]
- Kriminski S, Mitschke M, Sorensen S, Wink NM, Chow PE, Tenn S, Solberg TD. Respiratory correlated cone-beam computed tomography on an isocentric C-arm. Physics in Medicine and Biology. 2005;50:5263–80. doi: 10.1088/0031-9155/50/22/004. [DOI] [PubMed] [Google Scholar]
- Lazaro D, Buvat I, Donnarieix D, Loudos G, Giokaris N, Strul D, Santin G, Maigne L, Spanoudaki V, Styliaris S, Staelens S, Breton V. Monte Carlo simulation of a CsI(Tl) gamma camera dedicated to small animal imaging using GATE. Journal of Nuclear Medicine. 2003;44:288P-P. doi: 10.1088/0031-9155/49/2/007. [DOI] [PubMed] [Google Scholar]
- Leng S, Zambelli J, Tolakanahalli R, Nett B, Munro P, Star-Lack J, Paliwal B, Chen GH. Streaking artifacts reduction in four-dimensional cone-beam computed tomography. Med Phys. 2008;35:4649. doi: 10.1118/1.2977736. [DOI] [PMC free article] [PubMed] [Google Scholar]
- Li R, Jia X, Lewis JH, Gu X, Folkerts M, Men C, Jiang SB. Single-projection based volumetric image reconstruction and 3D tumor localization in real time for lung cancer radiotherapy. Medical image computing and computer-assisted intervention : MICCAI …International Conference on Medical Image Computing and Computer-Assisted Intervention; 2010. pp. 449–56. [DOI] [PubMed] [Google Scholar]
- Li T, Xing L, Munro P, McGuinness C, Chao M, Yang Y, Loo B, Koong A. Four-dimensional cone-beam computed tomography using an on-board imager. Med Phys. 2006;33:3825–33. doi: 10.1118/1.2349692. [DOI] [PubMed] [Google Scholar]
- Li X, Yan SF, Ma XC, Hou CH. Spherical harmonics MUSIC versus conventional MUSIC. Appl Acoust. 2011;72:646–52. [Google Scholar]
- Lin T, Cervino LI, Tang X, Vasconcelos N, Jiang SB. Fluoroscopic tumor tracking for image-guided lung cancer radiotherapy. Phys Med Biol. 2009;54:981. doi: 10.1088/0031-9155/54/4/011. [DOI] [PubMed] [Google Scholar]
- Low DA, Nystrom M, Kalinin E, Parikh P, Dempsey JF, Bradley JD, Mutic S, Wahab SH, Islam T, Christensen G. A method for the reconstruction of four-dimensional synchronized CT scans acquired during free breathing. Med Phys. 2003;30:1254–63. doi: 10.1118/1.1576230. [DOI] [PubMed] [Google Scholar]
- Lu J, Guerrero TM, Munro P, Jeung A, Chi PCM, Balter P, Zhu XR, Mohan R, Pan T. Four-dimensional cone beam CT with adaptive gantry rotation and adaptive data sampling. Med Phys. 2007;34:3520. doi: 10.1118/1.2767145. [DOI] [PubMed] [Google Scholar]
- Nelson C, Starkschall G, Balter P, Morice RC, Stevens CW, Chang JY. Assessment of lung tumor motion and setup uncertainties using implanted fiducials. International Journal of Radiation Oncology* Biology* Physics. 2007;67:915–23. doi: 10.1016/j.ijrobp.2006.10.033. [DOI] [PubMed] [Google Scholar]
- Pan T, Lee T-Y, Rietzel E, Chen GT. 4D-CT imaging of a volume influenced by respiratory motion on multi-slice CT. Medical Physics. 2004;31:333. doi: 10.1118/1.1639993. [DOI] [PubMed] [Google Scholar]
- Pani R, Pellegrini R, Cinti MN, Trotta C, Trotta G, Scafe R, Betti M, Cusanno F, Montani L, Iurlaro G, Garibaldi F, Del Guerra A. A novel compact gamma camera based on flat panel PMT. Nuclear Instruments & Methods in Physics Research Section a-Accelerators Spectrometers Detectors and Associated Equipment. 2003;513:36–41. [Google Scholar]
- Park JC, Kim JS, Park SH, Liu Z, Song B, Song WY. Motion-map constrained image reconstruction (MCIR): Application to four-dimensional cone-beam computed tomography. Med Phys. 2013;40:121710. doi: 10.1118/1.4829504. [DOI] [PubMed] [Google Scholar]
- Purdie TG, Moseley DJ, Bissonnette JP, Sharpe MB, Franks K, Bezjak A, Jaffray DA. Respiration correlated cone-beam computed tomography and 4DCT for evaluating target motion in Stereotactic Lung Radiation Therapy. Acta Oncologica. 2006;45:915–22. doi: 10.1080/02841860600907345. [DOI] [PubMed] [Google Scholar]
- Rottmann J, Aristophanous M, Chen A, Berbeco R. A multi-region algorithm for markerless beam’s-eye view lung tumor tracking. Phys Med Biol. 2010;55:5585. doi: 10.1088/0031-9155/55/18/021. [DOI] [PubMed] [Google Scholar]
- Rottmann J, Keall P, Berbeco R. Real-time soft tissue motion estimation for lung tumors during radiotherapy delivery. Med Phys. 2013;40:091713. doi: 10.1118/1.4818655. [DOI] [PMC free article] [PubMed] [Google Scholar]
- Seppenwoolde Y, Shirato H, Kitamura K, Shimizu S, van Herk M, Lebesque JV, Miyasaka K. Precise and real-time measurement of 3D tumor motion in lung due to breathing and heartbeat, measured during radiotherapy. International Journal of Radiation Oncology* Biology* Physics. 2002;53:822–34. doi: 10.1016/s0360-3016(02)02803-1. [DOI] [PubMed] [Google Scholar]
- Sharp GC, Jiang SB, Shimizu S, Shirato H. Prediction of respiratory tumour motion for real-time image-guided radiotherapy. Phys Med Biol. 2004;49:425. doi: 10.1088/0031-9155/49/3/006. [DOI] [PubMed] [Google Scholar]
- Shimizu S, Shirato H, Ogura S, Akita-Dosaka H, Kitamura K, Nishioka T, Kagei K, Nishimura M, Miyasaka K. Detection of lung tumor movement in real-time tumor-tracking radiotherapy. International Journal of Radiation Oncology* Biology* Physics. 2001;51:304–10. doi: 10.1016/s0360-3016(01)01641-8. [DOI] [PubMed] [Google Scholar]
- Shirato H, Oita M, Fujita K, Watanabe Y, Miyasaka K. Feasibility of synchronization of real-time tumor-tracking radiotherapy and intensity-modulated radiotherapy from viewpoint of excessive dose from fluoroscopy. International Journal of Radiation Oncology* Biology* Physics. 2004;60:335–41. doi: 10.1016/j.ijrobp.2004.04.028. [DOI] [PubMed] [Google Scholar]
- Shirato H, Shimizu S, Kunieda T, Kitamura K, van Herk M, Kagei K, Nishioka T, Hashimoto S, Fujita K, Aoyama H. Physical aspects of a real-time tumor-tracking system for gated radiotherapy. International Journal of Radiation Oncology* Biology* Physics. 2000;48:1187–95. doi: 10.1016/s0360-3016(00)00748-3. [DOI] [PubMed] [Google Scholar]
- Siddon RL. Fast calculation of the exact radiological path for a three-dimensional CT array. Med Phys. 1985;12:252. doi: 10.1118/1.595715. [DOI] [PubMed] [Google Scholar]
- Sonke JJ, Zijp L, Remeijer P, van Herk M. Respiratory correlated cone beam CT. Medical Physics. 2005;32:1176–86. doi: 10.1118/1.1869074. [DOI] [PubMed] [Google Scholar]
- Swensen SJ, Jett JR, Hartman TE, Midthun DE, Mandrekar SJ, Hillman SL, Sykes AM, Aughenbaugh GL, Bungum AO, Allen KL. CT screening for lung cancer: five-year prospective experience 1. Radiology. 2005;235:259–65. doi: 10.1148/radiol.2351041662. [DOI] [PubMed] [Google Scholar]
- Truong T, Nguyen MK. Numerical Simulation-From Theory to Industry. InTech; Rijeka, Croatia: 2012. Recent Developments on Compton Scatter Tomography: Theory and Numerical Simulations. [Google Scholar]
- Tsunashima Y, Sakae T, Shioyama Y, Kagei K, Terunuma T, Nohtomi A, Akine Y. Correlation between the respiratory waveform measured using a respiratory sensor and 3D tumor motion in gated radiotherapy. International Journal of Radiation Oncology* Biology* Physics. 2004;60:951–8. doi: 10.1016/j.ijrobp.2004.06.026. [DOI] [PubMed] [Google Scholar]
- Vedam S, Keall P, Kini V, Mostafavi H, Shukla H, Mohan R. Acquiring a four-dimensional computed tomography dataset using an external respiratory signal. Phys Med Biol. 2003;48:45. doi: 10.1088/0031-9155/48/1/304. [DOI] [PubMed] [Google Scholar]
- Wang J, Gu X. Simultaneous motion estimation and image reconstruction (SMEIR) for 4D cone-beam CT. Medical Physics. 2013;40:101912. doi: 10.1118/1.4821099. [DOI] [PubMed] [Google Scholar]
- Xu Y, Yan H, Ouyang L, Wang J, Zhou L, Cervino L, Jiang SB, Jia X. A method for volumetric imaging in radiotherapy using single x-ray projection. Medical Physics. 2015;42:2498–509. doi: 10.1118/1.4918577. [DOI] [PMC free article] [PubMed] [Google Scholar]
- Yan H, Wang X, Yin W, Pan T, Ahmad M, Mou X, Cerviño L, Jia X, Jiang SB. Extracting respiratory signals from thoracic cone beam CT projections. Phys Med Biol. 2013;58:1447. doi: 10.1088/0031-9155/58/5/1447. [DOI] [PMC free article] [PubMed] [Google Scholar]
- Yan H, Yin FF, Zhu GP, Ajlouni M, Kim JH. The correlation evaluation of a tumor tracking system using multiple external markers. Med Phys. 2006;33:4073. doi: 10.1118/1.2358830. [DOI] [PubMed] [Google Scholar]
- Yan H, Zhen X, Folkerts M, Li Y, Pan T, Cervino L, Jiang SB, Jia X. A hybrid reconstruction algorithm for fast and accurate 4D cone-beam CT imaginga) Med Phys. 2014;41:071903. doi: 10.1118/1.4881326. [DOI] [PMC free article] [PubMed] [Google Scholar]
- Yang Y, Zhong Z, Guo X, Wang J, Anderson J, Solberg T, Mao W. A novel markerless technique to evaluate daily lung tumor motion based on conventional cone-beam CT projection data. International Journal of Radiation Oncology* Biology* Physics. 2012;82:e749–e56. doi: 10.1016/j.ijrobp.2011.11.035. [DOI] [PubMed] [Google Scholar]
- Zeng GL. Medical Biometrics. Springer; 2007. pp. 240–7. [Google Scholar]
- Zhang X, Homma N, Ichiji K, Abe M, Sugita N, Takai Y, Narita Y, Yoshizawa M. A kernel-based method for markerless tumor tracking in kV fluoroscopic images. Physics in Medicine and Biology. 2014;59:4897–911. doi: 10.1088/0031-9155/59/17/4897. [DOI] [PubMed] [Google Scholar]
- Zhao B, Yang Y, Li T, Li X, Heron DE, Huq MS. Statistical analysis of target motion in gated lung stereotactic body radiation therapy. Phys Med Biol. 2011;56:1385. doi: 10.1088/0031-9155/56/5/011. [DOI] [PubMed] [Google Scholar]
- Zhao Q, Chou C-R, Mageras G, Pizer S. Local Metric Learning in 2D/3D Deformable Registration With Application in the Abdomen. Ieee Transactions on Medical Imaging. 2014;33:1592–600. doi: 10.1109/TMI.2014.2319193. [DOI] [PMC free article] [PubMed] [Google Scholar]
- Zheng Z, Sun M, Pavkovich J, Star-Lack J. Fast 4D cone-beam reconstruction using the McKinnon-Bates algorithm with truncation correction and nonlinear filtering. Society of Photo-Optical Instrumentation Engineers (SPIE) Conference Series; 2011. p. 94. [Google Scholar]


