Abstract
A simple method, based on inversion modulated double electron–electron resonance electron paramagnetic resonance (DEER EPR) spectroscopy, is presented for determining populations of monomer and dimer in proteins (as well as any other biological macromolecules). The method is based on analysis of modulation depth versus electron double resonance (ELDOR) pulse flip angle. High accuracy is achieved by complete deuteration, extensive sampling of a large number of ELDOR pulse flip angle values, and combined analysis of differently labeled spin samples. We demonstrate the method using two different proteins: an obligate monomer exemplified by the small immunoglobulin binding B domain of protein A, and the p66 subunit of HIV-1 reverse transcriptase which exists as an equilibrium mixture of monomer and dimer species whose relative populations are affected by glycerol content. This information is crucial for quantitative analysis of distance distributions involving proteins that may exist as mixtures of monomer, dimer and high order multimers under the conditions of the DEER EPR experiment.
Keywords: double electron-electron resonance (deer), electron paramagnetic resonance (epr), spectroscopy, HIV-1 reverse transcriptase, population distributions, proteins
Graphical abstract
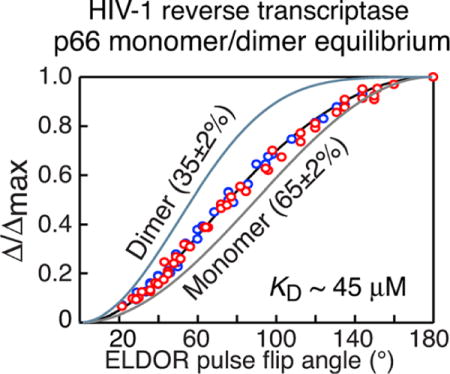
DEER in the headlights: Analysis of modulation depth for a double electron–electron resonance dipolar evolution curve as a function of electron double resonance (ELDOR) pulse flip angle is an effective and reliable electron paramagnetic resonance (EPR) method for resolving monomer/dimer populations in a frozen glass. The technique is demonstrated using the p66 subunit of HIV-1 reverse transcriptase where dimerization is modulated by glycerol, a universal cryo-protectant widely used in EPR spectroscopy.
Double electron-electron resonance (DEER; Figure 1 A) is a powerful electron paramagnetic resonance (EPR) method for measuring distances between two unpaired electrons separated by ≈20 to ≈80Å.[1] In conjunction with site-directed spin labeling, DEER can provide quantitative insights into structure, conformational transitions and relative populations of conformational states in biological macromolecules.[2] In complex systems involving two or more subunits, quantitative interpretation of DEER data requires prior knowledge of the relative populations of monomeric and multimeric states under the conditions of the EPR experiment. The latter generally involve the use of cryo-protectants, such as glycerol, which can potentially perturb monomer–multimer equilibria. The modulation depth of a DEER echo curve (Figure 1 B) provides a means of spin counting[3] with applications to both organic radicals and biomolecules.[4] Previous work attempted quantification of protein dimerization based on one-point measurements of modulation depth for singly spin-labeled mutants, relying on calibration relative to bi- and tri-radicals.[5] Here we show that analysis of modulation depth as a function of the electron double resonance (ELDOR) pulse flip angle (Figure 1 A) can be used to accurately quantify monomer/dimer populations in an equilibrium mixture (frozen out at low temperature). We demonstrate the approach using two examples, an obligate monomer (protein A), and a monomer/dimer mixture comprising the p66 subunit of HIV-1 reverse transcriptase. The key to accurate analysis lies in high signal-to-noise offered at Q-band, full deuteration of protein and solvent resulting in long spin-label phase memory relaxation times that allow reliable and accurate baseline subtraction by acquiring DEER data out to relatively long dipolar coupling evolution times,[6] extensive sampling over a wide range of ELDOR flip angles (30 to 1808°), and simultaneous fitting of data from different combinations of spin labels.
Figure 1.
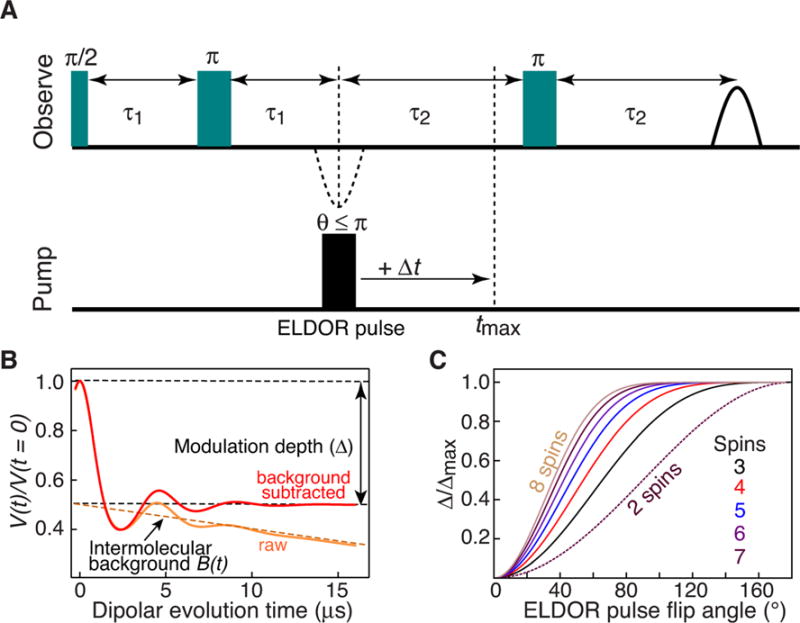
Inversion modulated DEER spectroscopy. A) The four-pulse DEER experiment.[1d] Data are recorded for a large number (30 to 50) of ELDOR pulse flip angles spanning a range from 30 to 180°. B) Schematic of raw (orange) and background corrected (red) DEER echo curves. The modulation depth, Δ, is the difference in intensity between the DEER echo curve at t = 0, and the value of the background term B(t) at t = 0. C) Theoretical plots of normalized modulation depth, Δ(θ)/Δmax, versus ELDOR pulse flip angles (θ) for a system with 2 to 8 spins (where Δmax is the maximum modulation depth obtained at θ = 180°.
The raw spin echo amplitude, V(t) (Figure 1 B), as a function of the dipolar coupling evolution time t, in a DEER experiment is given by the product of two terms: an intramolecular form factor, Vintra(t) dependent upon the interactions of unpaired electrons within the molecule of interest; and a background term, B(t), arising from numerous long-range interactions between unpaired electrons of different molecules.[4ab] For a homogeneous distribution of spin-labeled molecules in a glassy frozen solution, B(t) can be described by a single exponential decay[7] The difference between the values of V(t=0) and B(t=0) is the modulation depth Δ (Figure 1 B).
The ratio of modulation depth, Δ(θ), at a given ELDOR pulse flip angle θ, to the maximum modulation depth, Δmax, obtained at θ= 180°, is given by Equation (1):[4b]
| (1) |
where λmax is the inversion efficiency at θ=180°, and N the number of nitroxide spin labels. For a doubly nitroxide spin-labeled sample, N = 2 for a monomer, 4 for a dimer, 6 for a trimer, and so on. λmax for different 180° ELDOR pulse lengths is easily determined from an echo-detected spin nutation experiment (see Supporting Information Figure S1). The observed normalized modulation depth (Δ/Δmax)obs is given by a population-weighted average of the different species present in the EPR sample. Thus for a mixture of monomer and dimer with 100% double nitroxide spin labeling, (Δ/Δmax)obs is given by Equation (2):[4b]
| (2) |
where pm is the monomer population. The formulation presented in Equations (1) and (2), in contrast to one that only looks at absolute modulation depth,[3] does not require calibration with model compounds containing a known number of spins.[4b] If spin-labeling is incomplete, both two- and three-spin dimeric species have to be taken into account, and Equation (2) needs to be expanded to include terms for these species, as well as the labeling efficiency (Figure S2), which can easily be ascertained by mass spectrometry.
Because the ELDOR pulse length and power attenuation settings on our EPR spectrometer can only be altered in increments of 2 ns and 1 dB, respectively, we acquired data using three ELDOR pulse lengths (6, 8 and 10 ns) with attenuation settings ranging from 13–15 dB out to 28 dB (corresponding to ELDOR 180° pulse lengths spanning a range of 6 to ≈40 ns), under conditions where the experimental λmax value is ≥0.8 (Figure S3). This approach permits extensive sampling of ELDOR pulse flip angles over the range θ = 30–180° to generate Δ/Δmax curves comprising typically between 37 and 45 different flip angle values. Examples of DEER echo amplitude curves are shown in the supporting information (Figure S4).
We first consider data obtained with the immunoglobulin-binding B domain of protein A, a small monomeric protein,[8] with 1-oxyl-2,2,5,5-tetramethyl-D3-pyrroline-3-methyl) methanethiosulfonate (MTSL) nitroxide labels placed close to the N-and C-termini (Figure 2A, top). The P(r) distance distribution derived from analysis of the DEER data is bimodal, a shorter distance at 33 Å and a longer one at 39 Å with occupancies of about 70 and 30%, respectively (Figure 2 B).[6b] The bimodal P(r) distribution is due to the presence of several frozen rotamer populations for the spin labels.[6b] However, an alternative explanation might postulate the existence of a dimer (Figure 2A, bottom). These two possibilities are easily resolved by direct comparison of the experimental plot of (Δ/Δmax)obs versus ELDOR pulse flip angle with the theoretical monomer and dimer curves, which indicate unambiguously that protein A is a monomer under the conditions of the EPR experiment (i.e. a temperature of 50 K and a solvent containing 30% d8-glycerol).
Figure 2.
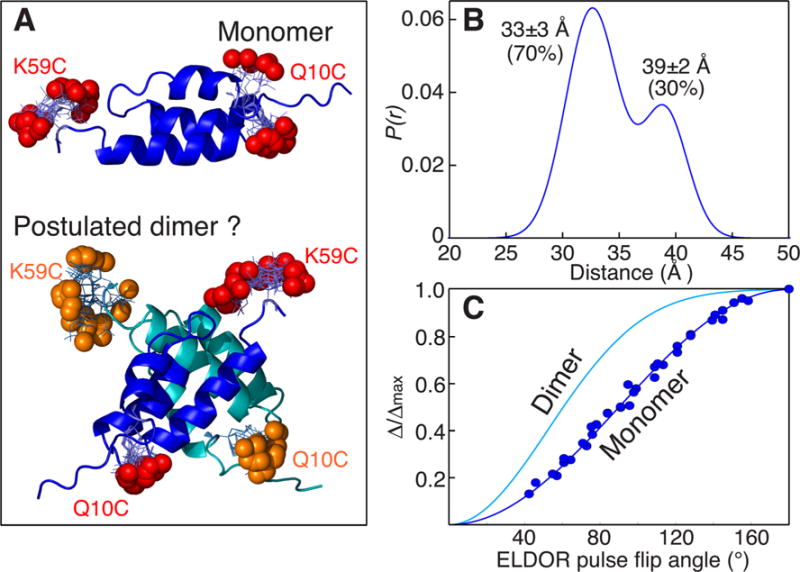
Is Protein A monomeric or dimeric under conditions of the DEER experiment? A) Ribbon diagram of protein A (PDB 1BDD)[12] showing the positions of the nitroxide labels in the monomer (red spheres) and postulated dimer (red and orange spheres). In the dimer the backbone and nitroxide labels of one subunit are shown in dark blue and red, respectively, and in the other subunit in cyan and orange, respectively. The positions of the nitroxide labels were calculated by first optimizing side chain positions using the program SCWRL4.0,[13] and then adding MTSL and calculating their distributions using the program MMMv2013.2.[14] B) Experimentally derived distance distribution from DEER. The DEER data were analyzed using the program GLADD[15] with two Gaussians; similar results are obtained by Tikhonov regularization using the program DEERAnalysis 2013.[16] C) Comparison of the experimental curve of Δ/Δmax versus ELDOR pulse flip angle (blue circles) with the corresponding theoretical curves [cf. Eq. (1)] for a monomer (dark blue line) and a dimer (cyan line). Experimental DEER data were acquired at Q-band on a sample of deuterated (≈97%), 100% MTSL-labeled protein A in 30%(v/v) d8-glycerol and D2O at 50 K (see Supporting Information for full experimental details, including examples of raw and baseline-corrected DEER curves shown in Figure S4; extent of MTSL-labeling and deuteration was determined by liquid chromatography-positive ion electron spray mass spectrometry).
Next we consider the p66 subunit of HIV-1 reverse transcriptase.[9] The immature reverse transcriptase comprises an equilibrium mixture of p66 monomer and homodimer[10] (Figure 3 A) prior to cleavage of one subunit by HIV-1 protease to generate the mature p51/p66 heterodimer.[11] At room temperature in the absence of glycerol, a 50 μM solution of deuterated (≈97%) p66 comprises 34% monomer and 66% dimer, as determined by analytical ultracentrifugation (see Supporting Information). p66 already contains one surface exposed cysteine at position 280, and an additional surface exposed cysteine was engineered at two alternative positions, W24C and T240C (Figure 3A). Data were therefore acquired on two doubly MTSL spin-labeled samples: C280/W24C and C280/T240C. (The MTSL spin labels appear to be highly mobile as judged by continuous-wave EPR spectroscopy. Also, the secondary structure, and by implication the tertiary structure, of the MTSL-labeled p66 samples is the same as that of wild type p66 as judged by circular dichroism; see Figures S5 and S6, respectively)
Figure 3.
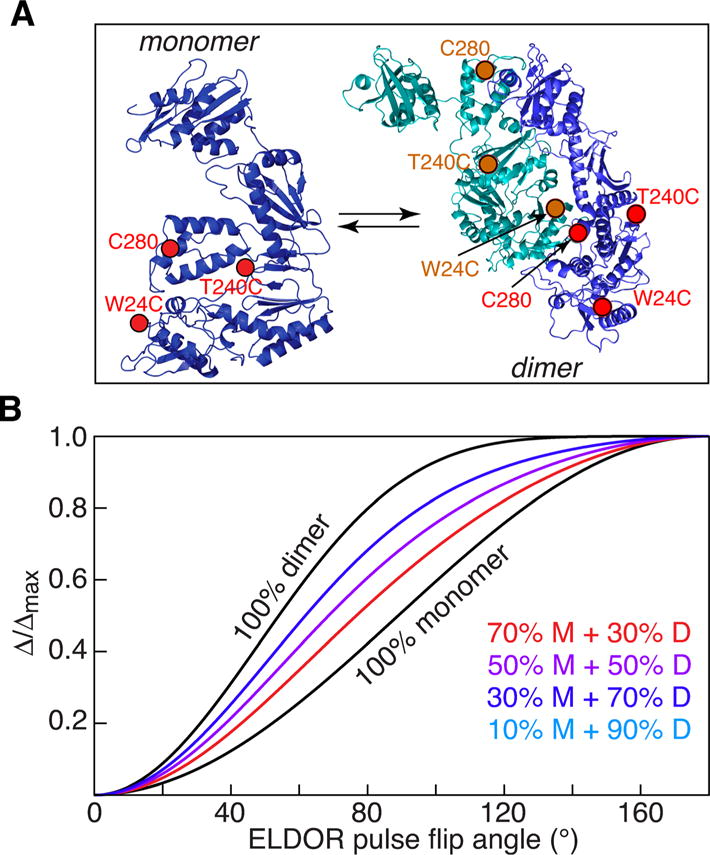
Monomer–dimer equilibrium for HIV-1 reverse transcriptase. A) Ribbon diagram of the p66 monomer and homodimer with the sites of MTSL labeling indicated. One subunit is shown in blue with the positions of the nitroxide labels in red, the other in cyan with the nitroxide labels in orange. Two doubly MTSL-labeled samples were prepared: W24C/C280 and T240C/C280. The coordinates of p66 are taken from the X-ray structure of the p66/p51 heterodimer with p66 in the open conformation (PDB 1DLO[17]). Note that the structure of the p66 dimer is unknown and the two subunits have been placed in the orientation observed in the p66/p51 heterodimer. B) Theoretical plots of normalized modulation depth (Δ/Δmax) versus ELDOR pulse flip angle for different fractions of monomer and dimer.
The theoretical curves of Δ/Δmax versus ELDOR pulse flip angle for various monomer/dimer populations is shown in Figure 3 B. Combined fits of the experimental (Δ/Δmax)obs versus ELDOR pulse flip angle for the two samples are shown in Figure 4. In 30% (v/v) glycerol the populations of monomer and dimer are 54±2 and 46±2%, respectively (Figure 4, top); in 50% (v/v) glycerol the fraction of monomer is increased still further to 65±2% with 35±2% dimer (Figure 4, bottom); these values correspond to equilibrium dissociation constants of 22 μM in 30% glycerol versus 45 μM in 50% glycerol. Thus, the presence of glycerol, which is essential for obtaining glassy, homogeneously frozen samples for EPR, has a profound effect on the monomer/dimer equilibrium of p66, and can be directly ascertained under the conditions of the EPR experiment. Subsequent analytical ultracentrifugation/sedimentation velocity experiments using these glycerol concentrations at room temperature (see Supporting Information Figure S7 and Table S1) are consistent with DEER EPR findings. (It should be noted that analytical ultracentrifugation at high glycerol concentrations is technically very challenging and far from routine for the reasons discussed in the Supporting Information.)
Figure 4.
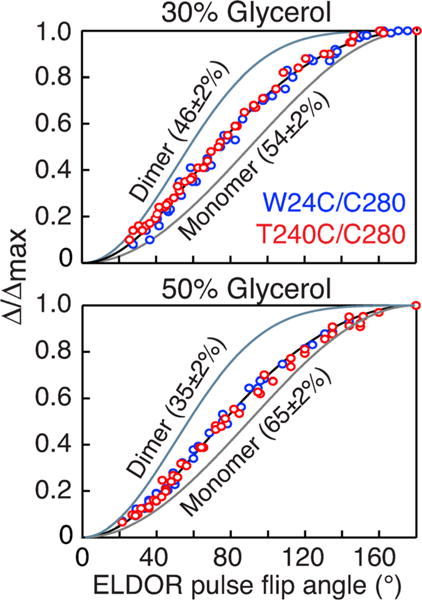
Populations of monomer and dimer for deuterated HIV-1 reverse transcriptase determined by inversion modulated DEER. DEER data were recorded in 30% (top) and 50% (bottom) d8-glycerol. The experimental data for the W24C/C280 and T240C/C280 doubly MTSL-labeled samples are shown as blue and red circles, respectively. The samples were 100%-MTSL labeled and ≈ 97% deuterated as determined by liquid chromatography-positive ion electron spray mass spectrometry (see Supporting Information). The best-fit curves obtained by simultaneously fitting the data for the W24C/C280 and T240C/C280 p66 samples using Equations (1) and (2) is shown as a black line, and the pure monomer and dimer theoretical curves are shown as grey and light blue lines, respectively. The experimental data were acquired at Q-band on a 50 μM sample (in subunits) of deuterated (≈ 97%) p66 in either 30 or 50% (v/v) d8-glycerol and D2O at 50 K. The buffer contained 25 mM Tris-HCl, pH 8, and 400 mM NaCl. For the W24C/C280 sample, 45 and 37 ELDOR flip pulse angles were used for the 30 and 50% (v/v) d8-glycerol samples, respectively; for the T240/C280 sample, the corresponding number of flip angles was 43 and 44, respectively. The total measurement time for each complete ELDOR pulse flip angle series was about 30 hrs. Full experimental details of sample preparation and data acquisition, including examples of raw and baseline corrected DEER curves are provided in the Supporting Information text and Figure S4.
The accuracy with which the monomer/dimer populations are determined is high (±2%). High signal-to-noise afforded by near-complete deuteration (which increases the spin-label phase memory relaxation time) and data acquisition at Q-band permit good accuracy for the measurement of Δ/Δmax in a reasonable measurement time. However, two other factors are absolutely critical for achieving high accuracy in the estimation of the relative monomer and dimer populations: first, the sampling of a large number of ELDOR pulse flip angle values (cf. Figure 2C and Figure 4), and second the combined analysis of data from two differently spin-labeled samples (Figure 4). In this instance, when data for only a single doubly spin-labeled sample of p66 are employed, the uncertainty in the estimation of monomer/dimer populations is increased to 10–15%. In addition, it is important to establish the extent of labelling independently by liquid chromatography-mass spectrometry. In the examples presented here, 100% MTSL-labeling was obtained. When labelling is less than 100%, the fractional labeling and the presence of two and three-spin dimeric species have to be taken into account when fitting the dependence of Δ/Δmax on ELDOR pulse flip angle, as described in the Supporting Information [Figure S2 and Eq. (S1)].
It should also be noted that under the DEER experimental conditions employed (fmax≈7–9 μs) the contribution of spin pairs separated by >80 Å to the dipolar evolution curve will be subsumed into the baseline B(t), and will therefore not contribute to Δ(θ)/Δmax. Care should therefore be taken when selecting positions to spin label that this condition holds. In the case of p66 the maximum distance is ≈60 Å (Figure S8).
In conclusion, we have demonstrated that accurate quantification of monomer/dimer populations can be obtained by inversion modulated DEER EPR spectroscopy under the same conditions used for distance analysis by DEER spectroscopy. Such information is critical for the quantitative analysis of DEER data involving monomeric, dimeric and higher-order multimeric species.
Supplementary Material
Acknowledgments
We thank Drs. R. Tycko and D. Murray for useful discussions; Drs. L. Tian and W. Yang for the plasmid of the p66 subunit of HIV reverse transcriptase; and Dr. J. Louis for MTSL-labeled protein A. This work was supported by funds from the Intramural Research Program of the National Institute of Diabetes and Digestive and Kidney Diseases, NIH, and from the Intramural AIDS Targeted Antiviral Program of the Office of the Director of the NIH (to G.M.C.).
Footnotes
Supporting Information and the ORCID identification number(s) for the author(s) of this article can be found under http://dx.doi.org/10.1002/cphc.201600726.
References
- 1.a) Milov AD, Salikhov KM, Shirov MD. Fiz Tverd Tela. 1981;23:975–982. [Google Scholar]; b) Milov AD, Ponomarev AB, Tsvetkov YD. Chem Phys Lett. 1984;110:67–82. [Google Scholar]; c) Larsen RG, Singel DJ. J Chem Phys. 1993;98:5134–5146. [Google Scholar]; d) Pannier M, Veit S, Godt A, Jeschke G, Spiess HW. J Magn Reson. 2000;142:331–340. doi: 10.1006/jmre.1999.1944. [DOI] [PubMed] [Google Scholar]
- 2.a) Shin YK, Levinthal C, Levinthal F, Hubbell WL. Science. 1993;259:960–963. doi: 10.1126/science.8382373. [DOI] [PubMed] [Google Scholar]; b) Hubbell WL, Altenbach C. Curr Opin Struct Biol. 1994;4:566–573. [Google Scholar]; c) Fanucci GE, Cafiso DS. Curr Opin Struct Biol. 2006;16 doi: 10.1016/j.sbi.2006.08.008. [DOI] [PubMed] [Google Scholar]; d) Jeschke G, Polyhach Y. Phys Chem Chem Phys. 2007;9:1895–1910. doi: 10.1039/b614920k. [DOI] [PubMed] [Google Scholar]; e) Altenbach C, Kusnetzow AK, Ernst OP, Hofmann KP, Hubbell WL. Proc Natl Acad SCi U S A. 2008;105:7439–7444. doi: 10.1073/pnas.0802515105. [DOI] [PMC free article] [PubMed] [Google Scholar]; f) Jeschke G. Ann Rev Phys Chem. 2012;63:419–446. doi: 10.1146/annurev-physchem-032511-143716. [DOI] [PubMed] [Google Scholar]
- 3.Salnikov ES, Erilov DA, Milov AD, Tsvetkov YD, Peggion C, Formaggio F, Toniolo C, Raap J, Dzuba SA. Biophys J. 2006;91:1532–1540. doi: 10.1529/biophysj.105.075887. [DOI] [PMC free article] [PubMed] [Google Scholar]
- 4.a) Bode BE, Margraf D, Plackmeyer J, Durner G, Prisner TF, Schie-mann O. J Am Chem Soc. 2007;129:6736–6745. doi: 10.1021/ja065787t. [DOI] [PubMed] [Google Scholar]; b) Jeschke G, Sajid M, Schulte M, Godt A. Phys Chem Chem Phys. 2009;11:6580–6591. doi: 10.1039/b905724b. [DOI] [PubMed] [Google Scholar]; c) Hagelueken G, Ingledew WJ, Huang H, Petrovic-Stojanovska B, Whit-field C, ElMkami H, Schiemann O, Jaismith JH. Angew Chem Int Ed Engl. 2009;48:2904–2906. doi: 10.1002/anie.200805758. [DOI] [PMC free article] [PubMed] [Google Scholar]; d) Ackermann K, Giannoulis A, Cordes DB, Slawin AM, Bode BE. Chem Commun (Camb) 2015;51 doi: 10.1039/c4cc08656b. [DOI] [PubMed] [Google Scholar]; e) Milov AD, Tsvetkov YD, Raap J, De Zotti M, Formaggio F, Toniolo C. Biopolymers. 2016;106:6–24. doi: 10.1002/bip.22713. [DOI] [PubMed] [Google Scholar]
- 5.Hilger D, Jung H, Padan E, Wegener C, Vogel KP, Steinhoff HJ, Jeschke G. Biophys J. 2005;89:1328–1338. doi: 10.1529/biophysj.105.062232. [DOI] [PMC free article] [PubMed] [Google Scholar]
- 6.a) Ward R, Bowman A, Sozudogru E, El-Mkami H, Owen-Hughes T, Norman DG. J Magn Reson. 2010;207:164–167. doi: 10.1016/j.jmr.2010.08.002. [DOI] [PMC free article] [PubMed] [Google Scholar]; b) Baber JL, Louis JM, Clore GM. Angew Chem Int Ed Engl. 2015;54:5336–5339. doi: 10.1002/anie.201500640. [DOI] [PMC free article] [PubMed] [Google Scholar]
- 7.Milov AD, Tsvetkov YD. Appl Magn Reson. 1997;12:495–504. [Google Scholar]
- 8.Johansson MU, de Chateau M, Wikstrom M, Forsen S, Drakenberg T, Bjorck L. J Mol Biol. 1997;266:859–865. doi: 10.1006/jmbi.1996.0856. [DOI] [PubMed] [Google Scholar]
- 9.Lapkouski M, Tian L, Miller JT, Le Grice SF, Yang W. Nature Struct Mol Biol. 2013;20:230–236. doi: 10.1038/nsmb.2485. [DOI] [PMC free article] [PubMed] [Google Scholar]
- 10.Sharaf NG, Poliner E, Slack RL, Christen MT, Byeon IJ, Par-niak MA, Gronenborn AM, Ishima R. Proteins. 2014;82:2343–2352. doi: 10.1002/prot.24594. [DOI] [PMC free article] [PubMed] [Google Scholar]
- 11.a) Chattopadhyay D, Evans DB, Deibel MR, Jr, Vosters AF, Eckenrode FM, Einspahr HM, Hui JO, Tomasselli AG, Zurcher-Neely HA, Heinrikson RL, et al. J Biol Chem. 1992;267 [PubMed] [Google Scholar]; b) Zheng X, Pedersen LC, Gabel SA, Mueller GA, Cuneo MJ, DeRose EF, Krahn JM, London RE. Nucl Acids Res. 2014;42:5361–5377. doi: 10.1093/nar/gku143. [DOI] [PMC free article] [PubMed] [Google Scholar]
- 12.Gouda H, Torigoe H, Saito A, Sato M, Arata Y, Shimada I. Biochemistry. 1992;31:9665–9672. doi: 10.1021/bi00155a020. [DOI] [PubMed] [Google Scholar]
- 13.Krivov GG, Shapovalov MV, Dunbrack RL., Jr Proteins. 2009;77:778–795. doi: 10.1002/prot.22488. [DOI] [PMC free article] [PubMed] [Google Scholar]
- 14.Polyhach Y, Bordignon E, Jeschke G. Phys Chem Chem Phys. 2011;13:2356–2366. doi: 10.1039/c0cp01865a. [DOI] [PubMed] [Google Scholar]
- 15.Brandon S, Beth AH, Hustedt EJ. J Magn Reson. 2012;218:93–104. doi: 10.1016/j.jmr.2012.03.006. [DOI] [PMC free article] [PubMed] [Google Scholar]
- 16.Jeschke G, Chechik V, Ionita P, Godt A, Zimmerman H, Banham JE, Timmel CR, Hilger D, Jung H. Appl Magn Reson. 2006;30:473–498. [Google Scholar]
- 17.Hsiou Y, Ding J, Das K, Clark AD, Jr, Hughes SH, Arnold E. Structure. 1996;4:853–860. doi: 10.1016/s0969-2126(96)00091-3. [DOI] [PubMed] [Google Scholar]
Associated Data
This section collects any data citations, data availability statements, or supplementary materials included in this article.


