

Abstract
RNA interference (RNAi) is a conserved cellular mechanism in most eukaryotes that can mediate specific gene silencing. Since its discovery in 1998, rapid progress has been made in understanding its basic mechanism and its application in research and drug discovery. In recent years, the application of RNAi in research, including research in neurodegeneration, has expanded rapidly such that it has become a regular tool for reverse genetics in cultured cells in many labs. However, an incomplete understanding of the RNAi mechanism and worries about its pitfalls still intimidate many others. Here, we present a streamlined and simple protocol for the design and implementation of an RNAi experiment in cultured cells, aiming to enable those who are inexperienced with RNAi to apply this powerful method in their research, particularly in the field of neurodegeneration.
Keywords: RNAi, shRNA, siRNA, miRNA, Gene silencing, Knockdown
1. Introduction
RNA interference (RNAi) is a conserved gene silencing mechanism in most eukaryotes (1, 2). Since the discovery and the subsequent revelation of this mechanism, RNAi has evolved into a highly effective means for reverse genetics. In mammalian cells, RNAi can be triggered by introducing (1) short double-stranded RNA (dsRNA) of 21 nucleotides in length (also known as small interfering RNA or siRNA), (2) a gene cassette driven by a promoter that synthesizes short hairpin RNA (shRNA), or (3) a gene cassette driven by a promoter that synthesizes primary microRNA (pri-miRNA), from which a precursor microRNA (pre-miRNA) is cut out by an RNase III complex composed of Drosha and DGCR8 (Figs. 1 and 2). Both shRNA and pre-miRNA are exported from the nucleus (see Fig. 2). In the cytoplasm, the siRNA, shRNA, or miRNA is further processed by other RNase III complexes composed of Dicer, TRPB, and AGO2, leading to the formation of RNA-induced silencing complex (RISC), which consists of a single-stranded RNA (called guide strand) and a complex of proteins (see Fig. 2). A key component in RISC is AGO2, which is an RNase III enzyme and has RNA slicer activity. In the RISC, the guide strand recognizes the target RNA by Watson-Crick base-pairing and directs the RISC to cleave the target RNA (see Fig. 2), thus destroying the target RNA and leading to gene silencing (2). Because of the simplicity and specificity of the RNAi mechanism, RNAi is increasingly employed in loss-of-function studies for understanding gene function in cells and in vivo. In almost every research article that investigates the role of a particular gene in neurodegeneration, RNAi is used to knockdown the specific genes under investigation, and the effect on neurodegeneration, either aggravation or alleviation, is observed. In this regard, RNAi has become an indispensible tool modern biomedical research, which includes the field of neurodegeneration. Particularly notable is that RNAi has become a highly useful method for target validation in developing therapeutic strategies ((3); see Note 1). In this chapter, we describe the basics in designing and conducting an RNAi experiment in cultured cells.
Fig. 1.
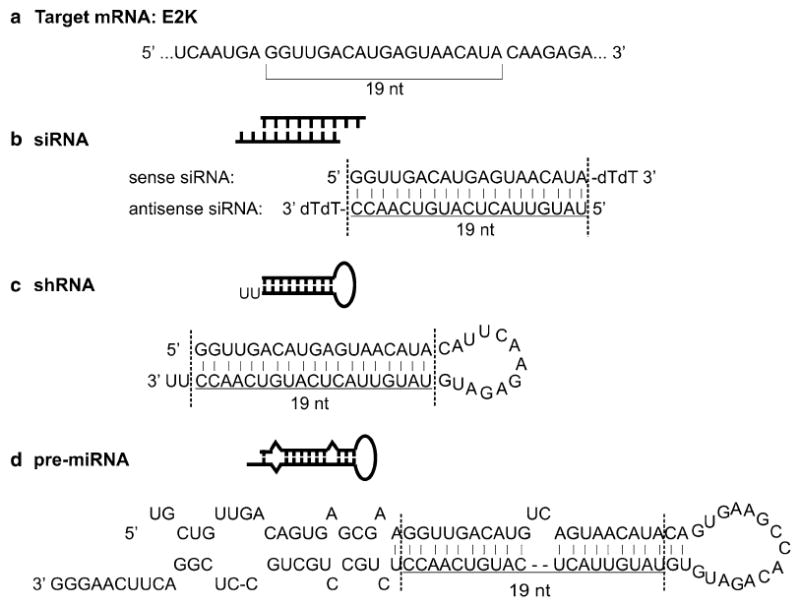
Examples of small RNAs that can be used to silence specific genes in cells. (a) The target sequence of 19nt within the target mRNA. E2k is a subunit of α-ketoglutarate dehydrogenase complex (KGDHC) and is used as an example of silencing target here (for more details, see ref. 4). Based on this target sequence, corresponding siRNA (b), shRNA (c), and pre-miRNA (d) are designed. See the text for more details.
Fig. 2.
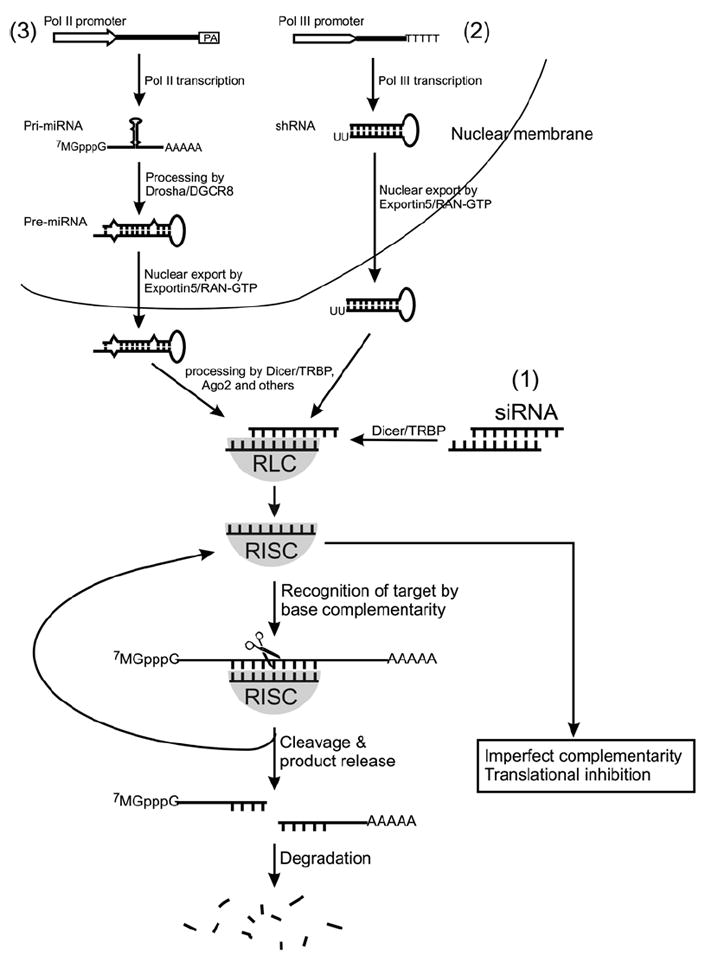
Three commonly used RNAi expression strategies: transfection of cells with (1) siRNA or constructs that synthesize (2) shRNA or (3) miRNA. RLC stands for RISC loading complex. RISC stands for RNA-induced silencing complex. See the text for more descriptions.
2. Materials
2.1. Making shRNA Constructs
Doubly distilled water.
Synthetic DNA oligonucleotides encoding shRNA (Integrated DNA Technologies, Standard desalting only).
2x DNA annealing buffer: 20 mM Tris–HCl (pH 7.6), 100 mM NaCl, 2 mM EDTA.
Cloning enzymes (all from New England Biolabs, Ipswich, MA): T4 DNA ligase, T4 polynucleotide kinase, PmeI, EcoRI, calf intestinal alkaline phosphatase.
Bacterial culture and transformation reagents: MAX Efficiency DH-5α competent cells (Invitrogen, Carlsbad, CA). S.O.C. medium (Invitrogen, Carlsbad, CA), LB broth (EMD Chemicals, Gibbstown, NJ), LB agar (EMD Chemicals, Gibbstown, NJ), LB plate with 30 μg/mL Kanamycin (Invitrogen).
Reagents for colony screen using PCR: forward primer 5′-ATATCCCTTGGAGAAAAGCCTT-3′, reverse primer 5′-GGCCGCGAACCAATGCA-3′, PCR master mix (Promega, Madison, WI).
100 bp DNA Ladder (Promega).
2.2. Making miRNA Constructs
Three synthetic PCR primers at 10 mM dissolved in distilled water. The sequences are based on the target gene sequence (see Subheadings 3.1 and 3.2 and Fig. 4).
PCR reagents: Platinum Pfx DNA Polymerase (Invitrogen, Carlsbad, CA) with 10x PCR buffer, 10 mM dNTP mixture (Promega, Madison, Wisconsin), 50 mM MgSO4.
Cloning enzymes: The same enzymes as listed in Subheading 2.1 item 5 replace the two restriction enzymes with two new ones: KpnI and XhoI.
PCR product purification kit (Qiagen, Valencia, CA).
Fig. 4.
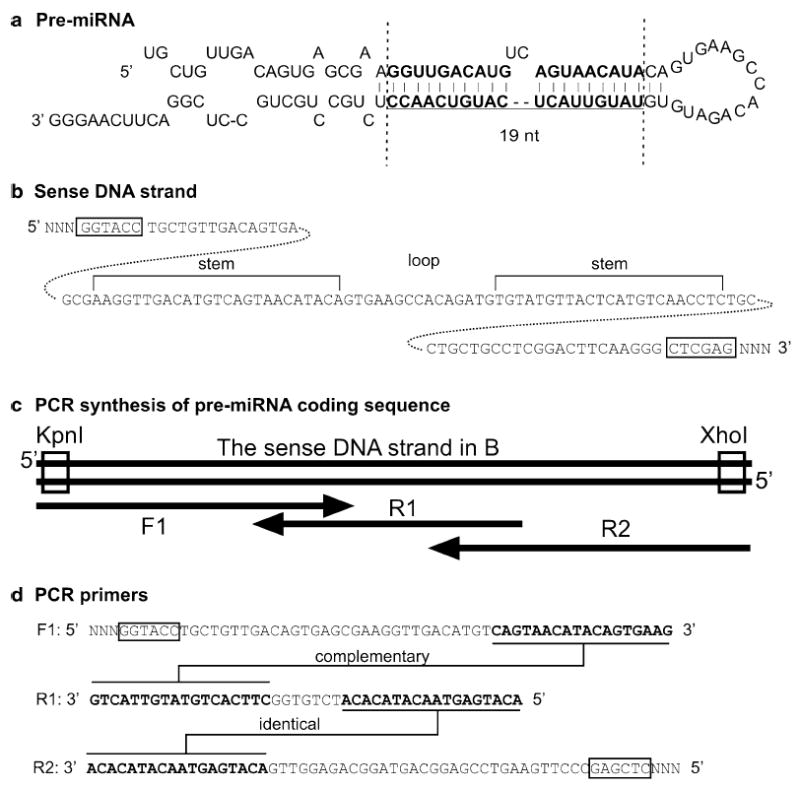
Design of an miRNA construct. (a) Plug in the 19nt siRNA core sequence into the pre-miRNA structure between the two dotted lines and keep the UC bulge in the sense strand in place. (b) Unfold the pre-miRNA sequence to a linear sequence. (c and d) Design three PCR primers covering the entire pre-miRNA sequence. Synthesize the double-stranded DNA by PCR and clone the sequence into the plasmid pCAG-RFP-miRint-KX. See the text for more descriptions.
2.3. Cell Culture and Transfection
Dulbecco’s modified Eagle’s medium (DMEM) (Invitrogen, Carlsbad, CA) supplemented with 10% fetal bovine serum (FBS, Invitrogen) and antibiotics (100 U of penicillin and 100 μg of streptomycin, Invitrogen).
25% Trypsin (Invitrogen) and 1 mM ethylenediaminetetraacetic acid (EDTA).
Lipofectamine 2000 (Invitrogen).
Opti-MEM I (Invitrogen).
2.4. Western Blot
Phosphate-buffered saline (PBS) (10x): 1.37 M NaCl, 27 mM KCl, 100 mM Na2HPO4, 18 mM KH2PO4 (adjust to pH 7.4 with HCl if necessary), and autoclave. Store at room temperature.
RIPA lysis buffer: 150 mM NaCl, 1.0% IGEPAL® CA-630, 0.5% sodium deoxycholate, 0.1% SDS, and 50 mM Tris–HCl, pH 8.0. Store at 4°C.
Halt Protease Inhibitor Cocktail (Thermo Scientific, Waltham, MA).
BCA Protein Assay Kit (Pierce, Rockford, IL).
4x Laemmli’s SDS sample buffer: 250 mM Tris–HCl (pH 6.8), 40% glycerol, 8% SDS, 0.02% bromophenol blue, and 8% beta-mercaptoethanol.
BioRad Protean II Mini gel system.
Separating buffer (4x): 1.5 M Tris–HCl, pH 8.7, 0.4% SDS. Store at room temperature.
Stacking buffer (4x): 0.5 M Tris–HCl, pH 6.8, 0.4% SDS. Store at room temperature.
40% acrylamide/bis solution (29:1) and N,N,N,N′-tetramethylethylenediamine (TEMED).
Ammonium persulfate: 10% solution in water. Store at 4°C and make fresh every month.
Gel running buffer (10x): 250 mM Tris–HCl, 1.920 M glycine, 1% (w/v) SDS. Store at room temperature.
Prestained protein molecular weight markers: Kaleidoscope markers (Bio-Rad, Hercules, CA).
Protran nitrocellulose membrane (Whatman, Piscataway, NJ).
Transfer buffer (1x): 25 mM Tris–HCl (pH 8.0), 192 mM glycine, and 10–20% methanol.
BioRad transblot apparatus.
PBST: 0.05% Tween 20 in PBS.
Blocking buffer: 5% milk in PBST.
Antibodies: primary antibody against the knockdown target protein and secondary antibody conjugated with horseradish peroxidase (HRP) (GE Healthcare Biosciences, Piscataway, NJ).
Enhanced chemiluminescent (ECL) reagents (Amersham, Piscataway, NJ).
Blot imaging apparatus: Fuji LAS 4000.
Stripping buffer (Thermo Fisher Scientific, Waltham, MA).
2.5. Northern Blot
Trizol Reagent (Invitrogen).
20x MOPS running buffer: 100 mM sodium acetate, 0.4 M MOPS (pH 7.0), 20 mM EDTA (pH 7.0). Store in dark at room temperature.
20x SSC buffer: 3 M NaCl, 0.3 M sodium citrate (pH 7.0). Store at room temperature.
1.5x loading buffer: 75% formamide, 7.5% formaldehyde (37%), 15% 10x MOPS running buffer, 20 μg/mL ethidium bromide. Best to make fresh each time.
Loading dye: Bromophenol blue in 35% glycerol and 1x running buffer.
Positively charged Nylon membrane (Hybond N+) (Amersham, Piscataway, NJ).
DIG probe kit (Roche, Indianapolis, IN): PCR DIG Probe Synthesis Kit, DIG Easy hyb, DIG block and wash buffer, CDP star.
UV crosslinker Stratalinker (Stratagene, LaJolla, CA).
HB-1000 Hybridizer (UVP LLC).
Blot imaging apparatus: Fuji LAS 4000.
2.6. Reverse Transcription and Quantitative PCR
SuperScript® III First-Strand Synthesis System (Invitrogen).
DNase I (Promega).
Sybr Green mix (Bio-Rad).
3. Methods
3.1. Design of siRNA, shRNA, and miRNA
3.1.1. Background
The three types of RNAi triggers, siRNA, shRNA, and miRNA, are all effective in silencing target genes and they often can be used interchangeably. siRNA is a simple small RNA duplex. The two strands are chemically synthesized separately and then annealed to form the siRNA. It can be efficiently delivered into many types of cells by standard transfection protocols. shRNA is synthesized from a gene construct as a single-stranded RNA, which folds to form shRNA (Figs. 1 and 2). Likewise, miRNA is also produced from a gene construct as a long, single-stranded RNA called pri-miRNA. Therefore, both shRNA and miRNA require the construction of plasmids. These plasmids also can be delivered into cells by standard transfection protocols. In general, the transfection efficiency of an siRNA is higher than constructs for shRNA and miRNA. siRNA can reach its highest concentration in cells immediately after transfection and does not require time to accumulate as shRNA and miRNA constructs do. Therefore, siRNA can trigger gene silencing more rapidly than shRNA and miRNA constructs. However, the use of shRNA and miRNA also has some advantages. These gene cassettes can be incorporated into viral vectors and used for making cell lines that have the gene silencing construct stably integrated. Therefore, these constructs may be used in experiments where long term, sustained gene silencing is required.
The purpose of siRNA design is to select siRNAs with potent knockdown efficiency and minimal off-target effects. This can be achieved based on predefined siRNA sequence features and experiments testing the knockdown efficacy. It is important to keep in mind that at present no rational design guarantees a perfect siRNA. Therefore, designing multiple siRNAs and empirically testing them are essential. A time-saving approach is to purchase siRNAs and constructs that produce shRNA or miRNA targeting specific genes from commercial sources, some of which offer warranty for a certain degree of knockdown of the target. For targets that one cannot find a commercial source, or if the investigator prefers to design and make their own siRNA, we offer the following procedure.
3.1.2. Designing siRNA
The first step in designing siRNA is to identify the target gene sequence. It is preferred to use the RefSeq of the target gene from NCBI, since the RefSeq collection provides nonredundant, curated, and most reliable sequences. The targeted region of the gene should be located within the open reading frame (ORF) between 50 and 100 nt downstream of the start codon and the stop codon. The UTRs and the beginning of the ORF often bind to regulatory factors and may be less accessible by the RISC. However, this should not be regarded as an absolute limit since highly efficient knockdown has been reported with siRNAs directed against the other regions, including 3′UTRs. Once the target region is identified, target sequences for RNAi can be selected using one or several siRNA design algorithms that are accessible online (see http://i.cs.hku.hk/~sirna/software/sirna.php; ref. 5).
Each siRNA duplex contains a sense strand and an antisense strand. The antisense strand complements the sequence in the target cDNA or mRNA (see Fig. 1). Each strand of an siRNA duplex is 21 nt long, of which the 5′ 19 nucleotides complement each other and match the target gene sequence. The 3′ end two nucleotides of each strand are TT, which are not required to match the target sequence and constitute the overhang of siRNAs (see Fig. 1). To select the 19nt target sequence, follow some general rules (5, 6). Select sequences with a GC content between 30 and 60%. Avoid sequence repeats, sequences with low complexity, single nucleotide polymorphism (SNP) sites, sequence stretches of four or more bases, such as AAAA, CCCC, strings of six or more G and C (e.g. GGCGCC) or G and T (e.g. GGTTGT) and sequences containing palindromes, which may form unwanted hairpin structures. Use RNA folding software, such as RNAfold (http://rna.tbi.univie.ac.at/cgi-bin/RNAfold.cgi) to explore possible secondary structures and exclude sequences with undesirable folds. Exclude sequences containing GTCCTTCAA, TGTGT, and CTGAATT, known to induce immune response (7–9). Select sequences with asymmetric thermostability in a manner that the three nucleotides at the 3’ end of the sense strand has less G and C than its 5’ end. Select two to six target sequences for each target gene. Design a negative control siRNA by scrambling targeted siRNA sequence so that it has the same length and nucleotide composition as the target sequence but contains at least four to five mismatches spread throughout the siRNA. Perform BLAST homology search to avoid sequences that share a certain degree of homology with nontargeted genes to minimize off-target silencing effects. It is particularly important to avoid a perfect or near perfect homology of the seed region (the six to eight bases at the 5′ end of the two siRNA strands) with any nontarget genes.
The online algorithms adopt the general rules stated above and some incorporate additional rules derived from their experimentally tested siRNAs. One should check what rules are incorporated in the algorithm and check the siRNA against the rules that are not applied. Once the siRNAs are designed, they can be ordered from many commercial sources and used directly in experiments (see Subheading 3.3). The siRNA sequence can also be incorporated into shRNA or miRNA expression constructs (see below). However, it is not guaranteed that a highly efficient siRNA remains as efficient when its sequence is transplanted into an shRNA or miRNA. Therefore, we advise making multiple constructs and then selecting the most efficient ones to use by measuring the target knockdown.
3.1.3. Designing shRNA
Each shRNA has a stem and a loop. The stem contains the 19nt sense and antisense strands of an siRNA. The antisense strand complements the target mRNA sequence (see Fig. 1a). Pol III promoters, such as U6 and H1, are commonly used to drive the shRNA synthesis. Both promoters have defined initiation nucleotide, a G for U6 and an A for H1. The transcription terminates at a string of four or more Ts. To design an shRNA, insert the 19nt target siRNA sequence after the initiation nucleotide, connect the sense and antisense strands with a loop sequence of CAUUCAAGAGAUG and add six Ts at the 3′ end of the antisense strand (see Fig. 3c). Synthesize the two strands of DNA encoding the shRNA with appropriate restriction enzyme sites at both ends (see Fig. 3c) and clone the sequence behind the Pol III promoter in a DNA plasmid (see Subheading 3.2).
Fig. 3.
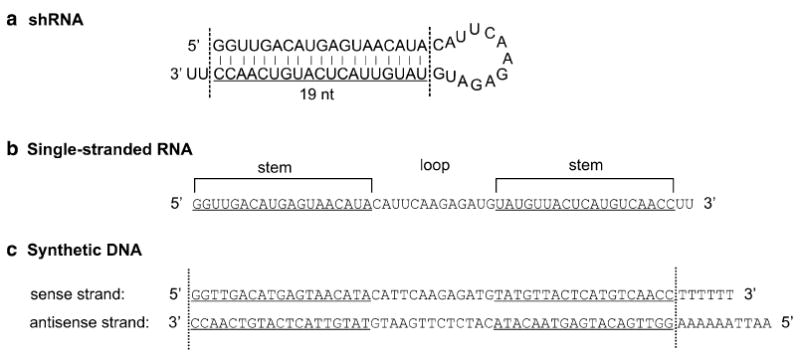
Design of an shRNA construct. (a) Plug in the 19nt siRNA core sequence into the shRNA structure between the two dotted lines. (b) Unfold the hairpin sequence to a linear sequence. (c) Convert the linear sequence to a double-stranded DNA and add 6 Ts at the 3′ of the sense strand and 6 As plus TTAA at the 5′ of the antisense strand. This double-stranded DNA can be ligated into the plasmid pEGFP-U6. See text for more description. Note that the 5′ of the sense strand must be a “G”. If an siRNA does not have a “G” at this 5′ end, this base can be replaced with a G.
3.1.4. Designing miRNA
The expression of miRNAs is usually driven by a Pol II promoter, although Pol III promoters can also work (10). One advantage of using Pol II promoter is that a marker protein can be expressed under the control of the same promoter that drives miRNA expression (4, 11). The miR30a structural features are commonly employed in designing miRNAs (see Fig. 1d). To express an miRNA, a pre-miRNA has to be designed and inserted into the expression plasmid (see Fig. 4). To design your pre-miRNA, replace the 19nt sequence between the two vertical lines in Fig. 4a with your 19nt core siRNA sequence. Keep the UC bulge in the sense strand in place. Maintain the rest of the miRNA sequence the same as in Fig. 4a. Transform this whole miRNA sequence to a linear DNA sequence and use this as the sense strand (see Fig. 4b). Add the antisense strand and cloning restriction sites (see Fig. 4b, c). The exact steps of making this construct are described below in Subheading 3.2b.
3.2. Making shRNA and miRNA Constructs
3.2.1. Making shRNA Constructs
Order two strands of synthetic DNA oligonucleotides encompassing the entire shRNA and the restriction sites PmeI and EcoRI (Fig. 3c).
Anneal the two shRNA oligonucleotide strands: To a 1.5-mL microtube, add 100 μL 2x DNA annealing buffer, 90 μL water, and 10 μL of each oligo (250 μM). Heat the tube with boiling water in a beaker for 5 min. Cool slowly to room temperature by leaving the beaker on bench top for 1 h. The annealed oligonucleotides will have appropriate overhangs for ligation.
Add phosphate to the shRNA oligo: To a new 1.5-mL micro-tube, add 10 μL of the annealed oligo pair (from step 2), 5 μL of 10x T4 DNA ligase buffer, and 2 μL of T4 polynucleotide kinase. Adjust the volume to 50 μL using H2O. Incubated at 37°C for half an hour.
Digest the expression vector pEGFP-U6 with PmeI and EcoRI: To a 1.5-mL microtube, add 15 μL of 10x NEBuffer 4, 1.5 μL of 100 μg/mL bovine serum albumin (BSA), 4 μg of the vector DNA, 2 μL of 10,000 units/mL PmeI, 2 μL of 20,000 units/mL EcoRI, and H2O to a final volume of 150 μL. Incubate the reaction at 37°C for 1 h. Dephosphorylate the digested vector as follows: To the above digestion reaction tube, add 2 μL of calf intestinal alkaline phosphatase, incubate at 37°C for 1 h. The vector DNA can be purified using the PCR purification kit with a final volume of 80 μL. Determine the concentration of the purified vector by OD measurement.
Ligate the shRNA oligo into the digested vector as follows: To a 1.5-mL microtube add 2 μL of 10x T4 DNA ligase buffer, 100 ng of vector DNA (from step 4), 3 μL of the hairpin insert (from step 3), and 2 μL of T4 DNA ligase. Adjust the volume to 20 μL using H2O and incubate at room temperature for 15 min. Move the tube on ice.
Transformation: Add 50 μL of thawed MAX Efficiency DH-5α competent cells to each prechilled 17 × 100 mm polypropylene tube on ice and 2 μL of the ligation mix (from step 5). Mix gently by tapping the tube. Incubate on ice for 30 min. Heat-shock the cells in a 42°C water bath for 45 s. Put the cells on ice for 2 min. Add 0.9 mL of SOC medium that has been warmed to room temperature to the tube and shake the tube at 225 rpm and 37°C for 1 h. Spread 20–200 μL of cells on LB plate with 30 μg/mL kanamycin and incubate the plates overnight at 37°C.
PCR screening of colonies: Pick five to ten colonies for each shRNA construct. Each PCR reaction contains 1 μL of 10 μM forward and reverse primers and 10 μL PCR master mix. Adjust the volume to 20 μL by adding H2O. Use a micropipette tip to pick up cells from single colonies and dip the tip in the PCR tube. PCR reaction is programmed as follows: 5 min at 95°C, followed by 35 cycles of 95°C for 30 s, 56°C for 30 s and 72°C for 1 min. Check the PCR products on a 2% agarose gel. You can see three PCR products: 121 bp from the blank vector control, 91 bp from the self-ligation products and 148 bp from the vector with shRNA insert (91 bp + 57 bp insert). Pick two to four positive colonies for each construct for plasmid DNA preparation and sequence verification.
3.2.2. Making miRNA Constructs
The miRNA constructs can be made using the same steps as the shRNA constructs as described above. The only difference is to synthesize the sense and the corresponding antisense DNA strands based on the pre-miRNA sequence as shown in Fig. 4a–c, with the addition of overhangs matching the appropriate restriction enzyme cleavage sites at the two ends (see Fig. 4c). Order the two synthetic DNA strands and anneal them as described above. You can clone the annealed DNA sequence behind the Pol III promoter, in which case you will need overhangs matching PmeI and EcoRI restriction sites, or behind a Pol II promoter in the plasmid pCAG-RFP-miR-int-KX (see Note 2), in which case you will need the overhangs matching KpnI and XhoI restriction sites. The cloning steps are the same as described in Subheading 3.2a. We prefer a PCR method to synthesize the DNA encoding the pre-miRNA and clone it behind a Pol II promoter in pCAG-RFP-miRint-KX plasmid, as described below:
Design two strands of synthetic DNA oligonucleotides encompassing the entire pre-miRNA and the restriction sites KpnI and XhoI (Fig. 4a–c).
Order three strands of oligonucleotide primers, one forward (F1) and two reverse (R1, R2), as shown in Fig. 4c, d. Primer F1 has a Kpn1 site and primer R2 has an Xho1 site at their 5′ end. Primers F1 and R1 have 18 complementary nucleotides at their 3′ ends. Primers R1 and R2 have 18nt overlapping sequence.
Obtain the full-length pre-miRNA sequence by PCR amplification: Add the following components to an autoclaved micro-centrifuge tube on ice: 5 μL 10x PCR buffer, 1 μL MgSO4 (50 mM), 3 μL oligo F1 (10 mM), 1 μL oligo R1 (10 mM), 3 μL oligo R2 (10 mM), 1 μL dNTP mixture (10 mM), 0.5 μL Platinum Pfx DNA Polymerase (2.5 U/μL). Adjust the volume to 50 μL by adding H2O. PCR using the program: 2 min at 94°C, followed by 35 cycles of 94°C for 30 s, 55°C for 30 s, 72°C for 30 s. Store the reaction at 4°C after cycling or at −20°C until use.
Insert the PCR product into the pCAG-RFP-miRint-KX (see Note 2): Digest the PCR product (from step 3) and the pCAG-RFP-miRint-KX vector with Kpn1 and Xho1 according to the enzyme manufacture’s instructions. Ligate the PCR products into the digested vector as follows: In a 1.5-mL microtube, add 1 μL of 10x T4 DNA ligase buffer, the digested PCR product (the insert) and 100 ng of the digested vector DNA, and 1 μL of T4 DNA ligase. The amount of the insert added should be such that the molar ratio of the insert to the vector is 3 to 1. Adjust the volume to 10 μL using H2O and incubate at room temperature for 15 min. Move the tube on ice.
Transformation: Add 50 μL of thawed MAX Efficient DH-5α competent cells (Invitrogen) to the 10 μL ligation mixture (from step 4). Mix gently by tapping the tube. Incubation on ice for 5 min. Heat-shock the cells in a 37°C water bath for 45 s. Put the cells on ice for 5 min. Spread all cells on LB plate with 100 μg/mL ampicillin and incubate the plates overnight at 37°C.
PCR screening of colonies: Pick five to ten colonies for each miRNA construct. Each PCR reaction contains 2 μL 10x PCR buffer, 0.8 μL MgSO4 (50 mM), 0.8 μL oligo F1 (10 μM), 0.8 μL reverse primer (10 μM, binding on the vector), 0.5 μL dNTP mixture (10 mM), and 0.25 μL Taq DNA polymerase (2.5 U/μL). Adjust the volume to 20 μL by adding H2O. Use a micropipette tip to pick up cells from single colonies and dip the tip in the PCR tube. PCR using the program as follows: 2 min at 94°C, followed by 35 cycles of 94°C for 30 s, 55°C for 30 s, 72°C for 30 s. Check the PCR products on a 2% agarose gel. Pick two to four positive colonies for each construct for plasmid DNA preparation and sequence verification.
3.3. Testing siRNA, shRNA, and miRNA Constructs
Once the constructs are obtained, they have to be tested to determine which construct works the best and whether it meets your knockdown requirement. The most direct way of achieving this is to transfect your constructs into cultured cells that express your target gene and measure the target gene expression in the transfected cells. You can determine the levels of the target gene expression by Western blot for the protein expression and Northern blot or reverse transcription PCR (RT-PCR) for the mRNA expression. It is important to use cells with high transfection efficiency, which determines the upper limit for the detection of knockdown. We prefer cells that can be transfected with 70% or higher transfection efficiency. A good construct is expected to knock down the target by 80% or more. If the transfection efficiency is 70%, an 80% knockdown will allow you to detect maximally a ~60% reduction in your target expression. For siRNAs, transfection efficiency is usually not a problem since it can be transfected into most cell types with high efficiency. For shRNA and miRNA constructs, the transfection efficiency could be a problem. However, this problem can easily be monitored by employing plasmids that express a marker, such as green fluorescent protein (GFP) or red fluorescent protein (RFP). If cells that express the target gene are not available or if they are available but transfected too poorly to be useful, alternative approaches are available (see Notes 3 and 4).
3.3.1. Transfecting Cells
Choice of cells: The commonly used cells that are easily transfectable are the best to use. We routinely use human cell lines, such as HEK293 and HeLa, and mouse cell lines, such as NF-1, N2a and NSC-34. Below we describe our protocol using NSC-34 cells because these cells are frequently used in neurodegeneration research. This is a cell line derived by fusion of mouse primary motor neurons and a mouse neuroblastoma cell line (12). The transfection efficiency is lower than the other cell types listed above. Therefore, the protocols described below can easily be applied to the other cell types.
Prepare cells as follows: Warm the culture medium (DMEM plus 10% FBS, 100 U penicillin and 100 μg of streptomycin) in an incubator to 37°C. Spray and wipe all tubes and bottles with 70% EtOH. Quickly thaw one vial frozen cells in a 37°C water bath. Add 1 mL medium to the tube of cells. Gently mix and transfer the cells from the vial with a pipette to a 15-mL tube. Add 5-mL pre-warmed medium, mix and centrifuge at 400 × g for 3 min. Remove the medium. Add 1 mL fresh medium to the cell pellet and resuspend the cells by pipetting up and down until no clumps are visible. Add an additional 10 mL prewarmed medium, mix and transfer the cells to a T25 flask. Incubate at 37°C till confluence, which usually takes approximately 3 days.
Splitting and plating cells: Aspirate old medium from confluent cell flask and wash cells once with 10 mL warm Dulbecco’s Phosphate-Buffered Saline (DPBS) without calcium. Aspirate the DPBS, add 1 mL 0.5% trypsin to cells and swirl over cells for about 3 min. Add 5 mL of fresh medium to the flask and resuspend cells in the medium by pipetting up and down until no clumps are visible. Pipette the cells into a 15-mL tube. Apply desired amount of cells and proper amount of medium to a new flask (splitting ratio at 1:10) or 6-well plates (1–2 × 10⁶ cell per well).
Transfect the cells with siRNA, shRNA, or miRNA constructs using Lipofectamine 2000 (Invitrogen) according to manufacture’s instructions (see Note 5). We routinely use the following procedure: Plate 1–2 × 10⁶ cells in 2 mL medium in each of the wells in a 6-well plate. The cells will grow to 90–95% confluency by the next day. Before the transfection, change medium to DMEM plus 5% FBS without antibiotics and incubate for 1 h. Aspirate the medium and apply to the cells 500 μL transfection medium containing 100 pmol μL siRNA or 4 μg plasmids encoding miRNA or shRNA, and 5 μL (for siRNA) or 10 μL (for plasmids) Lipofectamine 2000 in opti-MEM I. Incubate at 37°C in a CO2 incubator for 48–72 h. The cells are harvested for protein or RNA extraction to determine the levels of knockdown.
3.3.2. Determining Protein Knockdown Using Western Blot
To extract the protein, remove media from the culture plates. Wash cells twice with cold PBS. Carefully soak up any extra PBS with a piece of filter paper. Add 50 μL of RIPA lysis buffer with 1x protease inhibitor to each well. Use a cell scraper to lift the cells from the bottom of the well. Pass cell lysate through a pipette 20 times to form homogeneous lysate. Transfer lysate to 1.5-mL microcentrifuge tube. Allow samples to stand for 5 min on ice. Centrifuge the resulting mixture at 14,000 × g for 10 min at 4°C to separate cell debris from protein. Transfer the supernatant to a new tube for use or store at −80°C.
Take an aliquot of the lysate and measure the protein concentration with BCA Protein Assay Kit (Pierce) based on the manufacturer’s instructions.
Depending on the abundance of the protein being detected, mix 5–100 μg protein with 4x Laemmli’s SDS sample buffer and boil for 5 min. Clear the mixture by a brief (~10 s) centrifugation at the top speed of a microcentrifuge.
We routinely use the Protean II Mini gel apparatus for SDS-PAGE. Assemble the gel plates according to manufacturer’s instructions. Make the gel mix (for a single 10% separation gel) by mixing 2 mL 40% acrylamide/bisacrylamide (29:1 mixture), 2 mL 4x separation gel buffer and 3.87 mL water. Just before pouring the mix, add 12 μL TEMED and 120 μL 10% ammonium persulfate. Mix and pour immediately to ~1 cm below the anticipated bottom of the wells. Gently add a ~2 mm thick layer of 75% ethanol on top of the gel to block exposure to air and maintain a smooth top edge of the separation gel. Let the gel polymerize for ~15–30 min.
Make the 5% stacking gel mix by mixing 0.5 mL 40% acrylamide/bisacrylamide (29:1 mixture), 1 mL 4x stacking gel buffer and 2.5 mL water. After the separation gel is solidified, pour off the ethanol layer and wash 2x with water. Add 8 μL TEMED and 50 μL 10% ammonium persulfate to the stacking gel mix, immediately mix and pour on top of the separation gel using a pasture pipette. Insert the comb gently and leave it to polymerize 10 min. Assemble the electrophoresis unit and immerse it in SDS gel running buffer.
Flush the wells clear with gel running buffer. Load the protein samples (from step 3) and 10 μL kaleidoscope prestained standards to the wells with long gel-loading tips. Run through the stacking gel with constant voltage at 60 V and increase the voltage to 80 V after the bromophenol blue enters the separation gel. Run the gel about 2 h until the dye has migrated to the bottom of the gel.
While the gel is running, cut a piece of nitrocellulose membrane and two pieces of Waterman filter paper to the same size as the gel (5.5 cm × 8.5 cm). Soak the membrane and sponges in 1x gel transfer buffer for 1 min.
Disassemble the gel from the gel running apparatus and soak the gel and the Waterman filter papers briefly in 1x gel transfer buffer.
Assemble “sandwich” for the transblot apparatus as follows (from the negative to the positive pole): sponge, filter paper, gel, membrane, filter paper, sponge. Transfer with a cold pack at 100 V and 4°C for 1 h.
Remove the membrane from the sandwich and wash briefly in PBS. Remove any small pieces of the gel that might stick to the membrane.
Incubate the membrane in blocking buffer for 1 h at room temperature. Change to the blocking buffer with the primary antibody and incubate at 4°C overnight. Wash membrane three times with PBST for 10 min each. Incubate with secondary antibody conjugated to HRP in blocking buffer for 1 h at room temperature. Wash membrane three times with PBST for 10 min each. All the incubation and washing steps should be carried out with gentle agitation.
Detection of the knockdown target protein: Remove the ECL detection reagents from storage at 4°C. Mix 1 mL detection solutions A and 1 mL solutions B. Drain the excess wash buffer from the washed membranes and place protein side up on a sheet of SaranWrap. Pipette the mixed detection reagent on to the membrane. Incubate for 2 min at room temperature. Drain off excess detection reagent by holding the membrane gently with forceps and touching the edge against a piece of filter paper. Place the blots protein side down on to a fresh piece of SaranWrap, wrap up the blots and gently smooth out any air bubbles. Image the blot with fuji LAS 4000 or another imaging machine.
To confirm the equal loading, strip the blot if necessary with stripping buffer for 10 min with agitation. Wash the membrane with PBST and blot for tubulin or another housekeeping protein as described in steps 11 and 12.
Quantify the levels of the target protein using ImageJ or other imaging software and normalize it to the levels of the house keeping protein.
3.3.3. Determining RNA Knockdown Using Northern Blot
Make probes: Select a unique segment between 200 and 1,000 bp in length from the target RNA sequence, design a pair of PCR primers to make the DIG labeled-DNA probe by PCR using a PCR DIG Probe Synthesis Kit (Roche). Add to an autoclaved microcentrifuge tube on ice: 5 μL 10x PCR buffer with MgCl2 (vial 3), 2 μL forward primer (10 μM), 2 μL reverse primer (10 μM), 5 μL PCR DIG Probe Synthesis Mix (vial 2), 0.75 μL Enzyme mix (vial 1), and template DNA (1–50 ng genomic DNA or 10–100 pg plasmid DNA). Adjust the volume to 50 μL by adding water. PCR using the program: 2 min at 94°C, followed by 35 cycles of 94°C for 30 s, 60°C (or the annealing temperature of the primers) for 30 s, 72°C for 40 s. Use 5 μL of the reaction mixture to check the results of the reaction on an agarose gel. Store the reminder of reaction at −20°C.
Extract RNA from the cells using the Trizol reagent as follows: Remove media from 6-well plates and wash cells once with ice-chilled PBS. Carefully soak up any extra PBS with a filter paper. Add 1 mL of TRIZOL Reagent to each well and scrape with cell scraper. Pass the cell lysate several times through a pipette. Transfer lysate to 1.5 mL microcentrifuge tube. Leave the samples at room temperature for 5 min. Add 0.2 mL of chloroform per 1 mL of TRIZOL reagent. Cap sample tubes securely. Vortex samples vigorously for 15 s and incubate them at room temperature for 2–3 min. Centrifuge the samples at 12,000 × g at 4°C for 15 min. Transfer upper aqueous phase carefully without disturbing the interphase into new 1.5-mL tube. Add 0.5 mL of isopropyl alcohol per sample. Incubate samples at room temperature for 10 min and centrifuge at 12,000 × g at 4°C for 10 min. Remove the supernatant completely. Wash the RNA pellet with 1 mL 75% ethanol. Mix the samples by vortexing and centrifuge at no more than 7,500 × g at 4°C for 5 min. Repeat above washing procedure once. Remove all leftover ethanol. Air-dry RNA pellet for 5–10 min and dissolve RNA with 15 μL nuclease free water. Store the RNA at −80°C.
Measure RNA concentration: Dilute 1 μL of RNA with 99 μL of nuclease free water (1:100 dilution). Measure OD at 260 nm and 280 nm to determine sample concentration and purity. The A260/A280 ratio should be above 1.6. Apply the convention that 1 OD at 260 equals 40 μg/mL RNA.
Prepare and run a denaturing RNA gel: To prepare a 200 mL, 0.9% agarose formaldehyde gel, dissolve 1.8 g agarose in 170 mL water in a 65°C water bath, add 10 mL formaldehyde (37% stock), and 20 mL 10x MOPS running buffer. Pour the gel to about 0.6 cm thick in a fume hood and let it polymerize for ~15 min. Mix 10 μg RNA with 1.5x loading buffer and incubate at 65°C for 5 min. Cool on ice. Then, add 2 μL loading dye. Prerun gel at 5 V/cm for in 1x MOPS running buffer 5 min. Load samples and run with the same voltage until the bromophenol blue dye reaches the bottom of the gel (2.5–3.5 h for a 10 cm long gel). Soak the gel three times for 5 min each in distilled water to remove the formaldehyde. Photograph gel on a UV box.
Transfer to nitrocellulose membrane: Cut nitrocellulose membrane and eight pieces of Waterman filter paper to the same size as the gel and soak in 5x SSC. Assemble transfer stack as follows: Fill a glass tray with 500 mL 5x SSC. Place a glass plate across the top of the glass tray. Place a wet filter paper bridge on top of the glass plate, and let the two sides drop into the 5x SSC below. Put the following layers on top of the paper bridge on the glass plate: three pieces of wet filter paper, the gel, the wet nitrocellulose membrane, two pieces of wet filter paper, three pieces of dry filter paper and ~15 pieces of dry paper towel. Place another glass plate and weight (150–200 g) on top of this stack. Let transfer for ~3 h or longer.
Cross-link the RNA to the nitrocellulose membrane by place it on a new piece of filter paper wet with 5x SSC in a UV cross-linker (Stratalinker) and use auto-cross-link with 1200 J. Remove the membrane and soak for about 10 s in 1x MOPS buffer to remove excess salt and agarose.
Hybridization and detection of the target RNA: Place the membrane in a hybridization tube. Prehybridize with 4.5 mL DIG Easy hybridization solution (Roche) for about 1 h at 50°C with gentle rotation in a hybridization oven (HB-1000 Hybridizer from UVP LLC). Boil 250 ng of DIG labeled-DNA probe (from step 1) in 0.5 mL of DIG Easy hybridization solution for 5 min. Chill quickly in ice-cold water. Add the probe to the hybridization solution in the hybridization tube and let hybridize at 50°C overnight. Wash the membrane twice with 125 mL 2x SSC plus 0.1% SDS at room temperature for 5 min each. Wash the membrane twice in 125 mL 0.1x SSC plus 0.1% SDS (preheated to 68°C) at 68°C with gentle agitation for 15 min each. Rinse the membrane in 1x DIG washing buffer for 1 min. Block the membrane in 50 mL 1x block buffer (5 mL 10x DIG Maleic acid buffer, 5 mL 10x DIG block buffer and 40 mL H2O) with rocking for at least 1 h. Add 5 μL Anti-DIG anti-body to blocking buffer (1:10,000) and incubate at room temperature with rocking for 30 min. Wash membrane twice in 50 mL DIG washing buffer with rocking for 15 min each. Equilibrate the membrane in 10 mL DIG detection buffer for 5 min. Place the membrane with DNA side facing up on a developing folder (or hybridization bag) and apply 1 mL CDP-star working solution. Immediately cover the membrane with the second sheet of the folder and spread the solution evenly without any bubbles on the membrane. Incubate at room temperature for 5 min. Squeeze out the excess liquid and seal the folder completely. Image the membrane with fuji LAS 4000.
Strip the blot if necessary by washing the membrane in boiling 0.1% SDS for 5 min, pour off the washing solution, and then wash with 2x SSC at room temperature.
Probe the membrane with an 18S or 7S rRNA or any other housekeeping gene probe as a loading control using the same steps 1–7. Quantify the bands using imageJ.
3.3.4. Determining RNA Knockdown Using Reverse Transcription and Quantitative PCR (RT-qPCR)
Treat RNA samples (from Subheading 3.3) with DNase: To a microtube, add 2 μL 10x reaction buffer, ten units of RNase-free DNase, 20 μg of RNA, and H2O to a final volume of 20 μL. Incubate at 37°C for 60 min. Add 2 μL of DNase stop solution to terminate the reaction followed by incubation at 65°C for 10 min to inactivate the DNase.
cDNA synthesis: To a microtube, add 2.0 μL RNA from step 1, 1 μL of Oligo (dT)20 (50 μM), 1 μL of dNTPs (10 mM each) and 6 μL of RNase-free H2O. Incubate at 65°C for 5 min. Move the tube on ice for at least 1 min. In parallel, set up two negative controls, NTC (no template RNA), and NoRT (no reverse transcriptase).
Continue the cDNA synthesis: To the tubes from step 2, add 2 μL 10x RT buffer, 4 μL 25 mM MgCl2, 2 μL 0.1 M DTT 1 μL RNaseOUT (40 U/μL), and 1 μL of SuperScript III RT (200 U/μL). Mix well followed by a brief spin. Incubate at 50°C for 50 min followed by 85°C for 5 min to terminate the reaction. Chill on ice.
Quantitative PCR: The reactions for the target gene and one to two house-keeping genes (as internal controls) should be carried out in parallel. To a microtube, add 2 μL cDNA from step 3, 1 μL forward and reverse primer (10 μM each), 15 μL of Sybr Green mix, and 12 μL of H2O. PCR using the program: 3 min at 95°C, followed by 40 cycles of 15 s at 95°C, 30 s at 56°C (2–5°C below Tm, see Note 6), and 30 s at 72°C.
Quantify knockdown: Derive the Ct values from the PCR data with the threshold set near the middle of the linear range on a log scale. For each sample, calculate the ΔCt by subtracting the Ct value for an internal control. Subtract the ΔCt from the knockdown samples from the control sample (from cells transfected with nonspecific siRNA, shRNA, or miRNA) to obtain the ΔΔCt, which can be used to calculate the percent knockdown.
Acknowledgments
This work has been supported by RO1 NS048145 and R21 NS062230-01.
Footnotes
RNAi is ideal for validation of therapeutic targets. However, this requires functional assays for the targets. Particular care must be taken to rule out nonspecific effects that often are associated with RNAi. A functional phenotype observed with an siRNA must be verified with the following observations: the phenotype is absent with a nonspecific siRNA but observable with at least two or more different siRNAs that silence the same target, and importantly, the phenotype can be rescued by overexpression of the target gene that is made resistant to the silencing by the specific siRNA by silent mutations in the siRNA targeting sequence.
The plasmids for making shRNA construct, pEGFP-U6, and miRNA construct, pCAG-RFP-miRint-KX, can be ordered from Addgene (http://www.addgene.org/pgvec1). Information about the plasmids can be accessed by searching the name Zuoshang Xu on the Web site.
If the cells that express the target gene are not readily available, use a cell type that has a high transfection efficiency (e.g., HEK293) and cotransfect the siRNA, shRNA or miRNA vectors with a plasmid that expresses the target gene. For detection, one can use an antibody against the target or a tag that is placed on the target. Another alternative is to make a report construct, which expresses luciferase or GFP and carries the target sequence in the 3′ untranslated region of the mRNA (11).
If the cells express the target gene but are transfected poorly, use a vector that coexpresses the shRNA or miRNA with a marker protein, such as EGFP or RFP expression, sort the fluorescent cells and determine the target knockdown in the sorted cells (11).
In our hands, lipofectamine 2000 works well for most cell types but could be too toxic for some cells. Users need to empirically determine what is best for their cells. Besides lipofectamine 2000, we also have used FuGENE 6 (Roche, Indianapolis, IN), NeuroPORTER™ (Sigma, St. Louis, MO) and have attained satisfactory results in some cell types.
PCR parameters should be adjusted based on the dye and the real-time PCR equipment used. Many online programs are available to help design primers (e.g., http://bibiserv.techfak.uni-bielefeld.de/genefisher2/). In general, quantitative PCR primer pairs should span an intron and amplify a product ranging from 50 to 250 bases from the mature mRNA. This can minimize the effect of contaminating DNA and increase the PCR efficiency. Tm should be in the range of 58–60°C. Make master mix first and then distribute to all reactions to minimize inconsistency.
References
- 1.Mello CC, Conte D. Revealing the world of RNA interference. Nature. 2004;431:338–342. doi: 10.1038/nature02872. [DOI] [PubMed] [Google Scholar]
- 2.Tomari Y, Zamore PD. Perspective: machines for RNAi. Genes Dev. 2005;19:517–529. doi: 10.1101/gad.1284105. [DOI] [PubMed] [Google Scholar]
- 3.Xia X, Zhou H, Huang Y, Xu Z. Allele-specific RNAi selectively silences mutant SOD1 and achieves significant therapeutic benefit in vivo. Neurobiol Dis. 2006;23:578–586. doi: 10.1016/j.nbd.2006.04.019. [DOI] [PubMed] [Google Scholar]
- 4.Qiu L, Wang H, Xia X, Zhou H, Xu Z. A construct with fluorescent indicators for conditional expression of miRNA. BMC Biotechnology. 2008;8:77. doi: 10.1186/1472-6750-8-77. [DOI] [PMC free article] [PubMed] [Google Scholar]
- 5.Pei Y, Tuschl T. On the art of identifying effective and specific siRNAs. Nat Meth. 2006;3:670–676. doi: 10.1038/nmeth911. [DOI] [PubMed] [Google Scholar]
- 6.Birmingham A, Anderson E, Sullivan K, Reynolds A, Boese Q, Leake D, Karpilow J, Khvorova A. A protocol for designing siRNAs with high functionality and specificity. Nat Protocols. 2007;2:2068–2078. doi: 10.1038/nprot.2007.278. [DOI] [PubMed] [Google Scholar]
- 7.Hornung V, Guenthner-Biller M, Bourquin C, Ablasser A, Schlee M, Uematsu S, Noronha A, Manoharan M, Akira S, de Fougerolles A, Endres S, Hartmann G. Sequence-specific potent induction of IFN-alpha by short interfering RNA in plasmacytoid dendritic cells through TLR7. Nat Med. 2005;11:263–270. doi: 10.1038/nm1191. Epub 2005 Feb 2020. [DOI] [PubMed] [Google Scholar]
- 8.Judge AD, Sood V, Shaw JR, Fang D, McClintock K, MacLachlan I. Sequence-dependent stimulation of the mammalian innate immune response by synthetic siRNA. Nat Biotech. 2005;23:457–462. doi: 10.1038/nbt1081. [DOI] [PubMed] [Google Scholar]
- 9.Lan T, Putta MR, Wang D, Dai M, Yu D, Kandimalla ER, Agrawal S. Synthetic oligoribonucleotides-containing secondary structures act as agonists of Toll-like receptors 7 and 8. Biochemical and Biophysical Research Communications. 2009;386:443–448. doi: 10.1016/j.bbrc.2009.06.036. [DOI] [PubMed] [Google Scholar]
- 10.Borchert GM, Lanier W, Davidson BL. RNA polymerase III transcribes human microRNAs. Nat Struct Mol Biol. 2006;13:1097–1101. doi: 10.1038/nsmb1167. [DOI] [PubMed] [Google Scholar]
- 11.Zhou H, Xia XG, Xu Z. An RNA polymerase II construct synthesizes short-hairpin RNA with a quantitative indicator and mediates highly efficient RNAi. Nucl Acids Res. 2005;33:e62. doi: 10.1093/nar/gni061. [DOI] [PMC free article] [PubMed] [Google Scholar]
- 12.Cashman NR, Durham HD, Blusztajn JK, Oda K, Tabira T, Shaw IT, Dahrouge S, Antel JP. Neuroblastoma x spinal cord (NSC) hybrid cell lines resemble developing motor neurons. Dev Dyn. 1992;194:209–221. doi: 10.1002/aja.1001940306. [DOI] [PubMed] [Google Scholar]