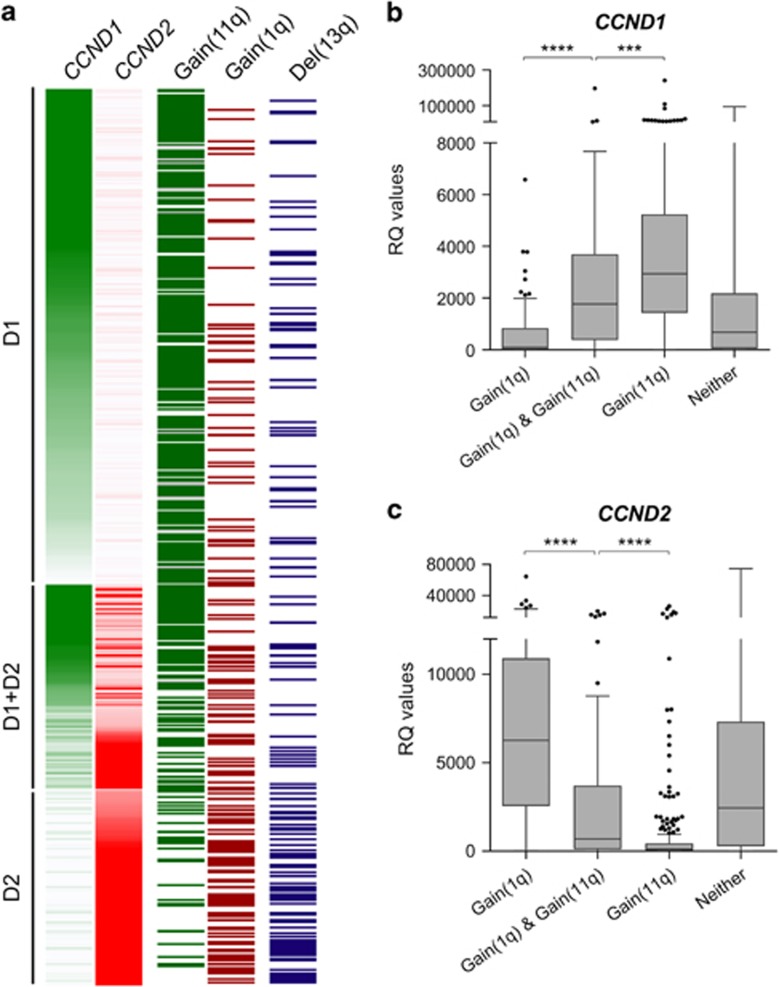
Figure 3.
HRD genetic sub-groups in Myeloma XI. (a) Each row represents one of in total 1007 cases. Expression intensity is coded in green for CCND1 and red for CCND2 expression. Gain of 11q25 is shown in dark green, gain of 1q in dark red and deletion 13q in dark blue; white=no abnormality detected. B+C. CCND1 (b) and CCND2 (c) qRT-PCR expression levels (relative quantitative RQ values, GAPDH normalised) for HRD cases with gain(1q), gain(1q)+gain(11q25), gain(11q25) or neither. Gene expression levels were significantly different for all possible group-wise comparisons (two-sided Mann–Whitney U test; ****P<0.0001; ***P<0.001).

