Abstract
Nuclear small RNA pathways safeguard genome integrity by establishing transcription-repressing heterochromatin at transposable elements. This inevitably also targets the transposon-rich source loci of the small RNAs themselves. How small RNA source loci are efficiently transcribed while transposon promoters are potently silenced, is not understood. Here, we show that transcription of Drosophila piRNA clusters—small RNA source loci in animal gonads—is enforced through RNA Polymerase II pre-initiation complex formation within repressive heterochromatin. This is accomplished through the TFIIA-L paralog Moonshiner, which is recruited to piRNA clusters via the Heterochromatin Protein-1 variant Rhino. Moonshiner triggers transcription initiation within piRNA clusters by recruiting the TATA box-binding protein (TBP)-related factor TRF2, an animal TFIID core variant. Thus, transcription of heterochromatic small RNA source loci relies on direct recruitment of the core transcriptional machinery to DNA via histone marks rather than sequence motifs, a concept that we argue is a recurring theme in evolution.
Eukaryotic genome integrity depends on repression of transcription and recombination at transposon insertions and other repeats through heterochromatin formation1. In plants, fungi, and animals, sequence specific heterochromatin formation depends on small RNA pathways2,3. These act through RNA induced silencing complexes composed of an Argonaute protein and a small guide RNA. While small RNA-mediated silencing allows repression of transposable elements throughout the genome, it poses an inherent paradox: how do the transposon-rich small RNA source loci escape transcriptional silencing to sustain ongoing small RNA biogenesis?
In animals, the central genome defense small RNA pathway is the PIWI-interacting RNA (piRNA) pathway. It acts in gonads and targets transposons at the transcriptional and post-transcriptional level via PIWI-clade Argonautes bound to 22-30nt long piRNAs4,5. piRNAs originate from transposon-rich genomic loci termed piRNA clusters. In Drosophila melanogaster most piRNA clusters are bidirectionally transcribed and yield piRNAs from both genomic strands6,7 (also termed ‘dual-strand’ clusters). For this reason, such clusters are always targeted by the piRNAs they produce and indeed, bidirectional piRNA clusters exhibit signatures of transcriptional silencing, such as Histone3 Lysine9 tri-methylation6,8. How this silencing is compatible with transcription of small RNA precursors is not understood. A key molecule for piRNA cluster transcription is Rhino, a heterochromatin protein-1 (HP1) paralog that is specifically enriched at bidirectional piRNA loci6,9,10. However, how Rhino licenses transcription at piRNA clusters remains unknown.
Transcription by RNA polymerase II (Pol II) is facilitated by basal transcription factors, which direct the stepwise assembly of the pre-initiation complex (PIC) on core promoter sequences11. The first step in this assembly is the positioning of the basal transcription factor complex TFIID with its central component TBP (TATA box binding protein) on the core promoter DNA. At this stage TFIIA stabilizes the binding of TFIID/TBP to DNA resulting in a ‘committed’ complex12,13. Recruitment of TFIID/TBP to promoters is mediated by transcription factors that bind DNA motifs in enhancer and promoter regions. Given that heterochromatin restricts DNA accessibility, the transcription of small RNA loci, particularly transcription initiation, must follow alternatives routes.
Here, we uncover a pathway that enables transcription initiation within heterochromatin resulting in the production of piRNA precursors. Central to this pathway is a TFIIA-TFIID variant complex that acts specifically at Rhino-bound piRNA clusters. It involves CG12721, a germline-specific TFIIA-L paralog, which we name Moonshiner for its activity under the transcriptional ‘prohibition’ of heterochromatin. Moonshiner interacts with the Rhino-associated protein Deadlock and activates transcription by recruiting TBP-related factor 2 (TRF2) to chromatin. Our data show that piRNA precursors in Drosophila originate via widespread transcription initiation within piRNA clusters, which is mediated by a coupling between heterochromatic histone marks and the Pol II pre-initiation complex.
Results
Transcription initiation sites are dispersed throughout bidirectional piRNA clusters
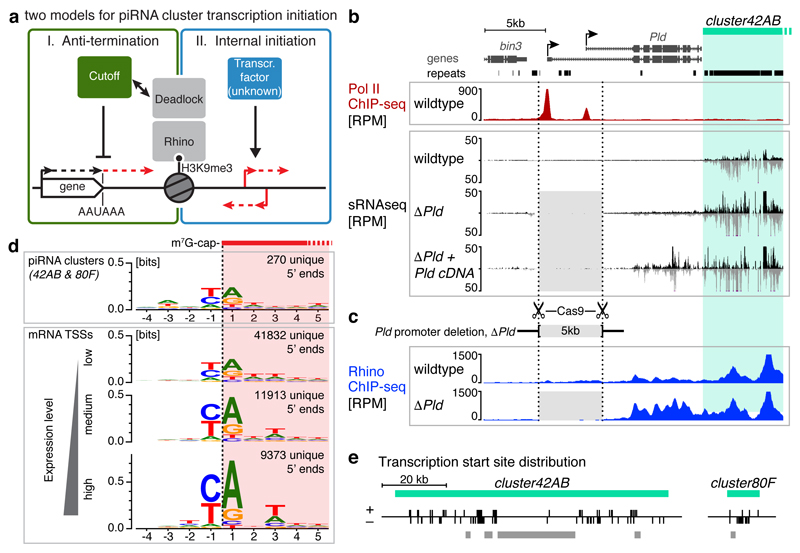
Drosophila bidirectional piRNA clusters are transcribed by Pol II, yet lack discernible promoters and are enriched in H3K9me3 marks. Two models of how Pol II transcribes these loci have been proposed6. One, Pol II enters the loci by read-through transcription from flanking genes (Fig. 1a, left panel). Indeed, bidirectional piRNA clusters are often flanked by transcribed genes pointing towards the cluster. Furthermore, the Rhino-associated protein Cutoff possesses transcription anti-termination function6,14. Alternatively, Pol II transcribes piRNA loci via pervasive internal transcription initiation (Fig. 1a, right panel).
Figure 1. Heterochromatic piRNA source loci utilize internal transcription initiation sites.
a, Two models for transcription initiation at Rhino-dependent piRNA source loci: read-through from flanking genes aided by Cutoff (left) or internal initiation (right). b-c, Genome browser panels showing investigation of flanking promoter dependency for the centromere-proximal part of cluster42AB. Shown are piRNA levels, Rhino occupancy, and Pol II occupancy. Light grey shading indicates the promoter deletion. d, DNA sequence motif at 5' ends of capped cluster42AB- and cluster80F-derived RNAs compared to that of mRNA 5' ends (binned by expression strength). e, Distribution of transcription start sites with ‘YR’-motif inside cluster42AB/80F (grey bars: regions with low mappability).
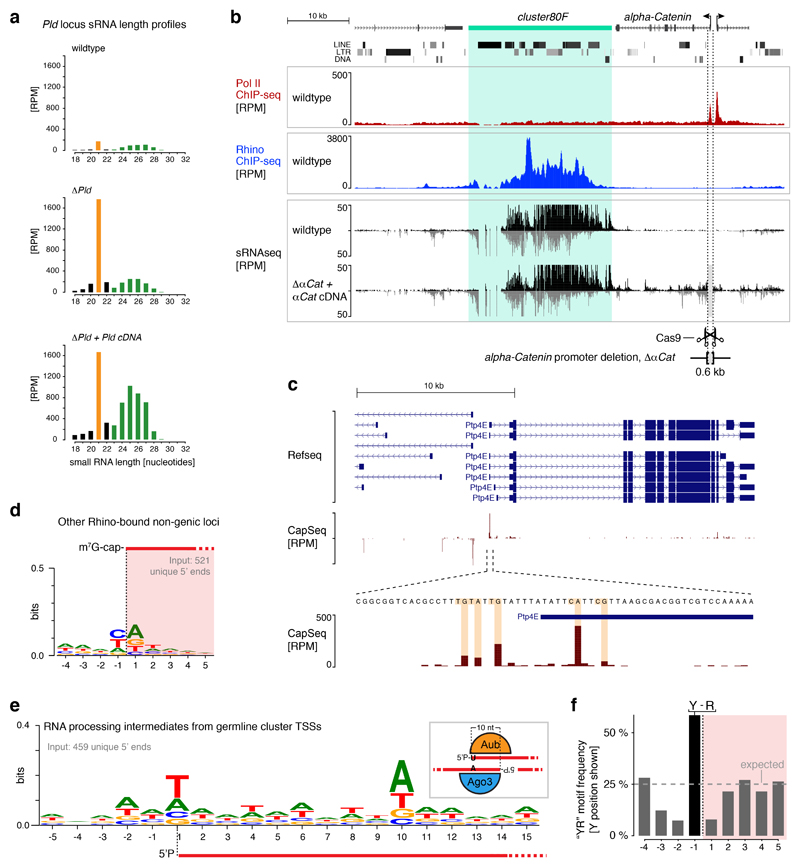
We tested the read-through model by deleting the promoters of Pld, which flanks cluster42AB, the largest bidirectional piRNA locus (Fig. 1b). In homozygous Pld-Δpromoter flies, cluster42AB piRNA levels are not changed (see also ref. 14). Instead, ectopic small RNAs are now produced within the Pld locus, an effect which is amplified by expression of a Pld cDNA in trans (Fig. 1b, Extended Data Fig. 1a, Supplementary Note 1). This suggests that cluster42AB spreads into the promoter-less Pld locus resulting in bidirectional transcription of small RNA precursors. Indeed, Rhino occupancy within Pld is elevated in Pld-Δpromoter flies (Fig. 1c). We obtained similar results at cluster80F (Extended Data Fig. 1b). In conclusion, bidirectional piRNA cluster expression does not rely on read-through transcription. Instead, flanking transcription units delimit piRNA clusters.
To test the internal initiation model we searched for signatures of transcription initiation within piRNA clusters. We determined transcription start sites (TSSs) at nucleotide resolution by Cap-seq15 (Extended Data Fig. 1c). This uncovered more than 200 putative TSSs within cluster42AB and cluster80F and an additional ~500 in all other Rhino-occupied loci. These are enriched for ‘YR’ di-nucleotides at the -1/+1 positions (Fig. 1d, Extended Data Fig. 1d), a signature of the Initiator element, a central core promoter motif that is bound by TFIID during PIC assembly16,17. When cloning RNA 5' ends with mono-phosphate groups instead of a cap structure from the same RNA sample, the known piRNA biogenesis signatures of uridine and adenosine residues at positions +1 and +10, respectively emerged7,18 (Extended Data Fig. 1e). This shows that the YR signature is not a feature of piRNA processing intermediates. Almost 60% of the putative cluster42AB/80F TSSs harbor the YR motif (Extended Data Fig. 1f), and these are distributed on both strands over the entire clusters (Fig. 1e). Taken together, our data reveal widespread Pol II transcription initiation within heterochromatic piRNA clusters.
The TFIIA-L paralog Moonshiner forms an alternative TFIIA-TRF2 complex at piRNA clusters
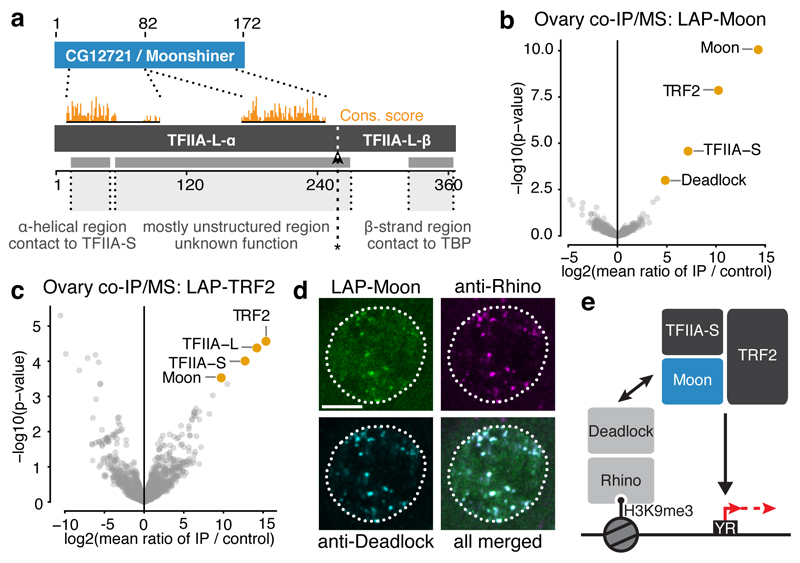
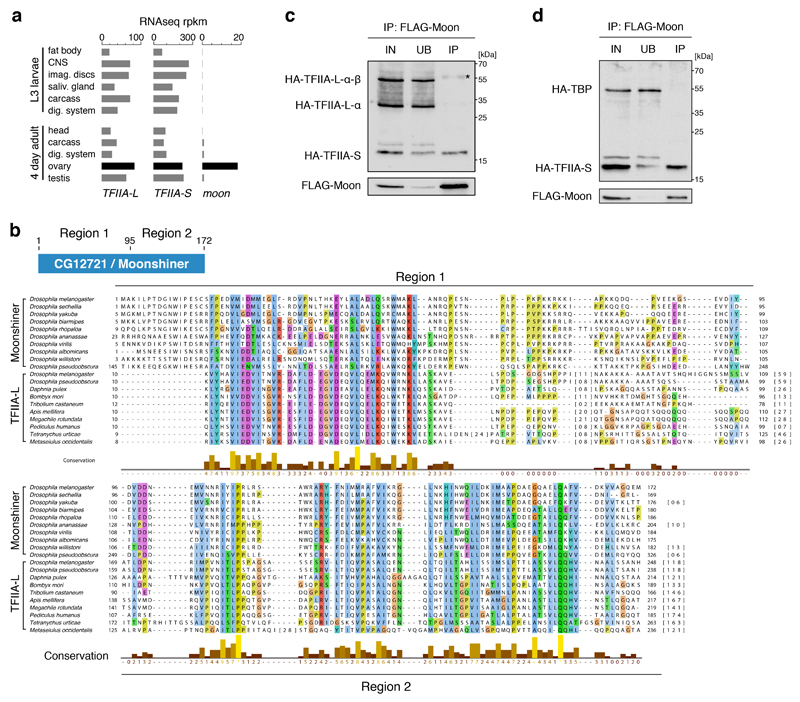
To identify factors required for transcription of heterochromatic piRNA clusters, we searched a transposon de-repression screen for hits with links to transcription initiation19. Based on iterative PSI-BLAST searches, CG12721—an uncharacterized protein that we name Moonshiner—stood out as a potential paralog of TFIIA-L (Fig. 2a), the large subunit of the TFIIA complex. In contrast to the ubiquitously expressed TFIIA-L and TFIIA-S factors, moonshiner is specifically expressed in ovaries (Extended Data Fig. 2a).
Figure 2. The TFIIA-L paralog Moonshiner localizes to Rhino domains and forms an alternative TFIIA-TRF2 complex.
a, Schematic alignment showing homology between CG12721/Moonshiner and TFIIA-L; Orange bars: conservation score (see Extended Data Fig. 2b). Also shown are TFIIA-L parts with known interaction partners and the Taspase1 cleavage site (asterisk). b-c, Volcano plots showing enrichment values and corresponding significance levels for proteins co-purifying with LAP-Moonshiner (n=6) or LAP-TRF2 (n=3) from ovary lysates (four most significantly enriched proteins are labeled). d, Localization of LAP-Moonshiner, Rhino and Deadlock within an ovarian germline nucleus (see also Extended Data Fig. 3f). e, Model summarizing the identified protein interactions in the context of Rhino-dependent piRNA cluster transcription.
Moonshiner shares two regions of homology with TFIIA-L: An N-terminal α-helical region, which in TFIIA-L facilitates the interaction with TFIIA-S20,21, and a second region that is part of the middle region of TFIIA-L (Fig. 2a, Extended Data Fig. 2b). In agreement with this, Moonshiner interacts with TFIIA-S, but not with TFIIA-L (Extended Data Fig. 2c). This suggests that Moonshiner and TFIIA-S form an alternative TFIIA complex involved in piRNA cluster expression. In support of this, TFIIA-S also scored in the transposon de-repression screen19. Moonshiner lacks the C-terminal β-roll domain, which in TFIIA-L interacts with TBP20,21 (Fig. 2a). Consistent with this, the Moonshiner/TFIIA-S complex does not interact with TBP (Extended Data Fig. 2d).
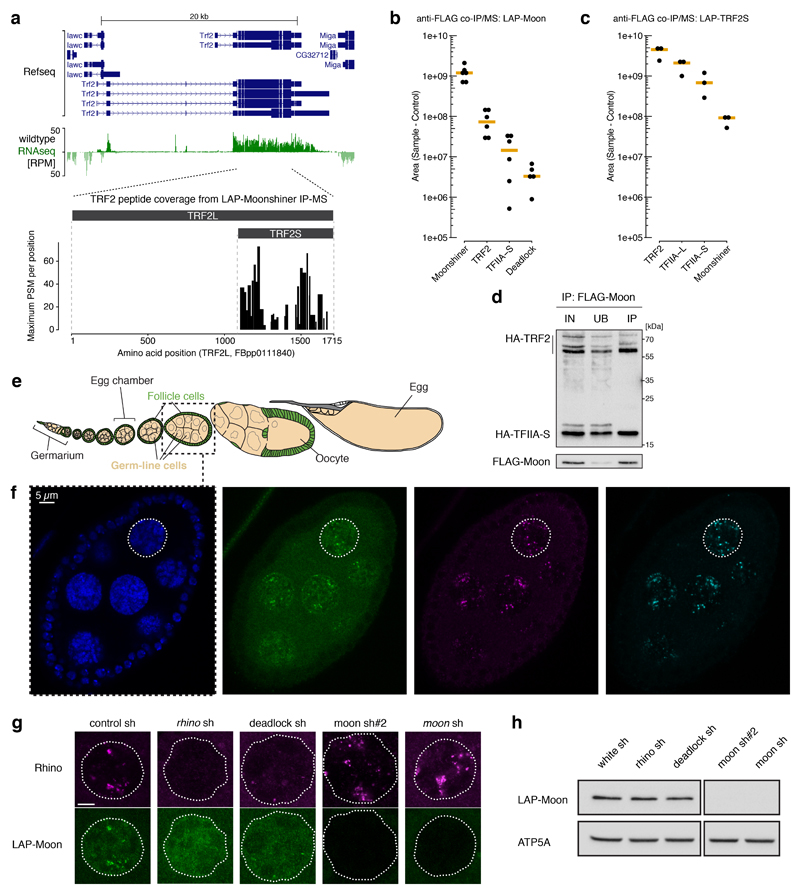
The function of TFIIA is to stabilize the binding of TBP/TFIID to promoter DNA. To elucidate what alternative function Moonshiner may serve we characterized its in vivo protein interactome. We generated flies expressing Moonshiner with a localization and affinity purification (LAP) tag (3xFLAG-V5-GFP). We immuno-precipitated LAP-Moonshiner from ovary lysates and determined co-purifying proteins by quantitative mass spectrometry. The three most enriched proteins were Moonshiner, TFIIA-S, and the short isoform of TRF2 (Fig. 2b, Extended Data Fig. 3a,b). TRF2 is an animal TBP paralog that is essential for early embryogenesis22–26 and fertility27,28. In contrast, TFIIA-L and TBP were not enriched. We substantiated these findings with a reciprocal experiment using LAP-TRF2, which resulted in co-purification of TRF2 with TFIIA-L, TFIIA-S, and Moonshiner (Fig. 2c, Extended Data Fig. 3c). Moonshiner also interacts with TRF2 in Schneider cells (Extended Data Fig. 3d). Taken together, Moonshiner forms an alternative TFIIA-TBP complex in ovaries consisting of Moonshiner, TFIIA-S and TRF2.
The next most enriched protein co-purifying with Moonshiner was Deadlock, which directly interacts with Rhino6 (Fig. 2b). This revealed a molecular connection between Moonshiner/TFIIA-S/TRF2 and Rhino. To substantiate this, we asked whether Moonshiner, like Rhino and Deadlock, is enriched at bidirectional piRNA loci6,9,10. Indeed, LAP-Moonshiner, which is specifically expressed in germline cells, is concentrated in nuclear foci that are also positive for Rhino and Deadlock (Fig. 2d, Extended Data Fig. 3e,f). Furthermore, Moonshiner’s localization to nuclear foci, but not its overall level, depends on Rhino and Deadlock (Extended Data Fig. 3g,h). In contrast, Rhino localization to nuclear foci did not depend on Moonshiner (Extended Data Fig. 3g).
In summary, our data suggest that Moonshiner forms an alternative TFIIA-TRF2 complex at bidirectional piRNA clusters via an interaction with Deadlock, a binding partner of the HP1 variant Rhino (Fig. 2e).
Moonshiner is essential for bidirectional piRNA cluster transcription
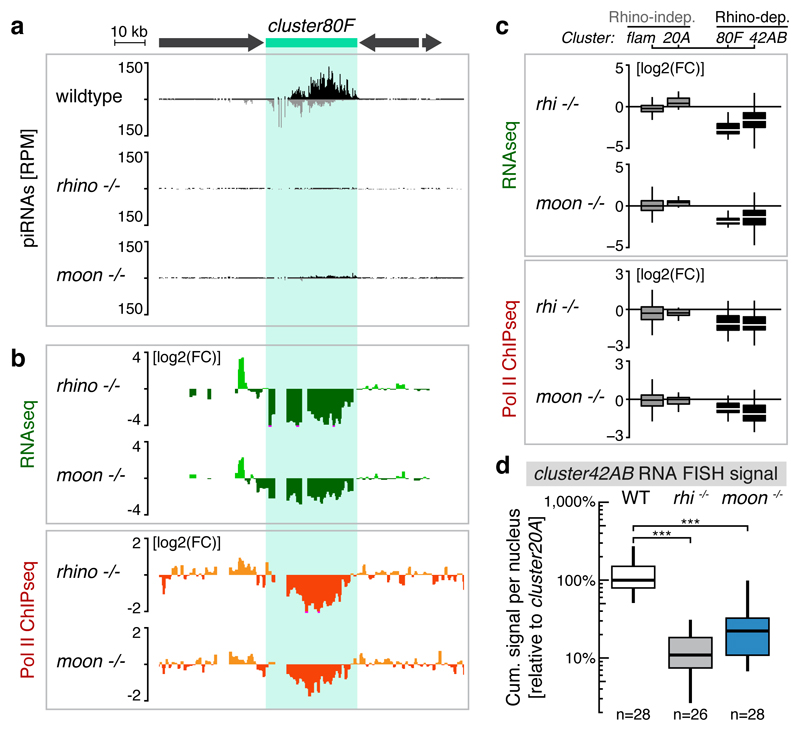
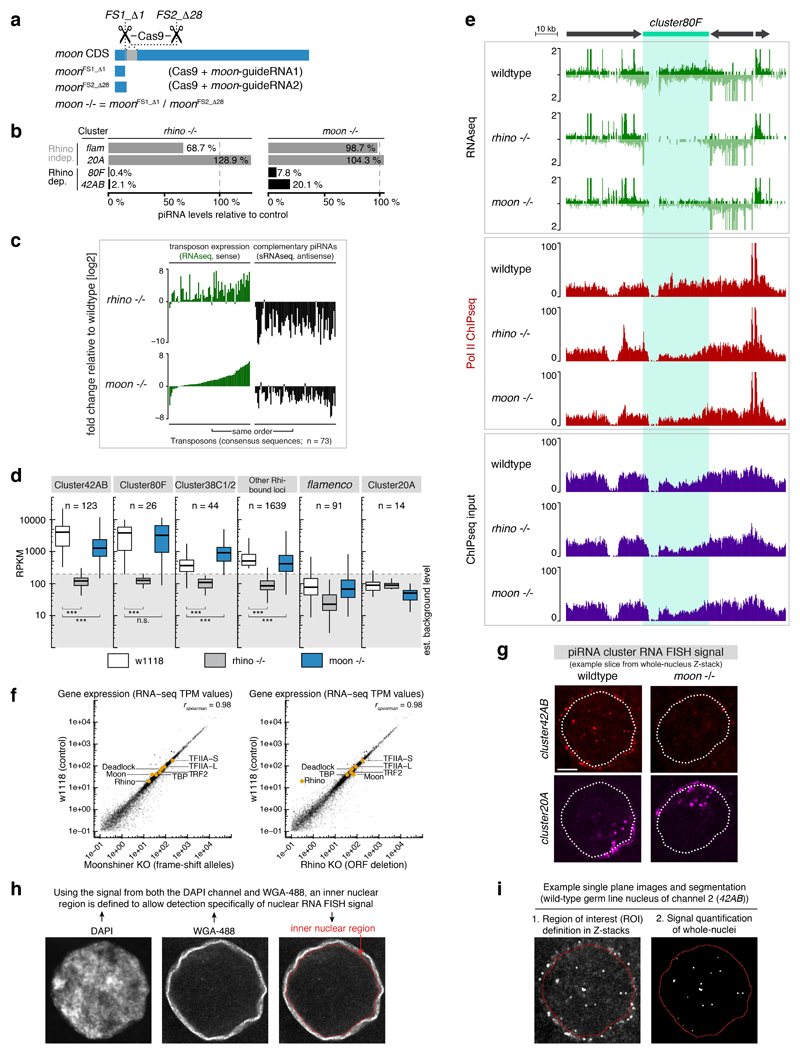
The model in Figure 2e predicts that loss of Moonshiner should result in defective transcription of Rhino-dependent piRNA clusters. To test this, we generated moonshiner mutant flies (Extended Data Fig. 4a). These flies are viable, contain ovaries with normal morphology, but are sterile. We first sequenced piRNA populations from moonshiner mutants. This showed that >90% of cluster80F piRNAs and ~80% of cluster42AB piRNAs depend on Moonshiner, while the Rhino-independent piRNA clusters 20A and flamenco are also Moonshiner-independent (Fig. 3a, Extended Data Fig. 4b). moonshiner and rhino mutants also show similar reductions in piRNAs mapping to individual transposons as well as similar increases in transposon mRNA levels resulting from de-repression (Extended Data Fig. 4c). We note that loss of Rhino results in a stronger phenotype compared to that of Moonshiner loss, indicating that Rhino serves other functions in addition to recruiting Moonshiner. Importantly, while Rhino deposition undergoes slight redistribution in moonshiner mutants, Rhino levels at cluster80F remain unchanged despite the strong loss of piRNA production (Extended Data Fig. 4d). Thus, the observed piRNAs losses are likely a direct consequence of Moonshiner loss, rather than an indirect result of perturbed Rhino occupancy.
Figure 3. Rhino-bound piRNA clusters require Moonshiner for their efficient transcription.
a, Genome browser panel showing cluster80F piRNA levels from ovaries with indicated genotype. b, piRNA precursor abundance (RNAseq) and Pol II occupancy (ChIPseq) at cluster80F in wildtype ovaries and the corresponding changes in rhino or moonshiner mutant ovaries (log2 fold change calculated for 1 kb windows). c, Boxplots showing piRNA precursor abundance (top panel) and Pol II occupancy (lower panel) for indicated piRNA clusters in rhino or moonshiner mutant ovaries relative to wildtype (log2 fold-change of 1 kb windows; box plots display median (line), first and third quartiles (box) and highest/lowest value within 1.5*inner quartile range (whiskers)). d, Quantification of cluster42AB RNA FISH signal in germline nuclei of ovaries with indicated genotype relative to that of cluster20A (boxplots as in c; ***: p value <0.0001; Mann-Whitney-Wilcoxon tests).
Consistent with a transcriptional defect at piRNA clusters in moonshiner mutants, steady state piRNA precursor levels were severely reduced at cluster80F and cluster42AB but not at cluster20A and flamenco (Fig. 3b,c top panels, Extended Data Fig. 4e). In contrast, steady state levels of mRNAs were hardly changed in moonshiner mutants. While not excluding additional roles for Moonshiner in processes other than the piRNA pathway, these data argue against a broad gene expression role of this TFIIA-L paralog (Extended Data Fig. 4f). To directly probe for a transcriptional defect, we determined Pol II occupancy using ChIP-seq. This revealed loss of Pol II specifically at Rhino-dependent piRNA clusters in moonshiner mutants, mirroring the reductions in piRNA and precursor RNA levels (Fig. 3b,c bottom panels, Extended Data Fig. 4e). We finally assessed piRNA cluster transcription in nurse cell nuclei by quantitative fluorescent in situ hybridization (FISH) (Extended Data Fig. 4g-i). We observed a pronounced drop in cluster42AB signal in rhino and moonshiner mutants compared to wildtype (Fig. 3d). In sum, loss of Moonshiner results in defective transcription of bidirectional piRNA clusters in the developing ovary.
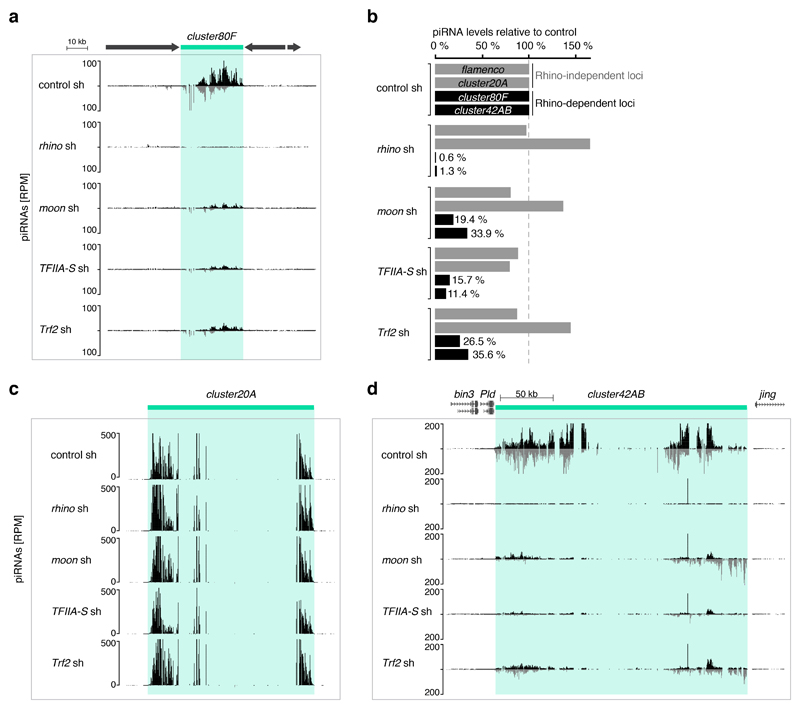
To answer whether Moonshiner exerts its function within the identified variant TFIIA-TRF2 complex we generated flies with germline-specific depletion of TFIIA-S or TRF2. These flies are sterile, display de-repression of several transposons, and their ovaries contain strongly reduced levels of piRNAs derived specifically from bidirectional clusters (Extended Data Fig. 5,6, Supplementary Note 2). We conclude that piRNA production from Rhino-dependent piRNA loci requires Moonshiner, TFIIA-S, and TRF2, presumably acting together in a complex that stimulates transcription initiation.
Endogenous piRNA cluster promoters can bypass Moonshiner-dependent transcription initiation
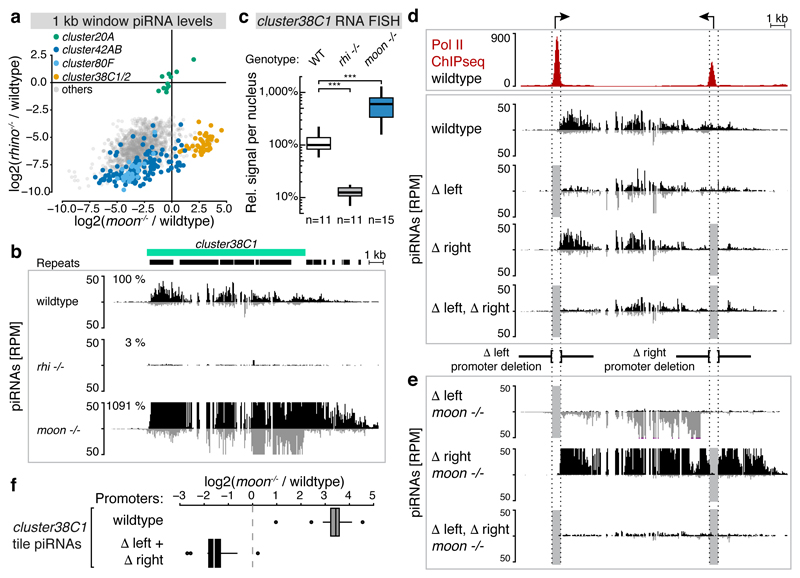
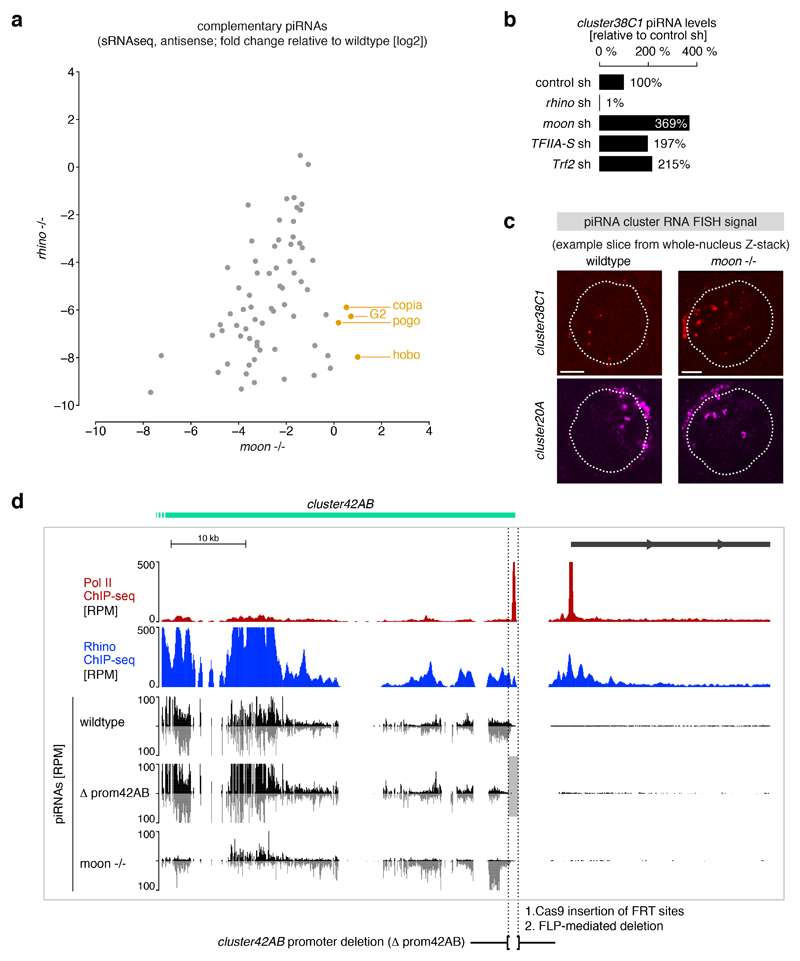
Our data are consistent with Moonshiner being required for efficient transcription at all Rhino-dependent piRNA loci. For some transposons, however, piRNA levels are very different in moonshiner versus rhino mutants (Extended Data Fig. 7a). To understand this discrepancy, we compared moonshiner and rhino mutant piRNA profiles genome-wide. Most Rhino-dependent loci are also Moonshiner-dependent, confirming that Moonshiner is essential for bidirectional piRNA precursor transcription (Fig. 4a). However, some loci—while strongly dependent on Rhino—produce piRNAs independently of Moonshiner, often even at elevated levels. Most of these map to cluster38C1 and 38C2. These clusters harbor prominent Pol II peaks at their boundaries6, a pattern that—besides the distal part of cluster42AB —is not found at other Rhino-dependent clusters. To elucidate this Moonshiner-independent piRNA production we investigated cluster38C1 in detail. While Rhino loss results in a near complete collapse of piRNAs from cluster38C1, loss of Moonshiner results in >10 fold higher piRNA levels (Fig. 4b). piRNA levels also increase in ovaries depleted for TFIIA-S or TRF2 (Extended Data Fig. 7b). Quantitative RNA FISH revealed that the increased piRNA production is caused by elevated transcription of cluster38C1 in moonshiner mutants (Fig. 4c, Extended Data Fig.7c).
Figure 4. Endogenous piRNA cluster promoters bypass Moonshiner-dependent transcription initiation.
a, Fold changes (log2) of piRNAs mapping uniquely to Rhino-dependent genomic 1kb tiles in rhino versus moonshiner mutants (relative to wildtype). Tiles from major piRNA clusters are colored (cluster20A tiles serve as Rhino-independent control group). b, Genome browser panel showing cluster38C1 piRNA levels from ovaries with indicated genotype. c, Quantification of cluster38C1 RNA FISH signal in germline nuclei relative to that of cluster20A (***: p value < 0.0001; Mann-Whitney-Wilcoxon tests; boxplots as in Fig. 3c). d, Pol II occupancy and piRNA levels at cluster38C1 in ovaries with indicated genotypes. Δleft and Δright indicate cluster38C1 promoter deletions (light grey boxes). e, as d, but from moonshiner mutant ovaries. f, Boxplot (defined as in Fig. 3c) displaying log2(fold changes) in cluster38C1 piRNA levels (n=12 1kb windows) in moonshiner mutant compared to wildtype ovaries when both cluster38C1 promoters are wildtype or deleted.
To directly test the involvement of the flanking promoters in cluster38C1 transcription, we used CRISPR/Cas929 to precisely delete them. This leads to substantial reductions in promoter-proximal piRNA levels, mainly on the strand transcribed by the respective promoter. However, piRNA production more distal to the deleted promoters is hardly changed (Fig. 4d). Similarly, in flies that lack both cluster38C1 promoters, piRNAs at the cluster boundaries are considerably reduced while piRNA production from the central region is only mildly affected. This points to an alternative mechanism of transcription initiation from within the cluster.
We hypothesized that Moonshiner is responsible for this promoter-independent transcription. To test this we generated flies harboring the various promoter deletions in a moonshiner mutant background. Both single promoter deletions of the 38C1 cluster display nearly exclusive unidirectional piRNA profiles, which initiate just downstream of the non-modified promoter (Fig. 4e). These results predict that piRNA production from the double-promoter-deleted cluster should be Moonshiner dependent. Indeed, loss of Moonshiner results in roughly 4-fold reduced piRNA levels. We see very similar results for the distal ~20kb of cluster42AB, which also harbors a flanking promoter6 (Extended Data Fig. 7d) causing Moonshiner-independent piRNA production for promoter-proximal cluster42AB tiles (Fig. 4a). We conclude that in the absence of flanking promoters Moonshiner-independent loci such as cluster38C1 become Moonshiner-dependent just like all other Rhino-dependent loci (Fig. 4e,f).
These findings allow three conclusions. (1) piRNA precursors transcribed from bidirectional clusters can be 10-15kb in length (Fig. 4b,e). (2) As Pol II does not elongate into cluster38C1 from flanking promoters in the absence of Rhino, at least one other effector protein must act at piRNA clusters (Fig. 4b). (3) Moonshiner specifically stimulates transcription initiation as DNA encoded promoters can replace its function at Rhino-dependent piRNA loci.
Moonshiner activates heterochromatin transcription by recruiting TRF2
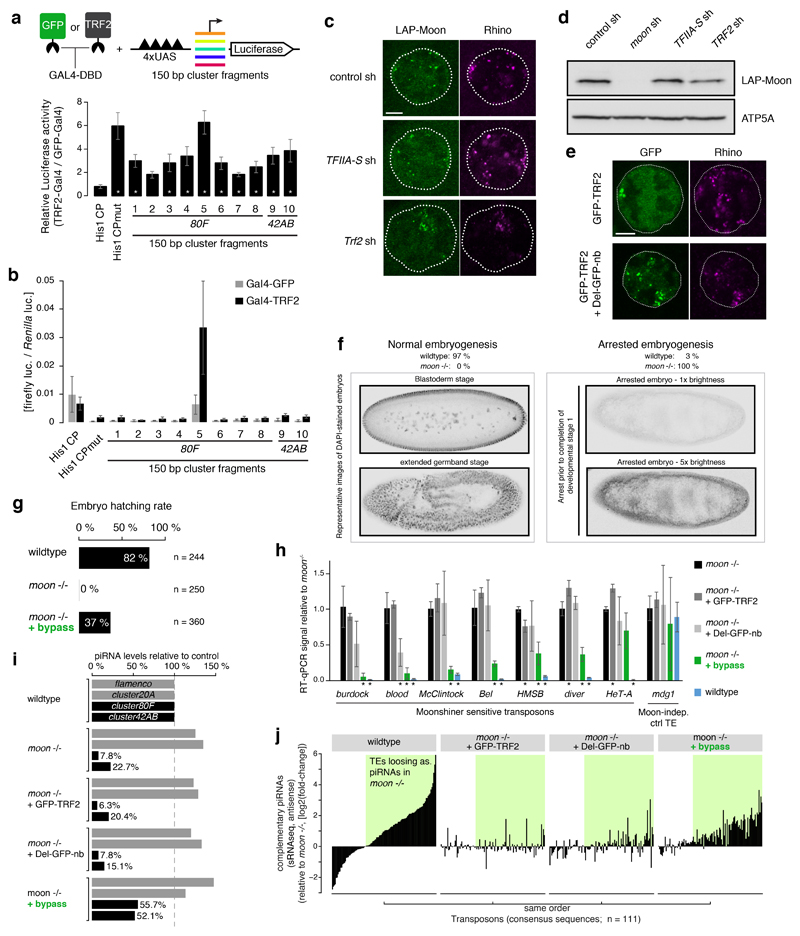
Canonical TFIIA stabilizes the binding of TBP onto core promoters30. We therefore tested whether ectopic recruitment of TRF2 stimulates transcription in Schneider cells, which lack Moonshiner expression. Recruiting additional TRF2 to the known TRF2-driven histone H1 core promoter does not elevate transcription of a reporter, while recruiting TRF2 to the same promoter carrying a mutation that disrupts its endogenous activity31 results in a ~6-fold stimulation of transcription (Extended Data Fig. 8a,b). Transcription is also stimulated (2-6 fold) upon TRF2 recruitment to ten randomly chosen 150-nt piRNA cluster fragments. This resembles the ~10-fold stimulation of cluster transcription by Moonshiner observed in vivo, suggesting that Moonshiner stimulates transcription from a broad range of DNA sequences by recruiting TRF2 to chromatin.
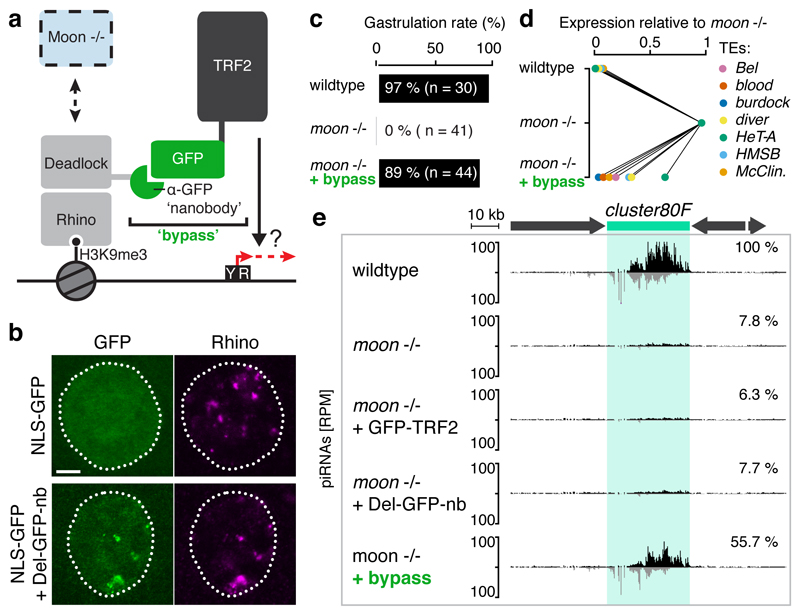
Moonshiner levels and its localization to Rhino-foci are unchanged in ovaries depleted for TFIIA-S or TRF2 (Extended Data Fig. 8c,d), yet these flies phenotypically resemble moonshiner mutants. This supports a model where recruitment of TRF2 to piRNA clusters is Moonshiner’s main function. We tested this hypothesis in vivo by recruiting TRF2 to the Rhino-interactor Deadlock using a single-chain anti-GFP nanobody32 (Fig. 5a), thereby bypassing the requirement for Moonshiner. We engineered flies to express Deadlock fused to the GFP-nanobody, which enables specific recruitment of GFP-tagged proteins to Rhino domains in germline nuclei (Fig. 5b). We then combined expression of Deadlock-GFP-nanobody and GFP-TRF2 fusion proteins to recruit TRF2 to piRNA source loci in a Moonshiner-independent fashion (Extended Data Fig. 8e). moonshiner mutant flies harboring the two bypass transgenes are fertile, with nearly 90% of their laid eggs developing beyond gastrulation and 37% hatching into larva, several of which develop into adult flies (Fig. 5c, Extended Data Fig. 8f,g). Moreover, mRNA levels of transposons that are strongly de-repressed in moonshiner mutants are largely restored to wildtype levels in ‘bypass’ females (Fig. 5d, Extended Data Fig. 8h; only weak rescue for the telomeric HeT-A element). Similarly, we see rescue of piRNAs mapping to cluster80F or cluster42AB in ‘bypass’ females, while all other genetic combinations that lack Moonshiner display the loss of piRNAs characteristic for moonshiner mutants (Fig. 5e, Extended Data Fig. 8i). In agreement with the partial rescue in TE silencing and fertility, piRNA levels derived from clusters as well as transposon targeting piRNAs in general do not return to wildtype level in bypass flies (Extended Data Fig. 8i,j). Taken together, the high congruence between the rescue at the developmental and molecular level strongly supports a model where Moonshiner stimulates transcription within heterochromatin via recruitment of TRF2 to Rhino-decorated piRNA source loci.
Figure 5. Moonshiner stimulates heterochromatic transcription by recruiting TRF2 to Rhino domains.
a, Schematic of the bypass experiment where GFP-TRF2 is recruited directly to Rhino-domains via a Deadlock:GFP-nanobody fusion protein. b, Localization of NLS-GFP and Rhino in control (top) or in germline nuclei expressing the Deadlock:GFP-nanobody fusion protein (bottom); scale bar: 5 µM. c, Percentages of embryos with the indicated genotype displaying successful gastrulation; see also Extended Data Fig. 8f. d, Steady state levels of transposon mRNAs in ovaries with indicated genotype relative to their level in moonshiner mutants (average of 3 biological replicates; for details see Extended Data Fig. 8h). e, cluster80F piRNA profiles in ovaries with indicated genotype.
Discussion
Here we identify a heterochromatin-dependent transcription machinery in Drosophila that allows piRNA precursor transcription despite potent silencing of transposon-encoded promoters and enhancers. We show that Moonshiner-dependent transcription, which cannot rely on recognition of DNA-motifs because of their inaccessibility in heterochromatin, achieves locus specificity through Rhino, an HP1 variant that binds H3K9me3 marks at piRNA clusters (Figs 2,5). Thereby the cell allows transcription of transposon-rich loci into piRNA precursors while transcription of the same loci into functional transposon mRNAs is suppressed via heterochromatin-mediated exclusion of sequence specific transcription factors.
Small RNA source loci embedded in heterochromatin and transcribed on both genomic strands are also a hallmark of genome defense pathways in plants and fungi. In fission yeast, a ‘passive’ mode of small RNA expression has been proposed, where Pol II transcribes small RNA precursors from pericentromeric regions during G1/S when heterochromatin is less condensed33,34. In contrast, an active recruitment mode with conceptual similarities to the Moonshiner pathway occurs in plants. Here SHH1, a reader of H3K9me marks, recruits the plant specific RNA polymerase IV to heterochromatin in order to transcribe small RNA precursors35,36. Though SHH1 and Rhino both bind H3K9me residues, the two proteins are unrelated, suggesting that specification of small RNA source locus transcription via heterochromatin readers has evolved independently in animals and plants. Also in plants, small RNA precursor transcription initiates at ‘YR’ Initiator sites dispersed on both genomic strands37. Whether Moonshiner-mediated transcription, like that of plant Pol IV, depends on collaboration with nucleosome remodelers to access heterochromatic target loci is unclear. The reported interaction of TRF2 with the NURF chromatin remodeling complex38 supports this possibility. The recurring evolution of small RNA source locus transcription specified by chromatin marks rather than DNA-sequence suggests that this constitutes a common ‘enhancer-less’ mode of transcriptional activation. The DNA inaccessibility of heterochromatin is thereby transformed into a specificity mark for non-canonical transcription activation (Extended Data Fig. 9). We note that the major Drosophila somatic piRNA cluster, flamenco, is transcribed from a single defined enhancer-driven promoter and avoids piRNA-mediated silencing due to the antisense orientation of the vast majority of the contained transposons7,39. The production of plant siRNAs from Pol IV transcripts initiates a positive feedback loop: siRNA-mediated targeting leads to DNA methylation, which in turn increases H3K9 methylation, thereby bringing in SHH1 and Pol IV3,35. In a similar fashion, production of Moonshiner-dependent piRNA precursors leads to generation of Piwi-bound piRNAs, which in turn guide H3K9 methylation and thereby Rhino recruitment6. This explains how Piwi-mediated transcriptional silencing ‘transforms’ active transposon insertions into heterochromatic piRNA source loci with bidirectional transcription.
Rhino and the associated factors Deadlock and Cutoff are required for transcription of dual-strand piRNA clusters. Due to its ability to inhibit co-transcriptional processes such as splicing and transcription termination, Cutoff has been suggested to be the main effector of this complex6,10,14. Such an inhibition of termination is supported by our data on cluster38C1, where transcription from defined promoters results in 10-15 kb transcripts in a Rhino, Deadlock, and Cutoff dependent manner (Fig. 4b,e). Cutoff also interacts with the transcription/export (TREX) complex, which orchestrates several co-transcriptional processes and which is required for transcription of Rhino-dependent piRNA source loci40,41. Together with the identification of Moonshiner/TRF2 as piRNA cluster transcription initiation factors, this suggests that Rhino acts as a molecular hub for several effector proteins that stimulate different co-transcriptional processes. Data from mouse studies support a conserved role of TRF2 in transcription of germline heterochromatin (Supplementary Note 3). In summary, we uncover the molecular mechanism by which heterochromatic piRNA loci are transcribed in Drosophila and propose that the identified coupling of chromatin readers to basal transcription factors is a recurring theme in eukaryotic heterochromatin biology.
Methods
Fly Husbandry
A complete list of fly strains with genotypes, identifiers and original sources can be found in Supplementary Table 1. All flies were kept at 25°C. For ovary dissection, flies of 2-6 days of age were given fresh food with yeast for two days and then dissected after brief immobilization by CO2 anesthesia (blinding and randomization not applied). All fly strains used in the study (see Supplementary Table 1) are available via VDRC (http://stockcenter.vdrc.at/control/main).
Generation of transgenic fly strains
LAP-Moonshiner transgenic flies were obtained by inserting an N-terminal LAP tag (3xFLAG-V5-GFP) into a Pacman clone (CH322-15N16) that contains the moonshiner gene locus via bacterial recombineering53. The Pacman transgene was then inserted into the attP2 landing site (FlyBase ID: FBti0040535) and the transgene was verified to rescue the sterility phenotype of homozygous moonshiner frameshift mutations (moon -/-). LAP-TRF2 transgenic flies were generated by insertion of a TRF2 germline expression construct (nanos promoter and vasa 3' UTR; short isoform of TRF2, Extended Data Fig. 3a) into the attP40 landing site FlyBase ID: FBti0114379. Fly strains harboring shRNA expression cassettes for germline knockdown were created by cloning shRNAs (shRNA construct cloning oligo sequences are listed in Supplementary Table 2) into the Valium-20 or Valium-22 vector modified with a white selection marker43. The LacZ sensor flies for HeT-A were generated by replacing the target fragment in the Burdock sensor with a 700bp fragment of the HeT-A transposon. Burdock and gypsy LacZ sensor flies are described in ref. 54 and ref. 55, respectively.
Generation of mutant fly strains
Frame-shift mutant alleles of moonshiner were generated as described in ref. 56 by injection of pDCC6 plasmids modified to express moonshiner-targeting guide-RNAs using the oligos given in Supplementary Table 2.
For generating promoter deletions, homology arms of approximately 1kb were cloned into pHD-dsRed (Addgene) by Gibson Assembly and co-injected with pCFD4 (Addgene) containing two sgRNA expression cassettes into y,w, ZH2A(Act5C-Cas9) embryos. Removal of the dsRed cassette was done via crossing to a hs-Cre strain. Following stock establishment, homozygous flies were screened by PCR and sequencing for the presence of the targeted deletion, the loss of the wild type allele, and for the lack of vector backbone integrations. For deletion of the cluster38C1 right promoter in the cluster38C1 Δleft background, a similar vector was generated with flanking FRTs and a white selection marker. The vectors were injected into actin>Cas9; 38C1 Δleft promoter embryos. The selection cassette was removed by crossing to a hsFLP stock.
For deletion of the cluster42AB right promoter two FRT insertions flanking the promoter were generated by oligo directed DNA repair following gRNA induced cuts. The two FRT insertions were brought in trans and the promoter deletion was triggered by crossing to a hs>FLP strain.
rhino mutant fly strains were generated by removal of the entire rhino open reading frame using ends-out homologous recombination57.
Drosophila Schneider 2 (S2) cell culture
Drosophila Schneider 2 (S2) cells were grown at 25°C in S2 cell media supplemented with 10% fetal bovine serum-free (Thermo Fisher Scientific).
X-Gal Staining of Drosophila ovaries
Dissected ovaries from flies subjected to control or germline knockdown were fixed in 0.5% Glutaraldehyde/PBS for 15 minutes at room temperature and then rinsed twice in PBS. The fixed ovaries were then incubated in staining solution (10 mM PBS, 1 mM MgCl2, 150 mM NaCl, 3 mM potassium ferricyanide, 3 mM potassium ferrocyanide, 0.1 % Triton, 0.1 % X-Gal) at room temperature with rotation for 2 hours (HeT-A and burdock sensors) or overnight (gypsy sensor).
Scoring of fly embryogenesis and hatching rates
For quantifying the correct start of embryogenesis non-virgin females were kept together with w1118 males for two days. 1-3 hours old embryos were bleached, formaldehyde fixed and stained with DAPI according to standard procedures. Embryos with hundreds or thousands of regularly spaced nuclei resembling embryonic stages 3-7 were scored as ‘normal’. Embryos laid by moon mutant females had usually 5 or less irregular DAPI foci, a phenotype scored as ‘arrested’. From the same cages eggs were collected overnight and the hatching rate was counted 30 hours later in numbers as practically feasible.
Protein co-immunoprecipitation from S2 cell lysates
S2 cells were seeded at ~1x10⁶ cells/mL and transfected using FuGENE with plasmids harboring Act5C-driven expression cassettes of the described tagged proteins. These plasmids were cloned by insertion of the transgene open reading frame (for TRF2, the short isoform was used; Extended Data Fig. 3a) into the pAcM_empty expression vector driven by the Drosophila Act5C promoter. 48 hours after transfection, cells were collected by centrifugation and pellets were snap-frozen in liquid nitrogen and stored for later processing. S2 cell pellets were resuspended in 50 µL S2 Lysis Buffer for S2 cells (LBS2) (30 mM HEPES pH 7.4, 150 mM NaCl, 2 mM MgCl2, 0.5% Triton X-100, 5 mM DTT) and rotated for 20 minutes at 4°C. Lysate were then cleared by centrifugation for 10 minutes at 16.000 rpm (4°C) and protein concentrations measured using Bradford reagent. For each immunoprecipitation, 100 µL lysate at ~1 µg/µL total protein was incubated 2 hours at 4°C with 20 µL FLAG M2 Magnetic Beads. The beads were then washed three times ten minutes in IP Washing Buffer (IPWB) (30 mM HEPES pH 7.4, 300 mM NaCl, 2 mM MgCl2, 0.5% Tritonx100, 5 mM DTT) and co-purifying proteins were eluted by a 5-minute incubation at 95°C in 50 µL 1xSDS buffer.
Western Blot Analysis of co-IPs from S2 cell lysates
Western blotting was carried out according to standard protocols. Briefly, protein samples were resolved by SDS PAGE and transferred to 0.45 µm nitrocellulose membranes (Bio-Rad) before blotting overnight with primary antibodies (Supplementary Table 3) in PBX (0.01% Triton X-100 in 1xPBS). After three washes with PBX, incubation with HRP-coupled secondary antibodies and three more washes in PBX, the membranes were incubated with Clarity™ Western ECL Blotting Substrate (BioRad) and imaged using a ChemiDoc MP imaging system (BioRad).
Protein co-immunoprecipitation from ovary lysates
For each sample, roughly 200 ovary pairs were dissected and immediately transferred to ice-cold PBS. Each ovary sample was then homogenized with 20 strokes using a douncer (tight pestle in 1 mL Ovary Protein Lysis Buffer (20 mM Tris-HCl pH 7.5, 150 mM NaCl, 2 mM MgCl2, 10 % glycerol, 1 mM DTT, 1 mM PefaBloc, 0.2 % NP-40). The homogenate was then transferred to clean 1.5 mL low-retention tubes and incubated on ice for 15 minutes with occasional inversion. The lysate was then cleared by centrifugation for 5 minutes at 16.000 x g. To each cleared lysate sample 20 µL of a solution of anti-FLAG M2 magnetic beads diluted to 1 µL beads per 5 µL total volume with Beads Buffer (20 mM Tris-HCl pH 7.5, 150 mM NaCl) were added. Samples were then incubated for 3 hours at 4°C with rotation and subsequently washed four times 10 minutes in Ovary Protein Lysis Buffer followed by six quick rinses in Co-IP Wash Buffer (20 mM HEPES pH 7.4, 150 mM NaCl, 2 mM MgCl2). Most of the wash buffer was then removed and the pelleted magnetic beads were stored at 4°C until processing for mass spectrometry analysis.
Mass Spectrometry Analyses
Co-immunoprecipitated proteins were subjected to on-bead digestion with LysC and elution with glycine before digestion with Trypsin. The resulting peptides were analyzed using a Dionex UltiMate 3000 HPLC RSLC nano system coupled to a Q Exactive mass spectrometer equipped with a Proxeon nanospray source (Thermo Fisher Scientific). Peptides were eluted using a flow rate of 230 nl min-1, and a binary 3h gradient, respectively 225 min and the data were acquired with the mass spectrometer operated in data-dependent mode with MS/MS scans of the 12 most abundant ions. For peptide identification, the RAW-files were loaded into Proteome Discoverer (version 2.1.0.81, Thermo Scientific) and the created MS/MS spectra were searched using MSAmanda v1.0.0.618658 against Drosophila melanogaster reference translations retrieved from Flybase (dmel_all-translation-r6.06). An in-house-developed tool Peakjuggler was used for the peptide and protein quantification (IMP/IMBA/GMI Protein Chemistry Facility; http://ms.imp.ac.at/?goto=peakjuggler). Using custom R scripts, average enrichment between bait and control IP experiments were calculated. Adjusted p values were calculated using the limma R package59.
RT-qPCR Analysis of Transposon Expression
5-10 pairs of freshly dissected ovaries were homogenized in TRIzol Reagent followed by RNA purification according to the manufacturer’s protocol. 1 µg total RNA was digested with RQ1 RNase-Free DNase (Promega) and then reverse transcribed using random hexamer primers and Superscript II (Invitrogen) following standard protocols. cDNA was then used as template for RTqPCR quantification of transposon and mRNA abundances (for primers see Supplementary Table 2).
Luciferase Reporter Assays
Plasmids for luciferase reporter assays (Supplementary Table 4) were cloned as described in ref. 60 by inserting the open reading frames of GFP or TRF2 (short isoform; Extended Data Fig. 3a) into pAGW-GAL4-DBD_empty and by replacing the developmental core promoter (dCP) of pGL3_4xUAS_UPS_hkCP with 150 bp cluster fragments amplified using the oligos indicated in Supplementary Table 2. For plasmid transfections 1 x 10⁵ S2 cells were seeded in 100 µL S2 cell medium in 96 well plates. For each sample six replicate wells were seeded and the cells were allowed to settle for four hours. The S2 cells were then co-transfected with three plasmids using FuGene HD Transfection Reagent (Promega). Each well was transfected with a total of 80 ng plasmid in the following mixture: 5 ng pUbi_RL, which drives ubiquitous expression of Renilla firefly luciferase as a transfection and viability control; 25 ng pGL3 reporter vector containing individual putative core promoters; 50 ng pAct5C vector expressing Gal4-DNA binding domain (DBD) fused to either GFP or Trf2 (pAGW-GAL4-DBD_GFP / TRF2S). 48 hours later the transfected cells were washed with PBS and lysed in 40 µL 1x Passive Lysis Buffer (Dual-Luciferase Reporter Assay System, Promega). Firefly and Renilla luciferase activity was measured on a Synergy H1 plate reader (BioTek). For analyses, firefly luciferase activity was normalized to that of Renilla and averaged over technical replicates. Average values from five such biological replicates were then calculated and analyzed for statistical difference between GAL4-DBD-GFP and GAL4-DBD-TRF2 tethering for each reporter construct by two-tailed t-tests (for calculations, see figure source data).
Immunofluorescence staining of ovaries
5-10 ovaries were dissected into ice-cold PBS and then immediately fixed by incubation in IF Fixing Buffer (4 % paraformaldehyde, 0.3 % Triton X-100, 1x PBS) for 20 minutes at room temperature. The fixed ovaries were then washed three times 10 minutes in PBX (0.3 % Triton X-100, 1x PBS) and blocked with BBX (0.1% BSA, 0.3 % Triton X-100, 1x PBS) for 30 minutes. Blocked ovaries were incubated overnight at 4°C with antibodies diluted in BBX followed by three washes in PBX. Subsequently, the ovaries were incubated with fluorophore-coupled secondary antibodies overnight at 4°C, washed three times in PBX with the second wash done with DAPI added to the PBX to stain DNA. The samples were images on a Zeiss LSM-780 Axio Imager confocal-microscope and the resulting images processed using FIJI/ImageJ61. Rabbit anti-Rhino antibodies are described in ref. 6.
RNA Fluorescent In Situ Hybridization (FISH)
5-10 ovary pairs were dissected into ice-cold PBS and fixed in formaldehyde solution (4% formaldehyde, 0.15% Triton X-100 in PBS) for 20 minutes at room temperature with agitation. The fixed ovaries were then washed three times 10 minutes in 0.3 % Triton-TX100 / PBS and permeabilized overnight at 4°C in 70 % ethanol. For probe hybridization, permeabilized ovaries were first rehydrated for 5 minutes in RNA FISH Wash Buffer (10 % (v/w) formamide in 2x SSC). Subsequently, the ovaries were resuspended in 50 µL Hybridization Buffer (10 % (v/w) dextran sulfate and 10 % (v/w) formamide in 2X SSC) and 0.5 µL 25 µM Stellaris RNA probe set (for probe sequences see Supplementary Table 5) was added followed by an overnight incubation at 37°C with rotation. The ovaries were then rinsed twice with RNA FISH Wash Buffer and then rotated one hour at room temperature in a solution of wheat germ agglutinin-coupled Alexa Fluor 488 conjugate (WGA-488) at a final concentration of 5 ng/µL in RNA FISH Wash Buffer. Ovaries were then washed 30 minutes at room temperature in RNA FISH Wash Buffer, incubated 10 minutes in a DAPI/2xSSC solution and finally washed two times 10 minutes in 2xSSC buffer. The wash buffer was then carefully removed and each ovary sample was resuspended in one drop (~40 µL) Prolong Diamond mounting medium before mounting on microscopy slides. Mounted samples were allowed to equilibrate for at least 24 hours before imaging on a Zeiss LSM 780 confocal microscope equipped with an AiryScan detector. Each germline nucleus was imaged with a 40X oil lens in a Z-stack of 120 planes with 150 nm step size. The image stack was subsequently subjected to Airyscan image processing with standard settings. The quantification analysis was performed fully automated using Definiens Developer Suite XD. The nucleus was segmented in 3D on the DAPI channel, the borders were refined using a DoG-filtered version of the WGA-488 signal (proxy for nuclear membrane). Within the nucleus the genomic loci were segmented on Channel 1 (cluster20A RNA FISH in the far-red channel) and Channel 2 (cluster42AB or cluster38C1 RNA FISH in the red channel). A Bandpass filter was applied to shape out the loci and reduce differences in intensities for segmentation. Larger clusters were segmented into individual spots by detecting seed points on local maxima. RNA FISH signal from cluster transcripts is observed both inside the nucleus (representing transcription loci6) and in the cytoplasmic nuclear peripheral region, the nuage. Therefore, to quantify specifically the transcriptional output of piRNA source loci, only loci objects within the nucleus were counted. Objects touching the borders with more than 25% surface area were excluded from the analysis as these may not represent transcriptional foci. Segmented loci were then resized to the full width of half maximum (FWHM) to approximate the real extent. Number, size and intensities per cell and channel were exported for analysis and plotting in R. Statistical difference between genotype groups was tested using non-parametric Wilcoxon rank sum tests.
Defining and Curating 1 kb Genomic Windows
The genome 1kb tiles were generated as previously described6. Briefly, we split the main chromosomes of Drosophila melanogaster dm6 (r6.10) genome into non-overlapping 1kb tiles. A mappability score was then given to each tile based on mappability estimation using mapping of synthetic short reads of 25 nt length.
ChIP-Seq
With minor modifications, ChIP was performed as described in ref. 62. Briefly, ~200 pairs of ovaries were dissected into ice-cold PBS, rinsed once and cross-linked in 1.8 % para-formaldehyde/PBS for 10 minutes at room temperature. Glycine was then added to quench the cross-linking reaction and the ovaries were washed in PBS followed by homogenization in a glass douncer using a tight pestle. Nuclei were then lysed on ice for 20 minutes and DNA was then sheared for 20 minutes using a Covaris E220 Ultrasonicator. Nuclear lysates were incubated overnight at 4°C with antibodies specific to the target epitope. 50 µL of a 1:1 mix of Protein A and Protein G Dynabeads were then added and samples were incubated 2 hours at 4°C. The beads were then washed multiple times and DNA-protein complexes were eluted and de-cross-linked overnight at 65°C. RNA and protein was digested by RNase A and Proteinase K treatment, respectively, before final DNA purification using ChIP DNA Clean & Concentrator columns (Zymo). ChIP efficiency was assessed by qPCR using part of the IP sample and the remainder was then used to prepare barcoded libraries using the NEBNext Ultra DNA Library Prep Kit for Illumina (NEB) and finally sequenced on a HiSeq2500 (Illumina).
ChIP-Seq Analysis
ChIPseq reads were trimmed to high quality bases 5-45 before mapping to the Drosophila melanogaster genome (dm6, r6.10) using Bowtie (release 0.12.9) with 0-mismatch tolerance. Reads were then computationally extended to 300 nt, reflecting an estimated median DNA fragment length. Normalization between samples was done based on the number of genome-unique mapping reads for each sample. Subsequent quantification of reads mapping to 1 kb tiles was done using bedtools, while relative quantification and plotting was done in R (see code availability below). Briefly, Rhino ChIP-seq tile signal was normalized to the estimated mappability scores for each 1 kb window, while for Pol II ChIP-seq normalization was done by quantile normalization using the preprocessCore R package. This normalization is under the assumption the Pol II occupancy does not change globally in any of the assayed genotypes (justified by the observed completion ovary development in all genotypes). A pseudo-count of 1 was then added to each tile value before calculation of log2 fold-change values relative to control genotype samples.
RNA-Seq
Total RNA was purified further using RNAeasy columns, including an on-column DNase I digest (QIAGEN). Five micrograms of purified total RNA was subjected twice to Ribo-Zero rRNA removal using the magnetic Human-Mouse-Rat kit (Illumina). Libraries were then cloned using the NEBNext® Ultra™ Directional RNA Library Prep Kit for Illumina® (NEB), following the recommended kit protocol and sequenced on a HiSeq2500 (Illumina). The modENCODE RNAseq data63 presented in Extended Data Fig. 2a was extracted from Flybase.
RNA-Seq Analysis
RNA-Seq reads were trimmed to high quality bases 5-45 before mapping to the Drosophila genome (dm6, r6.10) using STAR64 or to Drosophila melanogaster transposon consensus sequences using SALMON65. For genomic mapping by STAR normalization between samples was done based on the number of genome-unique mapping reads for each sample. Subsequent quantification of reads mapping to 1 kb tiles was done using bedtools, while relative quantification and plotting was done in R. Briefly, RNA-seq tile signal was normalized to the estimated mappability scores for each 1 kb window. A pseudo-count of 1 was then added to each tile value before calculation of log2 fold-change values relative to control genotype samples.
Cap-Seq
CapSeq was performed based on ref. 15 and ref. 66. In brief, 1 µg total RNA isolated from wildtype ovaries was treated with TurboDNase (Thermo Fisher Scientific) and purified using RNA Clean & Concentrator-5 columns (Zymo). 5'-monophosphorylated RNAs were then digested by Terminator Exonuclease enzyme (EpiCentre) and any remaining 5' phosphorylated RNAs were dephosphorylated by treatment with Calf Intestine Alkaline Phosphatase (CIP). Following, 5' caps were removed by treatment with Tobacco Acid Pyrophosphatase (TAP) enzyme (EpiCentre; note: the product has been discontinued, but can be replaced by RNA 5' Pyrophosphohydrolase (RppH) from NEB). 5' linkers were then ligated to the decapped RNA 5' ends and cDNA was generated by reverse transcription using an Illumina-compatible RT primer with eight random 3' nucleotides to allow random priming. The cDNA libraries were amplified by PCR using KAPA HiFi HotStart Realtime Mix (Peqlab) and sequenced on a HiSeq2500 (Illumina).
Degradome-Seq
Degradome-seq for profiling of 5'-monophosphorylated RNA 5' ends was done using the CapSeq protocol, but omitting the Terminator Exonuclease, CIP and TAP enzymatic reactions.
Cap-seq and Degradome-seq Analysis
Reads were trimmed by removal of the 5' linker sequence including the four random nucleotides. Trimmed reads were then mapped to the Drosophila genome (dm6, r6.10) using Bowtie (release 0.12.9) with 0-mismatch tolerance. Uniquely mapping reads were collapsed to the 5'-most nucleotide for display of 5' ends specifically. For analyses of DNA sequence biases around the mapping position reads mapping to either piRNA clusters or annotated transcription start sites were extracted and counted and the DNA sequence surrounding the 5' end mapping sites was retrieved. These DNA sequences were then analyzed by generation of weblogos or by quantification of YR motif occurrence (see also code availability below).
Small RNA-Seq
Small RNA libraries were generated as previously described67. Briefly, 18-29 nt long small RNAs were purified by preparative PAGE from 20 µg of total ovarian RNA. Following, the 3' linker (containing four random nucleotides) was ligated overnight using T4 RNA Ligase 2, truncated K227Q (NEB) after which the products were recovered by a second PAGE purification. 5' RNA linkers with four terminal random nucleotides were then ligated to the small RNAs using T4 RNA ligase (NEB) followed by a third PAGE purification. The cloned small RNAs were then reverse transcribed and PCR amplified before sequencing on a HiSeq2500 (Illumina). All linker and primer sequence are given in Supplementary Table 2.
Small RNA-Seq Analysis
Small RNA sequencing reads were trimmed by removal of the 3' linker sequence (AGATCGGAAGAGCACACGTCT), as well as the four random nucleotides at each end. Trimmed reads were then mapped to the Drosophila genome (dm6, r6.10) using Bowtie (release 0.12.9) with 0-mismatch tolerance. Genome coverage was calculated and normalized to the number of uniquely mapping microRNA reads (in millions). Reads mapping to rRNA, tRNA, snRNA and snoRNA were excluded. Subsequent quantification of reads mapping to 1 kb tiles was done using bedtools, while relative quantification and plotting was done in R (see code availability below). Briefly, small RNA-seq tile signal was normalized to the estimated mappability scores for each 1 kb window. A pseudo-count of 1 was then added to each tile value before calculation of log2 fold-change values relative to control genotype samples.
Distant homology searches
An iterative NCBI-PSIBLAST (version 2.4.0+) search with the Drosophila melanogaster conserved region of Moonshiner (aa 9-168) first identified all Drosophila orthologs in round 1. In the following iteration, numerous transcription initiation factor IIA subunit 1 (TFIIA-L) proteins were hit significantly, among those were Dendroctonus ponderosae XP_019771835.1 (region 15-165, e-value 6 x 10-07), Tribolium castaneum XP_969067.1 (region 15-160, e-value 2 x 10-05), and Drosophila melanogaster NP_476995.1 (region 138-244, e-value 0.001). In round 3, after incorporation of insect TFIIA-L proteins into the PSSM model (default inclusion threshold of 0.002), the Mus musculus GTF2A1L hit significantly (NP_076119.2, region 12-83, e-value 0.007). Unlike the arthropod TFIIA-L family that covers both Moonshiner domains, vertebrate GTF2A1 hits lie mainly in the amino-terminal domain. In an alternative search strategy, a hidden Markov model68 with conserved regions of Moonshiner orthologs significantly identified arthropod TFIIA-L proteins such as Aedes aegypti XP_001652503.1 (regions 13-53 and 160-243, e-value 1.5 x 10-07).
Ortholog identification and alignment
An NCBI-BLASTP69 search with the Drosophila melanogaster Moonshiner protein (172 amino acids) within the NCBI non-redundant protein database identified orthologs solely in the Drosophila genus with significant e-values below 1 x 10⁻¹⁰. The sequences were aligned with MAFFT70 (mafft-linsi, version v7.305b), visualized in Jalview71, and the secondary structure was predicted with JPRED72. The relevant Moonshiner and TFIIA-L sequence accessions can be found in Supplementary Table 6. Two conserved domains could be identified. The amino-terminal domain covers D. melanogaster residues 9 to 64, is characterized by two distinctive alpha helices, and separated from the carboxy-terminal domain (residues 91 to 168) by a compositionally biased region, rich in proline and lysine residues73.
Plotting and data visualization
Data visualization and statistical analyses were done using R74 in conjunction with the following software packages: ggplot275, reshape76, scales77 and preprocessCore78. The UCSC genome browser79,80 was used to explore sequencing data as well as to prepare the genome browser panels shown in the individual figures of the manuscript.
Data and Software Availability
The main scripts used for the presented analyses as well as raw confocal image files are available upon request or from https://gitlab.com/Andersen_Moonshiner_2017. All sequencing data produced for this publication has been deposited to the NCBI GEO archive under the accession number GSE97719. The mass spectrometry proteomics data have been deposited to the ProteomeXchange Consortium via the PRIDE81 partner repository with the dataset identifier PXD005026
Extended Data
Extended Data Figure 1. Characterization of transcription initiation events at piRNA clusters.
a, Size profile histograms of small RNAs mapping to the Pld gene locus from ovaries with indicated genotypes. siRNAs (21 nt) are highlighted in orange and piRNAs (23-29 nt) are highlighted in green. b, UCSC genome browser panels showing cluster80F for which flanking promoter dependency was investigated by deletion of the promoter region of alpha-Catenin. Shown are Pol II occupancy (red), Rhino occupancy (blue) and piRNA levels (black/grey). Flanking transcription units are shown in grey, light grey shading indicates the experimental promoter deletion. As alpha-Catenin is an essential gene, a cDNA rescue transgene was expressed from another locus. c, UCSC genome browser panels showing the CapSeq profile at the promoter of a canonical gene. d, DNA sequence motif at 5' ends of capped RNAs mapping to Rhino-bound genomic loci (Rhino ChIPseq RPKM > 300; cluster80F and 42AB excluded) outside of known transcription units. e, DNA sequence motif at 5' ends of 5'-monophosphorylated RNAs mapping to cluster42AB or cluster80F. The schematic to the right shows how the ‘ping-pong’ amplification loop involving Aub and Ago3-mediated cleavages gives rise to the observed sequence biases at position +1 and +10. f, Histogram of the ‘YR’ dinucleotide occurrence around cluster42AB and cluster80F transcription start sites (expected chance occurrence: 25%).
Extended Data Figure 2. CG12721/Moonshiner is a germline-specific TFIIA-L paralog.
a, Expression levels of indicated genes in larval/adult tissues based on modENCODE RNAseq data. RPKM: reads per kilobase per million mappers. b, The top schematic denotes the two regions of homology shown in Fig. 2a. Shown below is the amino acid sequence alignment of these two regions from Drosophilid species (Moonshiner) and selected insect species (TFIIA-L). The alignment was created using JalView with standard ClustalX color coding and conservation score calculation. c-d, Western blot analyses of FLAG-Moonshiner co-immunoprecipitation from lysates of S2 cells transfected with indicated expression constructs (IN: input; UB: unbound; IP: immunoprecipitate; asterisk indicates signal from anti-FLAG heavy chain).
Extended Data Figure 3. Moonshiner forms an alternative TFIIA-TRF2 complex enriched at piRNA clusters.
a, TRF2 isoform characterization by total wildtype ovary RNAseq (top panel) and LAP-Moon co-IP mass spectrometry (lower panel). The identified TRF2 peptides show that Moonshiner is in complex only with the shorter TRF2 isoform. We therefore investigated specifically this isoform, also known as TRF2S, in the remainder of the paper. b-c, Absolute peptide peak intensities for the main protein interactors identified in Fig. 2b,c. Peak area intensities are displayed as IP values subtracted that of the paired control IP experiment. Based on this, we conclude that TFIIA-S and TRF2 are robust Moonshiner interactors (supportive of an alternative TFIIA-TRF2 complex), while only a small fraction of Moonshiner is bound to Deadlock. Furthermore, the data show that in ovaries, TRF2 interacts predominantly with canonical TFIIA, but also clearly with Moonshiner. Black dots represent individual replicate values. Orange bars show median values. d, Western blot analyses as Extended Data Fig. 2d, but addressing interaction with HA-TRF2 (lower bands likely represent TRF2 decay intermediates). e, Schematic of a developing Drosophila ovariole with germline cells in beige and somatic support cells in green. Confocal images were typically taken from egg-chambers of stage 7 (highlighted by a dashed box). f, Whole egg chamber confocal image stained for DNA (DAPI; blue), LAP-Moonshiner (GFP auto-fluorescence; green), Rhino (magenta), and Deadlock (cyan). The circled nucleus is shown in Fig. 2d. g, Fluorescence images of nurse cell nuclei (depleted for indicated factors using sh-lines) indicating levels and localization of Moonshiner and Rhino (scale bar: 5 µM). h, Western blot showing levels of LAP-Moonshiner in ovaries where the indicated factors were depleted in the germline via sh-lines (ATP synthase serves as loading control).
Extended Data Figure 4. Moonshiner mutants reveal highly specific function at Rhino-bound piRNA clusters.
a, Schematic of the moonshiner frameshift alleles generated by CRISPR/Cas9. b, piRNA levels from ovaries with indicated genotype (relative to wildtype) mapping uniquely to indicated piRNA clusters. c, Left panels indicate the deregulation of steady state transposon transcript levels (RNAseq; sense only) in ovaries of the indicated mutants fly strains. The right panels show changes in corresponding piRNA levels (antisense only). The y-axis values show log2 fold-change of TPM (Transcripts Per Million) values relative to wildtype. Each bar represents one transposon consensus sequence (n=73; shown are only transposons with minimum expression of RNAseq TPM > 5 in any library). Sorting of transposons in all panels is identical. The plotted values are available as figure source data. d, Rhino occupancy at indicated major piRNA clusters as well as all other Rhino-bound loci is shown as boxplot quantification (n = 1kb windows analyzed for each group) of Rhino ChIPseq read coverage in the indicated genotypes. Boxplots are defined as in Fig. 3c; *** : p value < 0.0001 based on Mann-Whitney-Wilcoxon non-parametric tests). e, Genome browser panel showing read coverage at cluster80F of the data underlying the log2 fold-change tracks shown in Fig. 3b. Shown are RNAseq (green), Pol II ChIPseq (red) and ChIPseq input samples (purple) generated from the indicated genotypes. f, RNAseq TPM values for canonical genes compared between control and moonshiner-/- (left panel) or rhino-/- (right panel); key genes related to Moonshiner biology are highlighted in orange. g, Representative confocal images underlying the quantitative RNA FISH-based detection of piRNA precursors from cluster20A (Rhino-independent) and cluster42AB (Rhino-dependent) in germline nuclei of wildtype and moonshiner mutant ovaries. h, Example confocal images of germline nuclei stained for of DNA (DAPI) and nuclear pore complexes (wheat germ agglutinin, WGA-488), which were used to define the nuclear region in whole-nucleus Z-stack images acquired in parallel with images of RNA FISH signal. i, Example single plane images of dual-channel RNA FISH quantification of whole germline nuclei. RNA FISH signal within the nuclear regions (left panels, segmented using DAPI and WGA-488 signal) was used to define regions of interest (ROIs, right panels), representing active sites of piRNA cluster transcription6. Signal in the foci was subsequently quantified for whole nuclei.
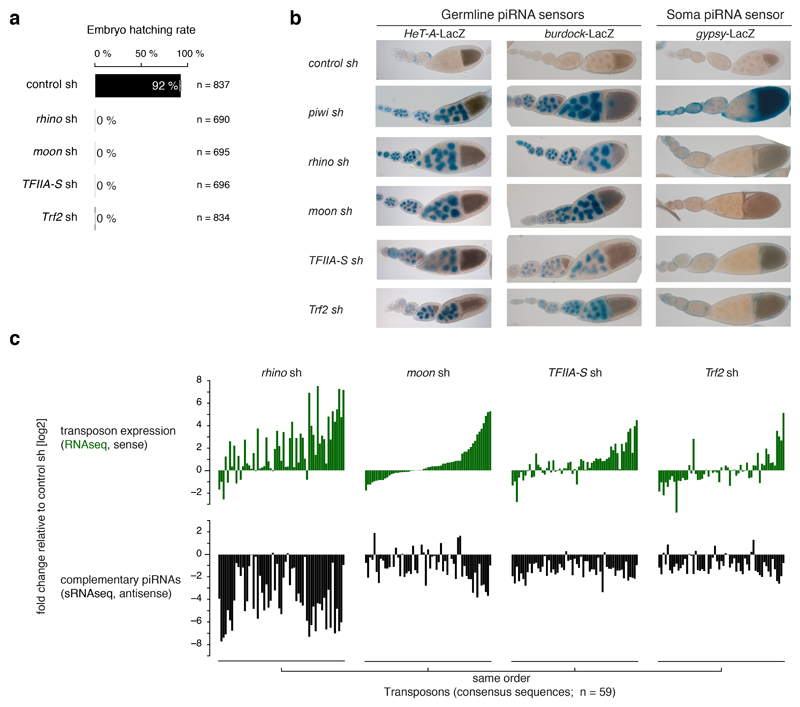
Extended Data Figure 5. Depletion of Moonshiner, TFIIA-S, or Trf2 activates transposon expression.
a, Percentages of eggs hatching into larvae laid by females expressing sh-constructs against the indicated target genes in their germline cells. Error bars indicate standard error of the mean from four independent countings while n represent the sum of counted eggs (see also figure source data). b, Ovarioles from flies expressing indicated piRNA sensors and indicated germline knockdown constructs (sh-lines) stained for beta-Galactosidase with X-gal. c, Upper panels indicate the deregulation of steady state transposon transcript levels (sense only; compared to control ovaries) in ovaries expressing the indicated germline knockdown constructs. Each bar represents one transposon consensus sequence (n=59; shown are only transposons with minimum expression of RNAseq TPM > 5 in any library). Lower panels show changes in corresponding piRNA levels (antisense only). Sorting of transposons in all panels is identical. For plotted values see figure source data.
Extended Data Figure 6. piRNA production from Rhino-bound clusters requires Moonshiner, TFIIA-S, and Trf2.
a, UCSC genome browser panel showing piRNA profiles at cluster80F in ovaries expressing indicated germline knockdown constructs. b, Levels of piRNAs (relative to control) mapping uniquely to indicated Rhino-dependent or Rhino-independent piRNA clusters and derived from ovaries depleted of the indicated factors. c-d, UCSC genome browser panel showing cluster20A (c) or cluster42AB (d) piRNA levels from ovaries expressing indicated germline knockdown constructs.
Extended Data Figure 7. Characterization of Rhino-dependent, but Moonshiner-independent piRNA production.
a, Log2 fold-changes in levels of piRNAs mapping antisense to transposons are plotted for rhino mutants versus moonshiner mutants. An outlier group of transposons for which the level of antisense piRNAs is decreased in rhino mutants, but increased in moonshiner mutants is apparent and elements enriched in cluster38C1/2 are highlighted in orange. The same transposons are shown as in Extended Data Fig. 4c (n=73). b, Quantification of relative piRNA levels originating from cluster38C1 in ovaries from flies subjected to the indicated germline knockdowns. Percentages relative to control knockdowns were calculated with the total numbers of piRNA reads mapping uniquely to cluster38C1. c, Representative confocal images underlying the quantitative RNA FISH-based detection of piRNA precursors from cluster20A (Rhino-independent) and cluster38C1 (Rhino-dependent) in germline nuclei of wildtype and moonshiner mutant ovaries. d, UCSC genome browser panel showing the most distal part of cluster42AB for which piRNA production dependency on the right flanking promoter was investigated by deletion of the promoter region. Shown are Pol II occupancy (red), Rhino occupancy (blue), and piRNA levels (black/grey). Flanking transcription units are shown in grey, light grey shading indicates the experimental promoter deletion.
Extended Data Figure 8. Moonshiner function can be bypassed by directly connecting Deadlock to Trf2.
a, Experimental scheme used to recruit GFP or TRF2 to DNA upstream of sequences of interest to test for stimulation of Luciferase transcription. Bar diagram shows fold changes in reporter activity upon tethering of TRF2 versus GFP to wildtype or mutant Histone 1 core promoter or to random piRNA cluster fragments (error bars: standard error; n=5; *: p value < 0.05 based on two-tailed paired t-tests). b, Firefly luciferase values underlying the relative activities shown in a. Firefly luciferase activity was normalized to Renilla luciferase activity (transfection and viability control) upon tethering of TRF2 versus GFP to wildtype or mutant Histone 1 core promoter or to ten random piRNA cluster fragments (error bars indicate standard deviation (SD) of 5 biological replicates with each 6 technical replicates. c, Confocal images showing localization of LAP-Moonshiner and Rhino in germline nuclei of ovaries depleted for indicated factors (scale bar: 5 µM). d, Western blot showing levels of LAP-Moonshiner in ovaries where the indicated factors were depleted in the germline via sh-lines (ATP synthase serves as loading control). e, Confocal images showing localization of germline-expressed LAP-TRF2 and endogenous Rhino in control ovaries (top) or in ovaries expressing the Deadlock:GFP-nanobody fusion protein (scale bar: 5 µM). The TRF2 accumulations in wildtype nuclei do not overlap with Rhino-foci and instead are reported to be TRF2 accumulations at the repetitive histone loci31. We note that TRF2 accumulation at Rhino foci is not visible in wildtype cells, most likely as the levels of this protein are too high to detect this local enrichment, that depends on Moonshiner (a protein expressed at only low levels). f, Representative images of DAPI-stained embryos (inverted monochromatic) assessed for progress of early embryogenesis. The left panels show two images of normal embryo development at the blastoderm stage (upper image) and at the extended germband stage (after gastrulation; lower image). The right panels show a typical moonshiner mutant embryo arrested early in development (no distinct nuclei are visible; the lower image displays the top image at increased brightness). g, Percentages of embryos with the indicated genotype displaying successful hatching. h, Relative levels of steady state transposon mRNAs that are underlying the panel displayed in Fig. 5d. Bars show mean levels relative to those measured in moon-/- samples. Error bars display standard deviation values of three biological replicates and * denotes a p value of < 0.05 from two-tailed t-tests for difference to moonshiner full mutant samples. i, Levels of piRNAs mapping uniquely to the indicated clusters (grey: Rhino-independent; black: Rhino-dependent) in the indicated genotypes (values are normalized to the wildtype control levels). j, Log2 fold-changes in levels of piRNAs mapping antisense to transposons are plotted relative to levels in moonshiner mutants. The green boxes highlight the set of transposons for which mutation of moonshiner results in decreased antisense piRNAs (n=111; transposons with fewer then 100 antisense piRNAs per million were removed from the analyses).
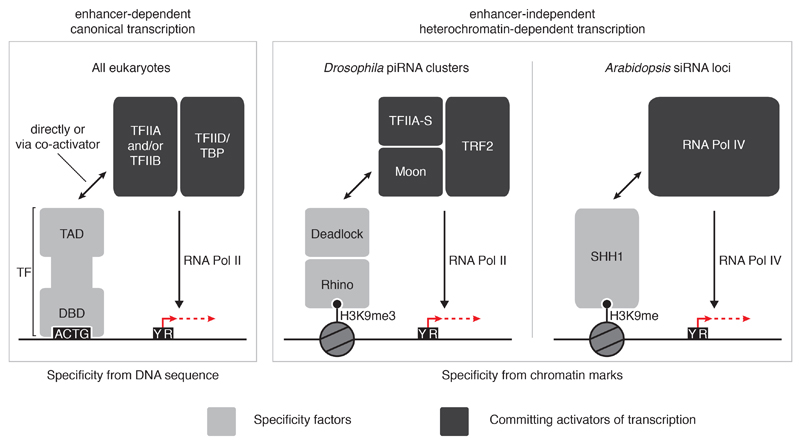
Extended Data Figure 9. Comparison of canonical enhancer-dependent and heterochromatin-dependent transcription activation pathways.
Schematic comparison of canonical (enhancer-dependent) transcription and transcription of small RNA source loci in Drosophila and Arabidopsis specified by chromatin marks (enhancer-independent). Canonical transcription initiation is driven by sequence-specific transcription factor binding to DNA motifs in accessible enhancer and promoter regions, which subsequently leads to positioning of TFIID/TBP onto core promoters (left panel). In contrast, while Moonshiner-mediated transcription also converges on recruitment of TFIID to DNA, this pathway exclusively utilizes the TBP paralog TRF2. Furthermore, Moonshiner-mediated transcription gains locus specificity via recognition of heterochromatic histone marks via the HP1 protein Rhino, rather than through DNA motifs, thereby circumventing the transcriptional inhibition imposed by the compact state of heterochromatic DNA (middle panel). In plants, a conceptually similar pathway has evolved using an entirely different set of proteins (right panel). Here, the homeodomain protein SHH1 binds H3K9me histone marks and subsequently recruits the Pol IV variant RNA polymerase complex to transcribe small RNA precursors.
Supplementary Material
Acknowledgements
We thank K. Meixner for experimental support, D. Handler and D. Jurczak for bioinformatics help, P. Duchek and J. Gokcezade for generating CRISPR-edited and transgenic flies, K. Mechtler & his team for mass spectrometry, T. Lendl for RNA FISH quantification, A. Schleiffer and M. Novatchkova for Moonshiner phylogenetic analysis, the VBCF NGS unit for deep sequencing, M. Elmaghraby for the Deadlock antigen, the MFPL monoclonal facility for the Deadlock antibody, and the VDRC, TRiP, and Bloomington stock centers for flies. We thank A. Ordonez, D. Handler, F. Mohn, F. Muerdter, M. Bühler, and especially O. Wueseke (http://impulse-science.org) and Life Science Editors (http://lifescienceeditors.com) for comments on the manuscript. This work was supported by the Austrian Academy of Sciences, the European Community (ERC grant #260711EU and ERC-2015-CoG-682181). P.R.A is supported by fellowships from the Alfred Benzon Foundation and the Novo Nordisk Foundation.
Footnotes
Author contributions
P.R.A. performed the experiments except the genetic bypass and promoter deletion experiments (both L.T.), and the S2 cell-based protein interaction assays (M.V.). P.R.A and J.B. analyzed the data and wrote the paper.
Competing financial interests
The authors declare no competing financial interests
References
- 1.Fedoroff NV. Transposable Elements, Epigenetics, and Genome Evolution. Science. 2012;338:758–767. doi: 10.1126/science.338.6108.758. [DOI] [PubMed] [Google Scholar]
- 2.Castel SE, Martienssen RA. RNA interference in the nucleus:roles for small RNAs in transcription,epigenetics and beyond. Nat Rev Genet. 2013;14:100–112. doi: 10.1038/nrg3355. [DOI] [PMC free article] [PubMed] [Google Scholar]
- 3.Holoch D, Moazed D. RNA-mediated epigenetic regulation of gene expression. Nat Rev Genet. 2015;16:71–84. doi: 10.1038/nrg3863. [DOI] [PMC free article] [PubMed] [Google Scholar]
- 4.Siomi MC, Sato K, Pezic D, Aravin AA. PIWI-interacting small RNAs: the vanguard of genome defence. Nature reviews Molecular cell biology. 2011;12:246–258. doi: 10.1038/nrm3089. [DOI] [PubMed] [Google Scholar]
- 5.Czech B, Hannon GJ. One Loop to Rule Them All: The Ping-Pong Cycle and piRNA-Guided Silencing. Trends in Biochemical Sciences. 2016;41:324–337. doi: 10.1016/j.tibs.2015.12.008. [DOI] [PMC free article] [PubMed] [Google Scholar]
- 6.Mohn F, Sienski G, Handler D, Brennecke J. The rhino-deadlock-cutoff complex licenses noncanonical transcription of dual-strand piRNA clusters in Drosophila. Cell. 2014;157:1364–1379. doi: 10.1016/j.cell.2014.04.031. [DOI] [PubMed] [Google Scholar]
- 7.Brennecke J, et al. Discrete Small RNA-Generating Loci as Master Regulators of Transposon Activity in Drosophila. Cell. 2007;128:1089–1103. doi: 10.1016/j.cell.2007.01.043. [DOI] [PubMed] [Google Scholar]
- 8.Le Thomas A, et al. Transgenerationally inherited piRNAs trigger piRNA biogenesis by changing the chromatin of piRNA clusters and inducing precursor processing. Genes & Development. 2014;28:1667–1680. doi: 10.1101/gad.245514.114. [DOI] [PMC free article] [PubMed] [Google Scholar]
- 9.Klattenhoff C, et al. The Drosophila HP1 Homolog Rhino Is Required for Transposon Silencing and piRNA Production by Dual-Strand Clusters. Cell. 2009;138:1137–1149. doi: 10.1016/j.cell.2009.07.014. [DOI] [PMC free article] [PubMed] [Google Scholar]
- 10.Zhang Z, et al. The HP1 homolog rhino anchors a nuclear complex that suppresses piRNA precursor splicing. Cell. 2014;157:1353–1363. doi: 10.1016/j.cell.2014.04.030. [DOI] [PMC free article] [PubMed] [Google Scholar]
- 11.Sainsbury S, Bernecky C, Cramer P. Structural basis of transcription initiation by RNA polymerase II. Nature reviews Molecular cell biology. 2015;16:129–143. doi: 10.1038/nrm3952. [DOI] [PubMed] [Google Scholar]
- 12.Buratowski S, Hahn S, Guarente L, Sharp PA. Five intermediate complexes in transcription initiation by RNA polymerase II. Cell. 1989;56:549–561. doi: 10.1016/0092-8674(89)90578-3. [DOI] [PubMed] [Google Scholar]
- 13.Papai G, et al. TFIIA and the transactivator Rap1 cooperate to commit TFIID for transcription initiation. Nature. 2010;465:956–960. doi: 10.1038/nature09080. [DOI] [PMC free article] [PubMed] [Google Scholar]
- 14.Chen Y-CA, et al. Cutoff Suppresses RNA Polymerase II Termination to Ensure Expression of piRNA Precursors. Mol Cell. 2016;63:97–109. doi: 10.1016/j.molcel.2016.05.010. [DOI] [PMC free article] [PubMed] [Google Scholar]
- 15.Gu W, et al. CapSeq and CIP-TAP identify Pol II start sites and reveal capped small RNAs as C. elegans piRNA precursors. Cell. 2012;151:1488–1500. doi: 10.1016/j.cell.2012.11.023. [DOI] [PMC free article] [PubMed] [Google Scholar]
- 16.Kaufmann J, Smale ST. Direct recognition of initiator elements by a component of the transcription factor IID complex. Genes & Development. 1994;8:821–829. doi: 10.1101/gad.8.7.821. [DOI] [PubMed] [Google Scholar]
- 17.Purnell BA, Emanuel PA, Gilmour DS. TFIID sequence recognition of the initiator and sequences farther downstream in Drosophila class II genes. Genes & Development. 1994;8:830–842. doi: 10.1101/gad.8.7.830. [DOI] [PubMed] [Google Scholar]
- 18.Gunawardane LS, et al. A slicer-mediated mechanism for repeat-associated siRNA 5' end formation in Drosophila. Science. 2007;315:1587–1590. doi: 10.1126/science.1140494. [DOI] [PubMed] [Google Scholar]
- 19.Czech B, Preall JB, McGinn J, Hannon GJ. A Transcriptome-wide RNAi Screen in the Drosophila Ovary Reveals Factors of the Germline piRNA Pathway. Molecular Cell. 2013;50:749–761. doi: 10.1016/j.molcel.2013.04.007. [DOI] [PMC free article] [PubMed] [Google Scholar]
- 20.Geiger JH, Hahn S, Lee S, Sigler PB. Crystal structure of the yeast TFIIA/TBP/DNA complex. Science. 1996;272:830–836. doi: 10.1126/science.272.5263.830. [DOI] [PubMed] [Google Scholar]
- 21.Tan S, Hunziker Y, Sargent DF, Richmond TJ. Crystal structure of a yeast TFIIA/TBP/DNA complex. Nature. 1996;381:127–151. doi: 10.1038/381127a0. [DOI] [PubMed] [Google Scholar]
- 22.Dantonel JC, Quintin S, Lakatos L, Labouesse M, Tora L. TBP-like factor is required for embryonic RNA polymerase II transcription in C. elegans. Molecular Cell. 2000;6:715–722. doi: 10.1016/s1097-2765(00)00069-1. [DOI] [PubMed] [Google Scholar]
- 23.Kaltenbach L, Horner MA, Rothman JH, Mango SE. The TBP-like factor CeTLF is required to activate RNA polymerase II transcription during C. elegans embryogenesis. Molecular Cell. 2000;6:705–713. doi: 10.1016/s1097-2765(00)00068-x. [DOI] [PubMed] [Google Scholar]
- 24.Kopytova DV, et al. Two Isoforms of Drosophila TRF2 Are Involved in Embryonic Development, Premeiotic Chromatin Condensation, and Proper Differentiation of Germ Cells of Both Sexes. Molecular and Cellular Biology. 2006;26:7492–7505. doi: 10.1128/MCB.00349-06. [DOI] [PMC free article] [PubMed] [Google Scholar]
- 25.Müller F, Lakatos L, Dantonel J, Strähle U, Tora L. TBP is not universally required for zygotic RNA polymerase II transcription in zebrafish. Current Biology. 2001;11:282–287. doi: 10.1016/s0960-9822(01)00076-8. [DOI] [PubMed] [Google Scholar]
- 26.Veenstra GJ, Weeks DL, Wolffe AP. Distinct roles for TBP and TBP-like factor in early embryonic gene transcription in Xenopus. Science. 2000;290:2312–2315. doi: 10.1126/science.290.5500.2312. [DOI] [PubMed] [Google Scholar]
- 27.Martianov I, et al. Late arrest of spermiogenesis and germ cell apoptosis in mice lacking the TBP-like TLF/TRF2 gene. Molecular Cell. 2001;7:509–515. doi: 10.1016/s1097-2765(01)00198-8. [DOI] [PubMed] [Google Scholar]
- 28.Zhang D, Penttila TL, Morris PL, Teichmann M, Roeder RG. Spermiogenesis deficiency in mice lacking the Trf2 gene. Science. 2001;292:1153–1155. doi: 10.1126/science.1059188. [DOI] [PubMed] [Google Scholar]
- 29.Jinek M, et al. A programmable dual-RNA-guided DNA endonuclease in adaptive bacterial immunity. Science. 2012;337:816–821. doi: 10.1126/science.1225829. [DOI] [PMC free article] [PubMed] [Google Scholar]
- 30.Yokomori K, et al. Drosophila TFIIA directs cooperative DNA binding with TBP and mediates transcriptional activation. Genes & Development. 1994;8:2313–2323. doi: 10.1101/gad.8.19.2313. [DOI] [PubMed] [Google Scholar]
- 31.Isogai Y, Keles S, Prestel M, Hochheimer A, Tjian R. Transcription of histone gene cluster by differential core-promoter factors. Genes & Development. 2007;21:2936–2949. doi: 10.1101/gad.1608807. [DOI] [PMC free article] [PubMed] [Google Scholar]
- 32.Rothbauer U, et al. Targeting and tracing antigens in live cells with fluorescent nanobodies. Nature Methods. 2006;3:887–889. doi: 10.1038/nmeth953. [DOI] [PubMed] [Google Scholar]
- 33.Kloc A, Zaratiegui M, Nora E, Martienssen R. RNA Interference Guides Histone Modification during the S Phase of Chromosomal Replication. Current Biology. 2008;18:490–495. doi: 10.1016/j.cub.2008.03.016. [DOI] [PMC free article] [PubMed] [Google Scholar]
- 34.Chen ES, et al. Cell cycle control of centromeric repeat transcription and heterochromatin assembly. Nature. 2008;451:734–737. doi: 10.1038/nature06561. [DOI] [PubMed] [Google Scholar]
- 35.Law JA, et al. Polymerase IV occupancy at RNA-directed DNA methylation sites requires SHH1. Nature. 2013;498:385–389. doi: 10.1038/nature12178. [DOI] [PMC free article] [PubMed] [Google Scholar]
- 36.Law JA, Vashisht AA, Wohlschlegel JA, Jacobsen SE. SHH1, a Homeodomain Protein Required for DNA Methylation, As Well As RDR2, RDM4, and Chromatin Remodeling Factors, Associate with RNA Polymerase IV. PLoS Genet. 2011;7:e1002195–10. doi: 10.1371/journal.pgen.1002195. [DOI] [PMC free article] [PubMed] [Google Scholar]
- 37.Zhai J, et al. A One Precursor One siRNA Model for Pol IV-Dependent siRNA Biogenesis. Cell. 2015;163:445–455. doi: 10.1016/j.cell.2015.09.032. [DOI] [PMC free article] [PubMed] [Google Scholar]
- 38.Hochheimer A, Zhou S, Zheng S, Holmes MC, Tjian R. TRF2 associates with DREF and directs promoter-selective gene expression in Drosophila. Nature. 2002;420:439–445. doi: 10.1038/nature01167. [DOI] [PubMed] [Google Scholar]
- 39.Goriaux C, Desset S, Renaud Y, Vaury C, Brasset E. Transcriptional properties and splicing of the flamenco piRNA cluster. EMBO reports. 2014;15:411–418. doi: 10.1002/embr.201337898. [DOI] [PMC free article] [PubMed] [Google Scholar]
- 40.Hur JK, et al. Splicing-independent loading of TREX on nascent RNA is required for efficient expression of dual-strand piRNA clusters in Drosophila. Genes & Development. 2016;30:840–855. doi: 10.1101/gad.276030.115. [DOI] [PMC free article] [PubMed] [Google Scholar]
- 41.Zhang F, et al. UAP56 Couples piRNA Clusters to the Perinuclear Transposon Silencing Machinery. Cell. 2012;151:871–884. doi: 10.1016/j.cell.2012.09.040. [DOI] [PMC free article] [PubMed] [Google Scholar]
- 42.Zeidler MP, Yokomori K, Tjian R, Mlodzik M. Drosophila TFIIA-S is up-regulated and required during Ras-mediated photoreceptor determination. Genes & Development. 1996;10:50–59. doi: 10.1101/gad.10.1.50. [DOI] [PubMed] [Google Scholar]
- 43.Ni J-Q, et al. A genome-scale shRNA resource for transgenic RNAi in Drosophila. Nature Methods. 2011;8:405–407. doi: 10.1038/nmeth.1592. [DOI] [PMC free article] [PubMed] [Google Scholar]
- 44.Schmitz ML, Stelzer G, Altmann H, Meisterernst M, Baeuerle PA. Interaction of the COOH-terminal transactivation domain of p65 NF-kappa B with TATA-binding protein, transcription factor IIB, and coactivators. J Biol Chem. 1995;270:7219–7226. doi: 10.1074/jbc.270.13.7219. [DOI] [PubMed] [Google Scholar]
- 45.Lieberman PM, Berk AJ. A mechanism for TAFs in transcriptional activation: activation domain enhancement of TFIID-TFIIA--promoter DNA complex formation. Genes & Development. 1994;8:995–1006. doi: 10.1101/gad.8.9.995. [DOI] [PubMed] [Google Scholar]
- 46.Kobayashi N, Boyer TG, Berk AJ. A class of activation domains interacts directly with TFIIA and stimulates TFIIA-TFIID-promoter complex assembly. Molecular and Cellular Biology. 1995;15:6465–6473. doi: 10.1128/mcb.15.11.6465. [DOI] [PMC free article] [PubMed] [Google Scholar]
- 47.Aoyagi N, Wassarman DA. Genes encoding Drosophila melanogaster RNA polymerase II general transcription factors: diversity in TFIIA and TFIID components contributes to gene-specific transcriptional regulation. The Journal of Cell Biology. 2000;150:F45–50. doi: 10.1083/jcb.150.2.f45. [DOI] [PMC free article] [PubMed] [Google Scholar]
- 48.Duttke SHC, Doolittle RF, Wang Y-L, Kadonaga JT. TRF2 and the evolution of the bilateria. Genes & Development. 2014;28:2071–2076. doi: 10.1101/gad.250563.114. [DOI] [PMC free article] [PubMed] [Google Scholar]
- 49.Martianov I, et al. Distinct functions of TBP and TLF/TRF2 during spermatogenesis: requirement of TLF for heterochromatic chromocenter formation in haploid round spermatids. Development. 2002;129:945–955. doi: 10.1242/dev.129.4.945. [DOI] [PubMed] [Google Scholar]
- 50.Oyama T, et al. Cleavage of TFIIA by Taspase1 Activates TRF2-SpecifiedMammalian Male Germ Cell Programs. Developmental Cell. 2013;27:188–200. doi: 10.1016/j.devcel.2013.09.025. [DOI] [PMC free article] [PubMed] [Google Scholar]
- 51.Martianov I, Velt A, Davidson G, Choukrallah M-A, Davidson I. TRF2 is recruited to the pre-initiation complex as a testis-specific subunit of TFIIA/ALF to promote haploid cell gene expression. Sci Rep. 2016;6:32069. doi: 10.1038/srep32069. [DOI] [PMC free article] [PubMed] [Google Scholar]
- 52.Brancorsini S, Davidson I, Sassone-Corsi P. TIPT, a male germ cell-specific partner of TRF2, is chromatin-associated and interacts with HP1. Cell Cycle. 2008;7:1415–1422. doi: 10.4161/cc.7.10.5835. [DOI] [PubMed] [Google Scholar]
- 53.Venken KJT, et al. Versatile P[acman] BAC libraries for transgenesis studies in Drosophila melanogaster. Nature Methods. 2009;6:431–434. doi: 10.1038/nmeth.1331. [DOI] [PMC free article] [PubMed] [Google Scholar]
- 54.Handler D, et al. The Genetic Makeup of the Drosophila piRNA Pathway. Molecular Cell. 2013;50:762–777. doi: 10.1016/j.molcel.2013.04.031. [DOI] [PMC free article] [PubMed] [Google Scholar]
- 55.Sarot E, Payen-Groschêne G, Bucheton A, Pelisson A. Evidence for a piwi-dependent RNA silencing of the gypsy endogenous retrovirus by the Drosophila melanogaster flamenco gene. Genetics. 2004;166:1313–1321. doi: 10.1534/genetics.166.3.1313. [DOI] [PMC free article] [PubMed] [Google Scholar]
- 56.Gokcezade J, Sienski G, Duchek P. Efficient CRISPR/Cas9 plasmids for rapid and versatile genome editing in Drosophila. G3 (Bethesda) 2014;4:2279–2282. doi: 10.1534/g3.114.014126. [DOI] [PMC free article] [PubMed] [Google Scholar]
- 57.Maggert KA, Gong WJ, Golic KG. Methods for homologous recombination in Drosophila. Methods Mol Biol. 2008;420:155–174. doi: 10.1007/978-1-59745-583-1_9. [DOI] [PubMed] [Google Scholar]
- 58.Dorfer V, et al. MS Amanda, a universal identification algorithm optimized for high accuracy tandem mass spectra. J Proteome Res. 2014;13:3679–3684. doi: 10.1021/pr500202e. [DOI] [PMC free article] [PubMed] [Google Scholar]
- 59.Ritchie ME, et al. limma powers differential expression analyses for RNA-sequencing and microarray studies. Nucleic Acids Research. 2015;43:e47–e47. doi: 10.1093/nar/gkv007. [DOI] [PMC free article] [PubMed] [Google Scholar]
- 60.Stampfel G, et al. Transcriptional regulators form diverse groups with context-dependent regulatory functions. Nature. 2015;528:147–151. doi: 10.1038/nature15545. [DOI] [PubMed] [Google Scholar]
- 61.Schindelin J, et al. Fiji: an open-source platform for biological-image analysis. Nature Methods. 2012;9:676–682. doi: 10.1038/nmeth.2019. [DOI] [PMC free article] [PubMed] [Google Scholar]
- 62.Lee TI, Johnstone SE, Young RA. Chromatin immunoprecipitation and microarray-based analysis of protein location. Nature Protocols. 2006;1:729–748. doi: 10.1038/nprot.2006.98. [DOI] [PMC free article] [PubMed] [Google Scholar]
- 63.Brown JB, et al. Diversity and dynamics of the Drosophila transcriptome. Nature. 2014:1–7. doi: 10.1038/nature12962. [DOI] [PMC free article] [PubMed] [Google Scholar]
- 64.Dobin A, et al. STAR: ultrafast universal RNA-seq aligner. Bioinformatics. 2013;29:15–21. doi: 10.1093/bioinformatics/bts635. [DOI] [PMC free article] [PubMed] [Google Scholar]
- 65.Patro R, Duggal G, Love MI, Irizarry RA, Kingsford C. Salmon provides fast and bias-aware quantification of transcript expression. Nature Methods. 2017 doi: 10.1038/nmeth.4197. [DOI] [PMC free article] [PubMed] [Google Scholar]
- 66.Nechaev S, et al. Global analysis of short RNAs reveals widespread promoter-proximal stalling and arrest of Pol II in Drosophila. Science. 2010;327:335–338. doi: 10.1126/science.1181421. [DOI] [PMC free article] [PubMed] [Google Scholar]
- 67.Jayaprakash AD, Jabado O, Brown BD, Sachidanandam R. Identification and remediation of biases in the activity of RNA ligases in small-RNA deep sequencing. Nucleic Acids Research. 2011;39:e141. doi: 10.1093/nar/gkr693. [DOI] [PMC free article] [PubMed] [Google Scholar]
- 68.Eddy SR. Accelerated Profile HMM Searches. PLoS Comput Biol. 2011;7:e1002195–16. doi: 10.1371/journal.pcbi.1002195. [DOI] [PMC free article] [PubMed] [Google Scholar]
- 69.Altschul SF, et al. Gapped BLAST and PSI-BLAST: a new generation of protein database search programs. Nucleic Acids Res. 1997;25:3389–3402. doi: 10.1093/nar/25.17.3389. [DOI] [PMC free article] [PubMed] [Google Scholar]
- 70.Katoh K, Toh H. Recent developments in the MAFFT multiple sequence alignment program. Briefings in Bioinformatics. 2008;9:286–298. doi: 10.1093/bib/bbn013. [DOI] [PubMed] [Google Scholar]
- 71.Waterhouse AM, Procter JB, Martin DMA, Clamp M, Barton GJ. Jalview Version 2--a multiple sequence alignment editor and analysis workbench. Bioinformatics. 2009;25:1189–1191. doi: 10.1093/bioinformatics/btp033. [DOI] [PMC free article] [PubMed] [Google Scholar]
- 72.Cole C, Barber JD, Barton GJ. The Jpred 3 secondary structure prediction server. Nucleic Acids Res. 2008;36:W197–W201. doi: 10.1093/nar/gkn238. [DOI] [PMC free article] [PubMed] [Google Scholar]
- 73.Wootton JC, Federhen S. Analysis of compositionally biased regions in sequence databases. Meth Enzymol. 1996;266:554–571. doi: 10.1016/s0076-6879(96)66035-2. [DOI] [PubMed] [Google Scholar]
- 74.R Core Team. R: A language and environment for statistical computing. R Foundation for Statistical Computing; Vienna, Austria: 2016. [Google Scholar]
- 75.Wickham H. ggplot2. Springer; 2016. [Google Scholar]
- 76.Wickham H. Reshaping data with the reshape package. Journal of Statistical Software. 2007 [Google Scholar]
- 77.Wickham H. Scales: scale functions for visualization. 2016. R package version 0.4.0.
- 78.Bolstad BM. preprocessCore: A collection of pre-processing functions. 2013. R package version.
- 79.Kent WJ, et al. The human genome browser at UCSC. Genome Research. 2002;12:996–1006. doi: 10.1101/gr.229102. [DOI] [PMC free article] [PubMed] [Google Scholar]
- 80.Raney BJ, et al. Track data hubs enable visualization of user-defined genome-wide annotations on the UCSC Genome Browser. Bioinformatics. 2014;30:1003–1005. doi: 10.1093/bioinformatics/btt637. [DOI] [PMC free article] [PubMed] [Google Scholar]
- 81.Vizcaíno JA, et al. 2016 update of the PRIDE database and its related tools. Nucleic Acids Research. 2016;44:D447–56. doi: 10.1093/nar/gkv1145. [DOI] [PMC free article] [PubMed] [Google Scholar]
Associated Data
This section collects any data citations, data availability statements, or supplementary materials included in this article.


