Abstract
Biologists’ preeminent toolbox for separating, analyzing, and visualizing proteins is SDS-PAGE, yet recovering the proteins embedded in these polyacrylamide media as intact species is a long-standing challenge for mass spectrometry. In conventional workflows, protein mixtures from crude biological samples are electrophoretically separated at high-resolution within N,N′-methylene-bis-acrylamide crosslinked polyacrylamide gels to reduce sample complexity and facilitate sensitive characterization. However, low protein recoveries, especially for high molecular weight proteins, often hinder characterization by mass spectrometry. We describe a workflow for top-down/bottom-up mass spectrometric analyses of proteins in polyacrylamide slab gels using dissolvable, bis-acryloylcystamine-crosslinked polyacrylamide, enabling high-resolution protein separations while recovering intact proteins over a broad size range efficiently. The inferior electrophoretic resolution long associated with reducible gels has been overcome, as demonstrated by SDS-PAGE of crude tissue extracts. This workflow elutes intact proteins efficiently, supporting MS and MS/MS from proteins resolved on biologists’ preferred separation platform.
Graphical abstract
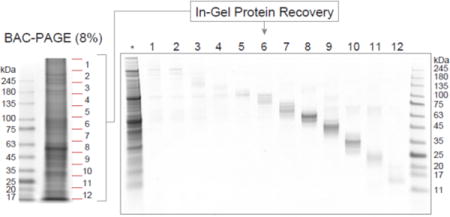
Mass spectrometry (MS) structural analyses of post-translational modifications and sequence variants are typically achieved by peptide-based “bottom-up” approaches, which proteolytically digest proteins prior to MS1,2. Combining bottom-up MS with high-throughput liquid chromatography (LC) enables large-scale protein characterization in proteomics. Alternatively, a “top-down” approach using high-resolution MS coupled with powerful fragmentation technologies is becoming increasingly significant for the comprehensive structural analysis of intact proteins without proteolytic digestion3–5. The advantages of top-down MS to characterize the structures of large proteins and to interrogate post-translational modifications and proteoforms has been demonstrated6–8. Coupling native MS with top-down MS allows the higher order structures of protein complexes to be probed9,10. The development of top-down MS for large-scale protein characterization, i.e., top-down proteomics, has also been explored in recent years11–13, including quantitative comparative analysis that has been typically reserved for bottom-up proteomics14.
The challenges that crude protein extracts present to analyses by top-down/bottom-up MS necessitate sample pretreatment. High-resolution separations by polyacrylamide gel electrophoresis (PAGE) are particularly useful for reducing sample complexity, enabling targeted proteins to be characterized sensitively from crude biological sources. Indeed, SDS-PAGE is biology’s preeminent tool for separating, analyzing, visualizing, (and even archiving!) proteins. When combined with electroblotting (Western blotting), highly sensitive and specific information is acquired from SDS-PAGE analyses. Unfortunately, recovering the proteins embedded in polyacrylamide media as intact species is a long-standing challenge in MS.
In conventional gel-based workflows, protein mixtures are electrophoresed in polyacrylamide gels cast with N,N′-methylene-bis-acrylamide (Bis). Owing to the insolubility of the Bis-crosslinked polyacrylamide matrix, embedded proteins are generally released post-separation by electroelution and finally subjected to MS analysis. However, low protein recovery in electroelution, especially for high molecular weight proteins, often yields poor characterization results.
To address the low recoveries of intact proteins from conventional PAGE gels, a dissolvable polyacrylamide matrix using N,N′-cystamine-bis-acrylamide (BAC), a disulfide-containing analog of Bis (Figure 1a), was developed 40 years ago by Hansen15. BAC-crosslinked polyacrylamide dissolves under reducing conditions, making it possible to release gelembedded components without electroelution16 (Figure 1b). Although its application to biochemical analyses has been reported17–19, its utility in proteomics has been limited by: (1) inferior resolution, challenging separations of complicated samples, (2) time-consuming pH adjustment pre-electrophoresis, and (3) loss of protein conformation by disulfide reduction during gel dissolution. In sample pretreatment for bottom-up proteomics, we previously demonstrated that the complete dissolution of the BAC gel matrix contributes to efficient peptide recovery after in-gel enzymatic digestion20. However, recovering gel-embedded proteins without digestion and its analysis using top-down/bottom-up MS has not yet been realized. We address these challenges by introducing BAC-crosslinked polyacrylamide gel electrophoresis (BAC-PAGE) to intact protein MS.
Figure 1.
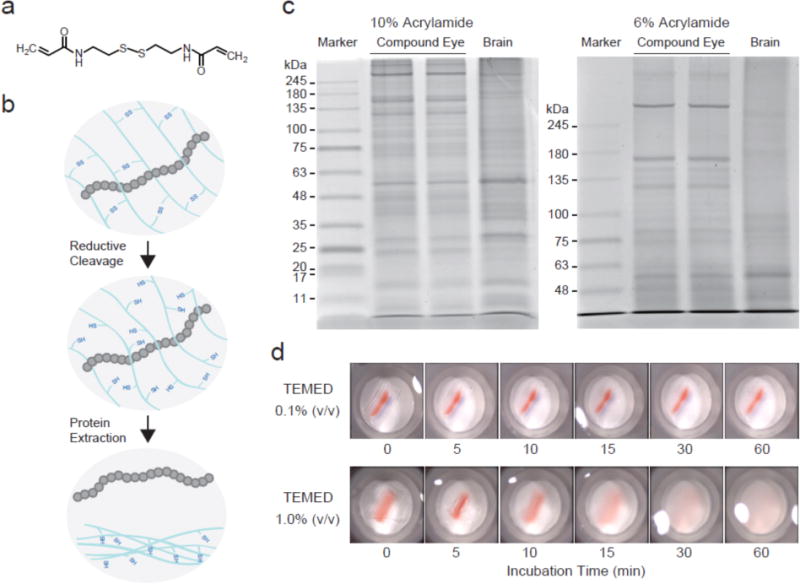
Dissolvable polyacrylamide gels for high-resolution protein electrophoresis. (a) N,N′-cystamine-bis-acrylamide (BAC). (b) Schematic of the protein recovery from a BAC-crosslinked polyacrylamide gel. Reductively cleaving disulfide bonds in BAC is effective for releasing in-gel proteins. (c) Representative images of protein separation using BAC-PAGE. Protein extracts prepared from Drosophila tissues (20 μg total protein/lane) were separated on BAC gels and stained with Coomassie brilliant blue (CBB). (d) Reductive treatment of BAC gel pieces. An excised gel piece (1% TEMED concentration) containing a pre-stained protein band (Red: 75 kDa) was completely solubilized in 50 mM TCEP within 30 minutes.
EXPERIMENTAL SECTION
Materials
Acrylamide, Bis-acrylamide, SDS, tetramethylethylenediamine (TEMED), dithiothreitol and ammonium persulfate were purchased from GE Healthcare (Pittsburgh, PA, USA). BAC was purchased from Polysciences, Inc. (Warrington, PA, USA). Sequencing-grade trypsin was purchased from Promega (Madison, WI, USA). Recombinant human histone samples were purchased from New England Biolabs (Ipswich, MA, USA). Other chemicals unless specified were analytical grade and purchased from Wako (Osaka, Japan).
Sample preparation (Drosophila tissues)
The whole head and compound eyes from wild-type Drosophila melanogaster (Canton-S) were isolated as described previously21. The isolated tissues were homogenized in NuPAGE LDS sample buffer (Life Technologies, Carlsbad, CA, USA) using a Bio-Masher disposable homogenizer (Nippi, Tokyo, Japan). After centrifugation at 18,000 × g for 10 min, the supernatant was used for PAGE analysis. Protein concentrations were determined using a Qubit protein assay kit (Life Technologies) according to the manufacturer’s instructions.
BAC-crosslinked polyacrylamide gel
The components of acrylamide solutions for preparing stacking resolving gels are shown in Table S-1. The acrylamide solution was degassed in a water-bath type sonicator (AS ONE, Tokyo, Japan) and poured into disposable 8 cm × 8 cm, 1.0 or 1.5-mm thick plastic cassettes (TEFCO, Tokyo, Japan). TEMED was added just prior to pouring the gel to aid in polymerization. For typical separations of tissue extracts, a 1-cm long stacking gel and 6-cm long resolving gel were prepared. Cast gels were stored at 4°C until use.
Polyacrylamide gel electrophoresis (PAGE)
PAGE was carried out using a NA1010 mini vertical gel electrophoresis apparatus (Nihon Eido, Tokyo, Japan) and a PowerPac HC power supply (BioRad, Hercules, CA, USA). The buffer chamber was filled with NuPAGE tris-acetate SDS running buffer (Life Technologies) and electrophoresis was performed at a constant voltage of 140 V for 20–30 min. Wide-View pre-stained protein size marker III (Wako) was used to monitor the electrophoretic separation. Visualization of separated proteins was conducted using Bio-Safe CBB (BioRad). All gel images were captured using a GELSCAN transmission scanner (iMeasure Inc., Nagano, Japan).
Protein recovery from BAC gel
After electrophoresis, protein bands of interest were excised with a razor blade and transferred to 2 mL Protein LoBind tubes (Eppendorf, Hamburg, Germany). To reduce sample losses, the following procedure was carried out in the same tube. Excised gel slices were immersed in 400 μL of a gel-dissolving solution containing 0.04 M tris-(2-carboxyethyl) phosphine (TCEP), 1.5 M urea, and 0.003% (w/v) RapiGest surfactant (Waters, Milford, MA, USA) in 1.1 M tris-HCl, pH8.8. The samples were gently vortexed (70 rpm) for 30 min using a reciprocal shaker (Taitech, Saitama, Japan) at 23°C, and then the dissolved gel solutions were mixed with 800 μL of methanol and further vortexed until the acrylamide filaments precipitated. Precipitated filaments were spun down by centrifugation for 1 min at 18,000 × g and the resulting pellet was removed with forceps. Proteins recovered in the supernatant were purified by methanol/chloroform/water (MCW) precipitation, employing Wessel and Flügge’s method22, with minor modifications. Briefly, the supernatant was well-mixed with 200 μL of chloroform and 600 μL of ultrapure water, and centrifuged at 18,000 × g for 3 min to make bilayer. The upper phase was carefully removed and 600 μl of methanol was added to the lower phase, vortexed, and centrifuged again at 18000 × g for 5 min. Supernatant was removed and the protein pellet was washed with methanol. For MS analysis, precipitated proteins were resolubilized with 200 μL of 0.025% (w/v) RapiGest and subjected to additional purification by MCW precipitation to remove remaining contaminants that interfere with MS analysis.
Gel electroelution
Gel electroelution was performed with a GPR 800 protein recovery system (Protea Biosciences, Morgantown, WV, USA) according to the manufacturer’s instructions. Protein recovery from excised gel pieces was performed with 200 μL of electroelution buffer I (Protea Biosciences) for 30 minutes. After electroelution, recovered proteins were purified with MCW precipitation.
Protein digestion
Protein samples, which were solubilized with 20 μL of 0.1% (w/v) RapiGest/50 mM ammonium bicarbonate (pH8.8), were reduced with 1 μL of 0.25 M dithiothreitol for 1.5 h at 37°C, and then alkylated with 1 μL of 1.2 M acrylamide for 30 min at 23°C. Protein digestion with trypsin (0.1 μg) was performed at 37°C for 16 h. After digestion, samples were mixed with equal volume of 1% trifluoroacetic acid (TFA) and incubated at 37°C for 10 min. Centrifugation at 18,000 × g for 3 min was carried out and the supernatant was loaded onto SDB-XC stage-tip columns. The columns were then washed with 40 μl of 0.1% TFA to remove any salts and the trapped peptides were then eluted with 40 μl of 0.1% TFA/80% acetonitrile. Eluates were dried by vacuum centrifugation and resuspended in 10 μL of 0.1% TFA for MS.
LC-MS/MS analysis of trypsin digests
LC-MS/MS analysis was carried out on an Eksigent nanoLC system (SCIEX, Framingham, MA, USA) connected to a Q-Trap 5500 hybrid triple quadrupole/linear ion trap mass spectrometer (SCIEX) that is equipped with a nano-electrospray ionization (ESI) source. For LC separation, mobile phases consisted of 0.1% formic acid in water as solvent A, and 0.1% formic acid/80% acetonitrile as solvent B. Peptide samples were injected onto a 200 μm i.d. × 0.5 mm cHiPLC trap column (SCIEX). Concentrated peptides were then separated on a 75 μm i.d. × 15 cm C18 reversed phase cHiPLC column (SCIEX) at flow rate of 300 nL/min accordance to the following gradient schedule: 0–30 min, 2–30% B; 30–35 min, 30–90% B; held at 90% B for 10 min, and re-equilibrated at 2% B for 15 min. MS data of eluted peptides were acquired by information-dependent acquisition workflow as described previously23. Raw MS files were processed using the Analyst software ver.1.5 (SCIEX). For protein identification, MS/MS spectra were searched against the UniProt Drosophila proteome database (download date: Jun 1, 2013; 41,934 sequences) by the ProteinPilot database ver.4.0 (SCIEX) using the following parameters: cys alkylation, acrylamide; digestion, trypsin; processing parameters, biological modification; and search effort, through ID.
ESI-MS and top-down MS analysis of intact proteins
For positive ion reversed phase LC-MS analysis of BAC gel purified proteins, a system consisting of an Agilent 1200 HPLC connected on-line to an Agilent 6220 ESI-TOF mass spectrometer (Santa Clara, CA, USA) was used. Ten μL of the protein solution was injected onto an Agilent Zorbax C3 column (2.1 mm × 150 mm, 300 Å). Solvent A was 0.1% formic acid in water. Solvent B was 90% acetonitrile containing 0.1% formic acid and water. The flow rate was set to 200 μl/min. The following gradient was used: 5% B for 3 min, 5–25% B in 1 min, held at 25% for 6 min, 25–30% in 5 min, 30–45% in 19 min, 45–80% in 6 min, held at 80% for 5 min, returned to 5% B in 1 min, and equilibrated at 5% B for 9 min prior to next run. Some molecular mass measurements of intact proteins were accomplished using a quadrupole time-of-flight (Q-TOF) instrument (Synapt G2-Si; Waters Corp., Milford, MA, USA). Protein solutions were electrosprayed via nanoESI Au/Pd-coated (1 μm i.d.) borosilicate capillary emitters (Proxeon/Thermo Scientific, Waltham, MA, USA) at a flow rate of approximately 50 nL/min. Top-down MS/MS measurements were performed using a 15-Tesla SolariX Fourier transform ion cyclotron resonance (FTICR) MS with an infinity cell (Bruker Daltonics, Billerica, MA, USA)24,25. Protein solutions were loaded into metal-coated borosilicate capillaries (Proxeon/Thermo Fisher Scientific) for nanoESI. Electron capture dissociation (ECD) experiments were performed with an ECD pulse length of 0.02 s, ECD bias of 1.5 V, and ECD lens of 15 V. The ECD hollow-cathode current was 1.6 A. Data were processed in DataAnalysis (Bruker Daltonics) and interpreted manually.
RESULTS AND DISCUSSION
Development of high-resolution BAC-PAGE system
We synthesized BAC-crosslinked polyacrylamide slab gels (BAC gels) based on the Laemmli SDS-PAGE procedure26, and employed those gels for SDS-PAGE analysis of tissue-extracted proteins. Mini-sized tris-HCl BAC gels were synthesized by copolymerization of BAC and acrylamide using ammonium persulfate and TEMED. BAC-PAGE analysis using trisglycine SDS running buffer demonstrated adequate separation capability for low and medium-sized proteins; however, high-molecular weight proteins were not well resolved (Figure S-1). To improve the resolution for large proteins, we explored trisacetate buffer for BAC-gel preparation (Table S-1). The neutral pH environment provided by tris-acetate gels has been shown to provide better resolution than tris-HCl gels27. As anticipated, high-resolution protein separation over a broad range of molecular weights, especially for >100 kDa, was successfully achieved within 30 minutes (Figure 1c). In addition, tris-acetate BAC performed reproducibly for at least 2 weeks after casting with storage at 4°C. Based on the high-resolution protein separations delivered for a wide range of molecular weights (10–250 kDa), we selected tris-acetate BAC gels for interfacing to mass spectrometry.
In conventional protocols for acrylamide polymerization, the TEMED concentration is generally maintained below 0.1% (v/v) to slow polymerization, aiding formation of a clear, bubble-free gel matrix. However, BAC gels cast with 0.1% (v/v) TEMED remained insoluble under reductive treatment (Figure 1d). Although solubility can be improved by increasing the TEMED concentration17, excessive amounts of TEMED can interfere with electrophoresis. To determine the appropriate conditions for gel dissolution, we synthesized BAC gels using different TEMED concentrations. By increasing the TEMED concentration up to 1.0 %, the synthesized gel could be dissolved with reductive treatment (Figure 1d). To synthesize PAGE-compatible dissolvable gels for this study, we ultimately selected 1.0% TEMED, because concentrations higher than 1.0% led to the bubble problems associated with too-rapid polymerization.
High-throughput sample pretreatment using BAC-PAGE
To dissolve BAC gels after PAGE analysis, we selected TCEP as the primary reducing agent, because rapid and complete dissolution could be achieved with low concentrations20. Complete dissolution of a small gel piece (3–5 mm square and 1 mm thickness) was achieved within 30 minutes incubating in TCEP solution at room temperature; vigorous stirring shortened the dissolution time (Figure 2a). The dissolved polyacrylamide has low viscosity and is suitable for loading onto a subsequent SDS-PAGE dimension (Figure 2b). However, direct application to an LC column or micro-scale solid-phase extraction medium is not practical due to the abundant presence of acrylamide filaments. Therefore it is required to remove acrylamide filaments prior to use for MS-based proteomics. Figure 3a presents the workflow we established to prepare liquefied BAC-PAGE media. We recommend that gel dissociation be performed immediately after electrophoresis, because long-term storage or protein staining affects protein recovery. Excised gel bands were soaked in a solubilizing cocktail containing TCEP, urea, and an MS compatible detergent. Gentle shaking for approximately 30 minutes achieved the highest protein extraction efficiency. Dissolved acrylamide filaments were precipitated by addition of methanol, after which the proteins were precipitated with methanol/chloroform. Prepared protein samples show excellent ionization efficiency through matrix assisted laser desorption ionization (MALDI) MS analysis; no ions representing acrylamide polymers were observed (Figure S-2).
Figure 2.

Quick dissolution of BAC-crosslinked acrylamide gels. (a) Small gel pieces containing CBB-stained standard proteins (bovine serum albumin (BSA) and HIST1H3A) were dissolved in 90 μL of 50 mM TCEP for 10 min with a vigorous shake. (b) The dissolved gels were mixed with 30 μL of 4×NuPAGE LDS sample loading buffer and subjected to separation on 4–12% NuPAGE.
Figure 3.
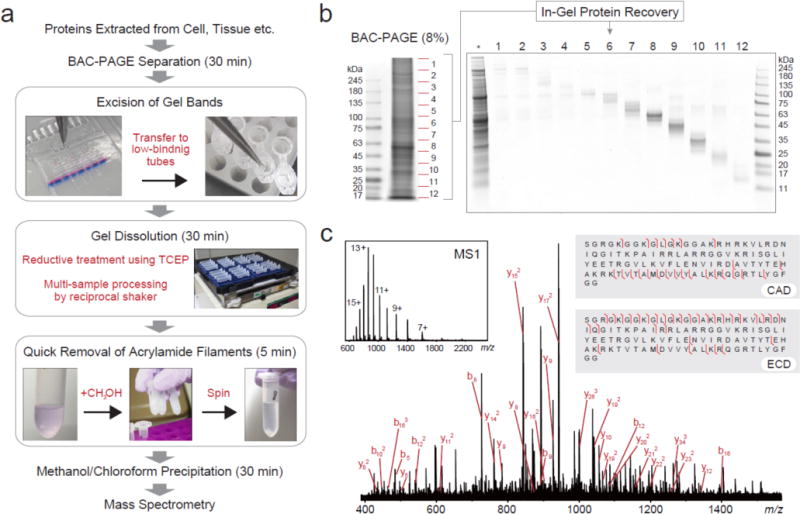
Top-down/bottom-up MS workflow using BAC-PAGE. (a) Analytical scheme for sample pretreatment using BAC-PAGE. (b) Evaluation of the recovery performance. A crude protein extract from Drosophila brain (10 μg total protein) was prepared by the procedure described in Figure 3a. Following methanol/chloroform precipitation, BAC gel-recovered proteins were revealed by Coomassie staining a 4–12% NuPAGE gel. *: whole tissue extract (5 μg total protein/lane). BAC: BAC-crosslinked 8% (w/v) acrylamide gel. (c) Top-down MS of intact HIST1H4A derived from BAC gel. Fragmentation of the (M + 13H)13+ molecule of human HIST1H4A was achieved by collision activated dissociation (CAD) and electron capture dissociation (ECD) in ESI FT-ICR mass spectrometer. Major CAD fragment ions are labeled and shown on the inset figure.
Subjecting protein bands recovered from BAC gel dissolution to classic SDS-PAGE revealed good recoveries across all molecular weight ranges (Figure 3b). Protein recovery by gel dissolution was consistently effective, especially with high-molecular weight proteins (>100 kDa) for which recoveries using conventional electroelution are normally poor (Figure S3). In top-down proteomics, gel-eluted liquid fractionation entrapment electrophoresis (GELFrEE) has been used to separate proteins28. GELFrEE, a continuous electrophoresis approach, delivers proteins in liquid fractions, rather than embedded in gel matrix, considered advantageous for recovering proteins reproducibly. A previous study recovering standard proteins from GELFrEE fractions achieved 50–70% efficiency29. In comparison, our quantitative evaluation of bovine serum albumin (BSA) recovery from BAC gels (Figure S-4) estimated a recovery rate of 59.7% with CVs of 10.3% (n=5 technical replicates), equivalent in recovery to GELFrEE fractionation. On the other hand, it is generally difficult for GELFrEE system to recovery the target protein with minimal contamination by other proteins from crude samples; BAC-PAGE with post-electrophoretic protein visualization is superior in such selective recovery.
Application for top-down protein sequencing using ESI-MS
The utility of the established workflow for top-down MS was demonstrated with BSA and human histone H4: HIST1H4A. First, intact HIST1H4A recovered from a BAC gel was subjected to MS analysis using ESI-qTOF MS coupled to nanoflow LC. For reference, we analyzed the original histone sample without electrophoresis. The LC-MS profiles, retention times and observed mass spectra were comparable (Figure S-5). Gel-recovered HIST1H4A was further subjected to top-down sequencing using high resolution ESI FT-ICR MS. The molecular mass was measured to be 11230.41 (monoisotopic), which is in close agreement to the theoretical value (11230.35). The isotopically-resolved MS/MS product ions were successfully assigned to the amino acid sequence (Figure 3c). Using both collisionally activated dissociation (CAD) and ECD, 46 cleavages out of 102 possible inter-residue linkages were measured. These results establish that BAC-PAGE pre-treatment has no influence on the HIST1H4A primary structure. On the other hand, the native structure of cysteine-rich BSA is affected by the reductive dissolution, as revealed by differences in the ESI charge state distributions between native and gel-recovered BSA (Figure 4). Moreover, BSA recovered from the BAC gel showed structural heterogeneity due to partial addition of monomer acrylamide onto cysteine thiols, increasing spectral complexity. Acrylamide adducts are also common in proteins separated by reducing SDS-PAGE. Therefore, stoichiometric cysteine alkylation prior to BAC-PAGE would be required to eliminate this heterogeneity (Figure S-6).
Figure 4.
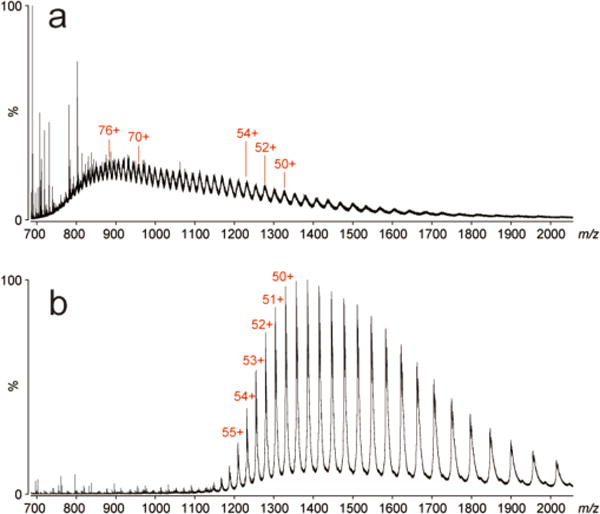
ESI-qTOF MS analysis of BSA from (a) BAC gel and (b) directly without BAC gel separation.
Application for bottom-up analysis using LC-MS/MS
Our recovery protocol established for top-down analysis (Figure 3a) also applies to LC-MS/MS bottom-up analyses. The protocol can mainly be characterized as performing the post-separation protease digestion in solution. Compared to an in-solution digestion performed without prior gel electrophoresis, our number of identified proteins was improved due to the reduced sample complexity that the gel separation provided (Figure 5). Contamination of human keratins, which is inherent to gel-based analysis, was also detected in BAC-PAGE analysis. On the other hand, the number of identified proteins was somewhat inferior when compared to the analysis using a regular in-gel digestion protocol. This result suggests that protein recoveries following gel separation are higher when pep-tide fragments are eluted rather than intact proteins. If necessary, more protein identifications can be obtained by increasing the sample amount used for BAC-PAGE. On the other hand, recovering gel-embedded proteins without digestion creates new opportunities in gel-based bottom-up proteomics. For example, the methods can facilitate treatments with large enzymes and/or oligomeric complexes that would have difficulty permeating the gel matrix.
Figure 5.
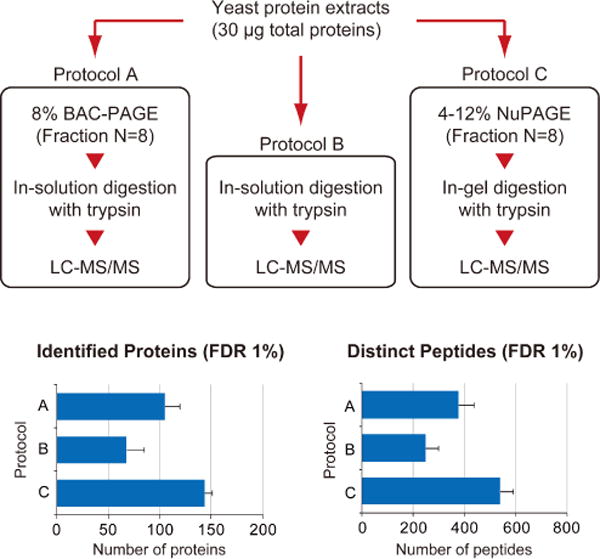
Comparative evaluation of different sample treatments for bottom-up proteomics. After tryptic digestion of a yeast protein extract (Promega) using different three methods independently, the digested peptides were subjected to LC-MS/MS analysis. For protein identification, MS/MS spectra were searched against the UniProt yeast proteome database by ProteinPilot using the following parameters: cys alkylation, iodoacetamide; digestion, trypsin; processing parameters, biological modification; and search effort, through ID. The values represent the averages from three independent experiments ± S.D.
CONCLUSIONS
Intact protein separations using BAC-PAGE require neither special equipment nor tedious operation, making this technology one of the most effective top-down MS methodologies currently available, and one readily accessible to biologists. The inferior PAGE resolution long limiting applications of BAC gels has finally been circumvented by substituting trisacetate for the formerly employed tris-glycine buffer. High-throughput protein separation using mini-sized BAC gels reduces the complexity of biological samples, increasing the number of MS detectable proteins. Although reductive treatment erases cysteine disulfide linkage information, combining BAC-PAGE with high-resolution FT-ICR MS offers the valuable opportunity to perform top-down MS from small-format gel-separated proteins. Although direct MS sequencing of intact proteins larger than 100 kDa challenges current MS capabilities, a practical solution is to perform “middle-down” MS targeting large protein fragments30,31. Cleveland mapping32 by combining BAC-PAGE and top-down MS is another interesting attempt to rapidly characterize the difference between samples and to determine their detailed sequences. Especially the high-resolution slab gel established in this study can be a useful tool for displaying the digested fragments. In addition, complete dissolution of the BAC gel matrix contributes to effective recovery of long peptides20, which often generated by limited proteolysis in Cleveland mapping.
Large-scale top-down proteomics using currently available MS instruments has generally required large sample amounts; a notable limitation of our proposed workflow to top-down proteomics may be the small loading capacity of mini-sized BAC gels. Despite our success observing proteins from crude biological samples (Figure 6), MS/MS characterization was greatly limited in this trial due to insufficient sample amounts. To fulfill sample requirements, further improvements include scaling up the gel size, immunoaffinity concentrating targeted proteins, and achieving higher MS sensitivity. In addition, it is often difficult by one dimensional PAGE to achieve sufficient protein fractionation from crude biological samples, which may cause ion suppression of measured proteins. Adding an orthogonal separation technique, such as isoelectric focusing, will be an effective strategy for detecting weakly-observable targets. However, as sensitivity of MS instruments for top-down MS improve in the future, sample size requirements will be reduced, and the direct application of BAC gels for large-scale top-down proteomics may be realized.
Figure 6.
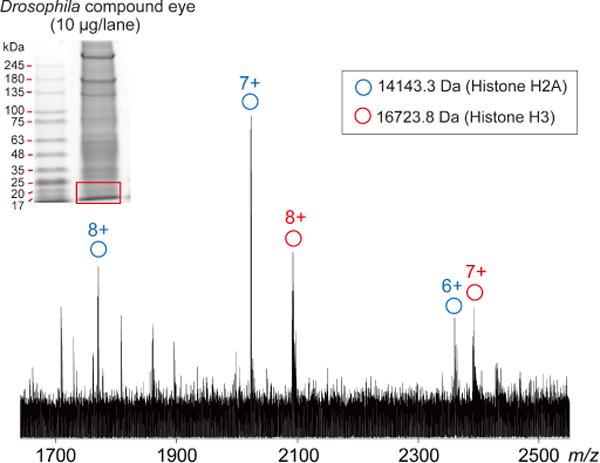
ESI-FT-ICR mass spectrum from gel-separated Drosophila eye proteins.
Supplementary Material
Figure S-1. Tris-glycine SDS-PAGE using a BAC-crosslinked polyacrylamide slab gel (PDF)
Figure S-2. MALDI-TOF MS analysis of standard proteins derived from BAC gels (PDF)
Figure S-3. Comparison of the performance of BAC-PAGE and gel electroelution for in-gel protein recovery (PDF)
Figure S-4. Evaluation of reproducibility of BSA recovery from BAC gel (PDF)
Figure S-5. LC-ESI-TOF MS analysis of HIST1H4A (PDF)
Figure S-6. Evaluation of cysteine alkylation by MS (PDF)
Table S-1. Composition of the gel solutions for BAC-PAGE (XLSX)
Acknowledgments
This study was supported in part by grants from Ehime University (NT), from JSPS KAKENHI Grant Number 16K08937 (NT), from the US National Institutes of Health (R01GM103479, R01GM104610, S10RR028893, S10OD018504) (JAL) and a fellowship from the Flemish Research Foundation (FL). We also thank Dr. Masayoshi Watada (Ehime University) for kindly providing Drosophila stocks.
Footnotes
Supporting Information
The Supporting Information is available free of charge on the ACS Publications website.
ORCID
Nobuaki Takemori: 0000-0001-6639-854X
Joseph A. Loo: 0000-0001-9989-1437
Author Contributions
N.T., A.T., R.R.O.L., and J.A.L. designed the study. N.T. and A.T. performed BAC-PAGE analysis. P.W., M.M., R.R.O.L., F.L., and J.A.L. performed top-down MS analysis. N.T., A.T., R.R.O.L. and J.A.L. wrote the manuscript. All authors reviewed the manuscript.
Notes
The authors declare no competing financial interests.
References
- 1.Duncan MW, Aebersold R, Caprioli RM. Nat Biotechnol. 2010;28:659–664. doi: 10.1038/nbt0710-659. [DOI] [PubMed] [Google Scholar]
- 2.Aebersold R, Mann M. Nature. 2003;422:198–207. doi: 10.1038/nature01511. [DOI] [PubMed] [Google Scholar]
- 3.Loo JA, Edmonds CG, Smith RD. Science. 1990;248:201–204. doi: 10.1126/science.2326633. [DOI] [PubMed] [Google Scholar]
- 4.Loo JA. Mass Spectrom Rev. 1997;16:1–23. doi: 10.1002/(SICI)1098-2787(1997)16:1<1::AID-MAS1>3.0.CO;2-L. [DOI] [PubMed] [Google Scholar]
- 5.Xie Y, Zhang J, Yin S, Loo JA. J Am Chem Soc. 2006;128:14432–14433. doi: 10.1021/ja063197p. [DOI] [PubMed] [Google Scholar]
- 6.Zhang Y, Wecksler AT, Molina P, Deperalta G, Gross ML. J Am Soc Mass Spectrom. 2017;28:850–858. doi: 10.1007/s13361-017-1601-7. [DOI] [PMC free article] [PubMed] [Google Scholar]
- 7.Zhou M, Paša-Tolić L, Stenoien DL. J Proteome Res. 2017;16:599–608. doi: 10.1021/acs.jproteome.6b00694. [DOI] [PubMed] [Google Scholar]
- 8.Yu D, Peng Y, Ayaz-Guner S, Gregorich ZR, Ge Y. J Am Soc Mass Spectrom. 2016;27:220–232. doi: 10.1007/s13361-015-1286-8. [DOI] [PMC free article] [PubMed] [Google Scholar]
- 9.Zhang J, Reza Malmirchegini G, Clubb RT, Loo JA. Eur J Mass Spectrom. 2015;21:221–231. doi: 10.1255/ejms.1340. [DOI] [PMC free article] [PubMed] [Google Scholar]
- 10.Li H, Sheng Y, McGee W, Cammarata M, Holden D, Loo JA. Anal Chem. 2017;89:2731–2738. doi: 10.1021/acs.analchem.6b02377. [DOI] [PMC free article] [PubMed] [Google Scholar]
- 11.Meng F, Du Y, Miller LM, Patrie SM, Robinson DE, Kelleher NL. Anal Chem. 2004;76:2852–2858. doi: 10.1021/ac0354903. [DOI] [PubMed] [Google Scholar]
- 12.Bogdanov B, Smith RD. Mass Spectrom Rev. 2005;24:168–200. doi: 10.1002/mas.20015. [DOI] [PubMed] [Google Scholar]
- 13.Tran JC, Zamdborg L, Ahlf DR, Lee JE, Catherman AD, Durbin KR, Tipton JD, Vellaichamy A, Kellie JF, Li M, Wu C, Sweet SM, Early BP, Siuti N, LeDuc RD, Compton PD, Thomas PM, Kelleher NL. Nature. 2011;480:254–258. doi: 10.1038/nature10575. [DOI] [PMC free article] [PubMed] [Google Scholar]
- 14.Zheng Y, Fornelli L, Compton PD, Sharma S, Canterbury J, Mullen C, Zabrouskov V, Fellers RT, Thomas PM, Licht JD, Senko MW, Kelleher NLs. Mol Cell Proteomics. 2016;15:776–790. doi: 10.1074/mcp.M115.053819. [DOI] [PMC free article] [PubMed] [Google Scholar]
- 15.Hansen JN. Anal Biochem. 1976;76:37–44. doi: 10.1016/0003-2697(76)90261-x. [DOI] [PubMed] [Google Scholar]
- 16.Hansen JN, Pheiffer BH, Boehnert JA. Anal Biochem. 1980;105:192–201. doi: 10.1016/0003-2697(80)90445-5. [DOI] [PubMed] [Google Scholar]
- 17.Ghaffari SH, Dumbar TS, Wallace MO, Olson MO. Anal Biochem. 1988;171:352–359. doi: 10.1016/0003-2697(88)90497-6. [DOI] [PubMed] [Google Scholar]
- 18.Faulkner RD, Carraway R, Bhatnagar YM. Biochim Biophys Acta. 1982;708:245–252. doi: 10.1016/0167-4838(82)90433-2. [DOI] [PubMed] [Google Scholar]
- 19.Daròs JA, Flores R. EMBO J. 2002;21:749–759. doi: 10.1093/emboj/21.4.749. [DOI] [PMC free article] [PubMed] [Google Scholar]
- 20.Takemori N, Takemori A, Ishizaki J, Hasegawa H. J Chromatogr B Analyt Technol Biomed Life Sci. 2014;967:36–40. doi: 10.1016/j.jchromb.2014.07.006. [DOI] [PubMed] [Google Scholar]
- 21.Takemori N, Komori N, Thompson JN, Yamamoto MT, Matsumoto H. Proteomics. 2007;7:2651–2658. doi: 10.1002/pmic.200700343. [DOI] [PubMed] [Google Scholar]
- 22.Wessel D, Flügge UI. Anal Biochem. 1984;138:141–143. doi: 10.1016/0003-2697(84)90782-6. [DOI] [PubMed] [Google Scholar]
- 23.Takemori N, Takemori A, Tanaka Y, Ishizaki J, Hasegawa H, Shiraishi A, Ohashi Y. Mol Biosyst. 2016;12:2389–2393. doi: 10.1039/c6mb00209a. [DOI] [PubMed] [Google Scholar]
- 24.Li H, Wolff JJ, Van Orden SL, Loo JA. Anal Chem. 2014;86:317–320. doi: 10.1021/ac4033214. [DOI] [PMC free article] [PubMed] [Google Scholar]
- 25.Li H, Wongkongkathep P, Van Orden SL, Ogorzalek Loo RR, Loo JA. J Am Soc Mass Spectrom. 2014;25:2060–2068. doi: 10.1007/s13361-014-0928-6. [DOI] [PMC free article] [PubMed] [Google Scholar]
- 26.Laemmli UK. Nature. 1970;227:680–685. doi: 10.1038/227680a0. [DOI] [PubMed] [Google Scholar]
- 27.Cubillos-Rojas M, Amair-Pinedo F, Tato I, Bartrons R, Ventura F, Rosa JL. Methods Mol Biol. 2012;869:205–213. doi: 10.1007/978-1-61779-821-4_17. [DOI] [PubMed] [Google Scholar]
- 28.Tran JC, Doucette AA. Anal Chem. 2008;80:1568–1573. doi: 10.1021/ac702197w. [DOI] [PubMed] [Google Scholar]
- 29.Tran JC, Doucette AA. Anal Chem. 2009;81:6201–6209. doi: 10.1021/ac900729r. [DOI] [PubMed] [Google Scholar]
- 30.Taouatas N, Drugan MM, Heck AJ, Mohammed S. Nat Methods. 2008;5:405–407. doi: 10.1038/nmeth.1204. [DOI] [PubMed] [Google Scholar]
- 31.Wu C, Tran JC, Zamdborg L, Durbin KR, Li M, Ahlf DR, Early BP, Thomas PM, Sweedler JV, Kelleher NL. Nat Methods. 2012;9:822–824. doi: 10.1038/nmeth.2074. [DOI] [PMC free article] [PubMed] [Google Scholar]
- 32.Cleveland DW, Fischer SG, Kirschner MW, Laemmli UK. J Biol Chem. 1977;252:1102–1106. [PubMed] [Google Scholar]
Associated Data
This section collects any data citations, data availability statements, or supplementary materials included in this article.
Supplementary Materials
Figure S-1. Tris-glycine SDS-PAGE using a BAC-crosslinked polyacrylamide slab gel (PDF)
Figure S-2. MALDI-TOF MS analysis of standard proteins derived from BAC gels (PDF)
Figure S-3. Comparison of the performance of BAC-PAGE and gel electroelution for in-gel protein recovery (PDF)
Figure S-4. Evaluation of reproducibility of BSA recovery from BAC gel (PDF)
Figure S-5. LC-ESI-TOF MS analysis of HIST1H4A (PDF)
Figure S-6. Evaluation of cysteine alkylation by MS (PDF)
Table S-1. Composition of the gel solutions for BAC-PAGE (XLSX)


