

Abstract
Brain-computer interfaces (BCIs) aim to restore independence to people with severe motor disabilities by allowing control of a cursor on a computer screen or other effectors with neural activity. However, physiological and/or recording-related nonstationarities in neural signals can limit long-term decoding stability, and it would be tedious for users to pause use of the BCI whenever neural control degrades to perform decoder recalibration routines. We recently demonstrated that a kinematic decoder (i.e. a decoder that controls cursor movement) can be recalibrated using data acquired during practical point-and-click control of the BCI by retrospectively inferring users’ intended movement directions based on their subsequent selections. Here, we extend these methods to allow the click decoder to also be recalibrated using data acquired during practical BCI use. We retrospectively labeled neural data patterns as corresponding to “click” during all time bins in which the click log-likelihood (decoded using linear discriminant analysis, or LDA) had been above the click threshold that was used during real-time neural control. We labeled as “non-click” those periods that the kinematic decoder’s retrospective target inference (RTI) heuristics determined to be consistent with intended cursor movement. Once these neural activity patterns were labeled, the click decoder was calibrated using standard supervised classifier training methods. Combined with real-time bias correction and baseline firing rate tracking, this set of “retrospectively labeled” decoder calibration methods enabled a BrainGate participant with amyotrophic lateral sclerosis (T9) to type freely across 11 research sessions spanning 29 days, maintaining high-performance neural control over cursor movement and click without needing to interrupt virtual keyboard use for explicit calibration tasks. By eliminating the need for tedious calibration tasks with prescribed targets and pre-specified click times, this approach advances the potential clinical utility of intracortical BCIs for individuals with severe motor disability.
Keywords: Brain-Machine Interface (BMI), Amyotrophic lateral sclerosis (ALS), Spinal cord injury (SCI), Stroke, augmentative and assistive communication (AAC), adaptive classification
Introduction
Brain-computer interfaces (BCIs) aim to restore independence for people with severe motor disabilities, including people whose disability prevents control of traditional assistive devices, by decoding movement intention directly from neural activity. Intracortical brain-computer interfaces have recorded clinically useful signals in humans over years. Their use has been demonstrated in controlling computer cursors1–4, communication interfaces5,6, multi-dimensional reach-and-grasp movements7–11, and most recently, surface functional electrical stimulation of the person’s own arm muscles12.
However, because of physiological and/or recording-related nonstationarities in neural signals6,13–19, these proof-of-concept demonstrations have largely been limited to periods of tens of minutes to hours at a time. High-quality neural control can be restored using decoder calibration routines in which the user is asked to move the cursor to prescribed targets so that neural activity patterns can be re-mapped to movement intention20, but it would be time-consuming and impractical to require users to pause practical use of the BCI to perform decoder recalibration routines whenever neural control degrades6.
We recently demonstrated computational methods that can keep a decoder calibrated for longer periods, despite underlying signal nonstationarities, by using data acquired during practical point-and-click control of the BCI. Retrospective target inference (RTI)-based decoder calibration updates the mapping from neural activity to intended movement by retrospectively inferring, after each selection the user makes on the screen, that his or her intended cursor movement during the preceding trajectory was directly toward that selected target. By combining this method with adaptive tracking of the statistics of the neural features used for decoding and adaptive correction for biases in the decoded output, we have shown that people with tetraplegia are able to type freely using a neurally controlled virtual keyboard for long periods of time (~hours, and for one participant, across multiple days) with no degradation in typing rate despite neural signal nonstationarities6.
The click decoder, however, did not have an analogous method for self-calibration and it faced similar nonstationarity challenges. The robustness of the radial keyboard21 to accommodate imperfect click decoding helped the previous study’s participant maintain high typing rates despite the decline of click decoding quality in the final sessions of her multi-day self-calibration series6 (Fig. 1). With a more general user interface, an unreliable click signal could make the BCI frustrating to use, as accidental selections would need to be corrected and intended selections might not be registered. Furthermore, unreliable click decoding would also present a problem for RTI calibration of the kinematic decoder, because the heuristics underlying data selection for RTI calibration rely upon intentional on-screen selections6.
Figure 1. False click rate affects typing throughput, from a prior study and participant.
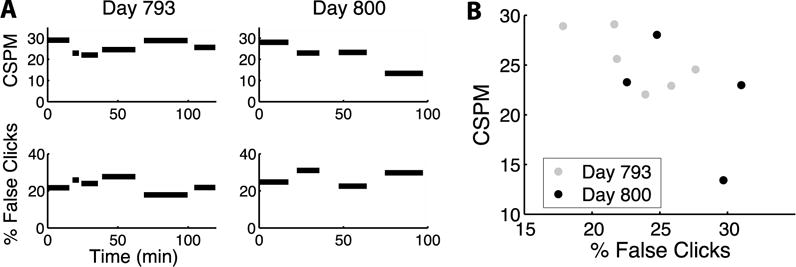
A. Top panels: typing rates in last 2 sessions of T6’s multi-day series, labeled with her trial day, as also shown in the last 2 panels of Fig. 6 in Jarosiewicz et al. (2015)6. The length of each bar corresponds to the duration of each typing block. CSPM = correct selections per minute, measured as the number of selections per minute minus the number of backspaces pressed6. Bottom panels: the approximate false (unintended) click rate during these same typing periods, defined as the percentage of all clicks that occurred in zones of the radial keyboard where clicks had no effect. For context, across all blocks in the sessions leading up to these two sessions, the mean (± SEM) of the CSPM was 21.05 ± 1.01, and the average false click rate was 12.56 ± 0.84. B. The relationship between false click rate and typing rate for each block of self-paced typing in these last 2 sessions. The decrease in typing rate was correlated with an increase in false click rate (r = −0.66, p < 0.05), suggesting that the decay in click decoding quality was a contributing factor in the decline of point-and-click typing performance.
In previous studies, unsupervised classifier adaptation has been shown to improve the performance of discrete classifiers22–24 by tracking the drifting statistics of the neural signals corresponding to each class and/or by updating the selection of neural features to use for subsequent decoding. Using error-related neuronal signals as a semi-supervisory signal for adaptive classification23,25 has been shown in simulation and in offline studies to improve classification further, even when those error signals are not perfectly reliable.23 Here, we demonstrate that data acquired during practical use of a point-and-click BCI can be used to create “retrospectively supervised” (RS) classifier training labels for adaptive click decoder calibration without the need for a separately decoded error signal. Analogously to RTI kinematic decoder calibration, we retrospectively inferred which periods of neural activity were most likely to have reflected an intention to click based on the decoded click signal itself, and used that inference to provide training labels for classifier recalibration. A preliminary version of this study was previously presented in abstract form26.
Combined with our previously published methods for self-calibration of the kinematic decoder6, RS click decoder calibration helped a BrainGate participant with ALS (T9) to maintain high-quality point-and-click neural control across 11 free-typing sessions spanning 29 days despite neural signal nonstationarities, without needing to interrupt use of the virtual keyboard with explicit calibration tasks. By eliminating the need for daily calibration tasks with prescribed targets, this set of “retrospectively labeled” self-calibration approaches brings BCIs a step closer to restoring independence to individuals with severe motor disability.
Methods
Participant
The participant in this study (T9) is a right-handed man, 52 years old at the start of the study, with ALS with a functional scale rating (ALSFRS-R) of 8. He retains speech, breathes with the assistance of a mechanical ventilator, and has very limited limb and hand movement. He was enrolled in a pilot clinical trial of the BrainGate2 Neural Interface System (www.clinicaltrials.gov/ct2/show/NCT00912041; “CAUTION: Investigational device. Limited by federal law to investigational use”) and implanted with two 1.5 mm 96-channel intracortical silicon microelectrode arrays (Blackrock Microsystems) in the dominant hand/arm knob area of motor cortex27 approximately 4 months before the start of this research, as described previously28.
Signal acquisition
Neural activity was detected by the two 96-channel silicon microelectrode arrays, and transmitted via a cable attached to a percutaneous connector during each 2-3 hour recording session. Signals were analog filtered (4th order Butterworth with corners at 0.3 Hz and 7.5 kHz) and digitized at 30 kHz by a 96-channel NeuroPort Neural Signal Processor (Blackrock Microsystems). These signals were fed to custom software written in Simulink (Mathworks) for pre-processing and decoding.
For pre-processing, signals were downsampled to 15 kHz and then common-average referenced29. Namely, the mean signal across the 60 channels with the lowest noise distribution on each array, identified from a single 30-sec “reference” recording at the start of the first session, was computed and subtracted in real time from all channels’ signals on that array. In 20 ms segments, signals were buffered for 4 ms to avoid edge effects, and then non-causally band-pass filtered for action potentials (spikes) using a 4th order Butterworth filter with corners at 250 and 5000 Hz30. The extracted signals were compared to an amplitude threshold set at -3.5 times the standard deviation of the filtered signals on each channel13,30–32. The rate of these threshold-crossing events and the total signal power in the spike band were computed for each channel and used as separate candidate features for decoding (see decoder calibration sections below for details). For ease of interpretation, we will refer to the combined set of neural features as multi-unit neural activity.
Research session design
In the first session of the multi-day series (Fig. 2A), a standard set of closed-loop directional and click decoders were first calibrated using prescribed targets: mean-subtracted neural activity was mapped to movement intentions that were inferred to be directly toward the next highlighted target in an open-loop and then closed-loop center-out-back task20. In closed-loop neural control, intended movements were decoded from the incoming neural activity and translated in real time into the movement of the cursor using a steady-state Kalman filter3,33,34. A linear discriminant analysis (LDA) classifier running in parallel with the Kalman filter was used to decode intended clicks2,4.
Figure 2. Research session setup.
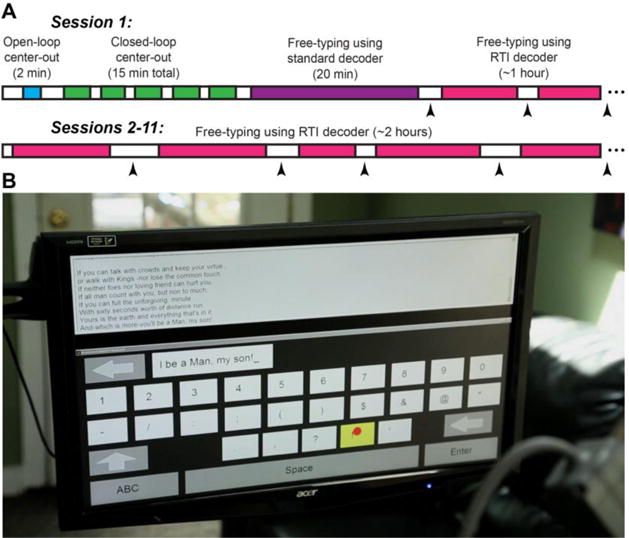
A. Timeline of research sessions. On day 1, decoders were initialized using a standard calibration task with prescribed targets, and then the participant used this standard set of decoders to begin free-typing. After 20 minutes of free-typing, the first set of retrospectively supervised (RS) decoders were calibrated. Thenceforth, RS decoders were recalibrated at each break using the last 20 – 60 minutes of typing data. Black arrowheads denote RS recalibrations. B. Photo of T9’s screen during the 2nd free-typing session in the series (his trial day 134). T9 chose to finish typing out the lines of a favorite poem (“If—” by Rudyard Kipling39) that he had started typing on the previous day.
After the decoders were calibrated using these standard calibration tasks, the task was switched to a neurally controlled point-and-click QWERTY communication interface21 (Fig. 2B). The participant was asked to type whatever he wished for the next 30 minutes, at whatever pace he was comfortable with (including taking the time to consider his wording whenever needed, etc.), and to let us know if he wished to take an extended break before the 30 minutes elapsed. After the first typing block (which lasted the full 30 minutes), a set of “retrospectively labeled” (RL) decoders (i.e. both an RS click decoder and an RTI kinematic decoder) were calibrated on the neural data acquired during typing6. Then the participant was asked to continue typing when he was ready, now using these RL decoders for neural control. The RL decoders were updated after every block of free typing using a sliding window spanning the most recent 20-60 minutes of typing. Each session after the first was initialized with the previous session’s last RL decoders, thereby bypassing standard decoder calibration on all sessions after the first.
Adaptive feature mean tracking and bias correction
As previously described6, the effects of nonstationarities in feature baseline rates and standard deviations were mitigated by recursively updating the estimate of each channel’s mean rate and standard deviation during the rest periods between blocks of neural control,35 using an exponentially decaying sliding average with a 240 sec time constant. During typing periods, these estimated baseline rates and standard deviations were used to z-score the neural features prior to kinematic decoding. To mitigate the effects of nonstationarities in feature statistics on cursor movement during typing blocks, any residual velocity bias was iteratively estimated and subtracted out by computing an exponentially weighted running mean of all decoded velocities whose speeds exceeded a predefined threshold, set to the 66th percentile of the decoded speeds estimated during the most recent filter calibration, as previously described6. To mitigate the effects of nonstationarities on click decoding during free-typing, feature statistics continued to be updated using the same recursive method35 prior to being sent to the click decoder during free-typing periods.
Standard Kalman filter calibration
To initialize the kinematic decoder in the first of the eleven sessions, the participant was asked to imagine moving a mouse on a tabletop plane with his right hand to move the cursor to targets presented one at a time in an 8-target radial center-out task. First, a 2-minute open-loop block was used to initialize the Kalman filter, and then five 3-minute closed-loop blocks with decreasing levels of error attenuation (0.8, 0.6, 0.4, 0.2, and 0) were used to refine it, as described in6,20. As in these previous studies, this “standard” Kalman filter was updated after each center-out block under the assumption that the person was attempting to move the cursor directly toward each target, and only the first 3 sec of each trajectory (after a 0.3 sec delay) were used for calibration in an effort to reduce contamination of the neural signals by error correction. These intended direction vectors (all unit length) were regressed against the corresponding baseline-subtracted neural activity to obtain the tuning model and noise covariance matrix. Only the 80 features with the highest modulation depth36 were used in the decoder. Features were chosen from all spike power features and the subset of threshold crossing features whose mean rates fell between 1 and 1,000 Hz, and which were not previously found to have excessive noise (as judged by root-mean-square signal amplitude).
RTI Kalman filter calibration
The methods for RTI calibration of the Kalman filter are described in detail in6. In brief, the participant’s intended movement direction during typing was retrospectively inferred to have been directly toward the next self-selected target, during time periods heuristically inferred to correspond to movement intention: 1) only the last 5 seconds preceding each target selection were used for calibration; 2) only those time bins in which the cursor moved closer to the next selected target were used for calibration; and 3) times during which the cursor was within a small distance (~1 cm) or temporal window (500 ms) of the target were not used for calibration (the neural activity was likely influenced by the person’s upcoming attempt to generate a click). Similar to closed-loop calibration with prescribed targets, these intended direction vectors were regressed against the corresponding baseline-subtracted neural activity to obtain the tuning model and noise covariance matrix20. Neural features were selected anew at every RTI calibration: as with standard Kalman filter calibration, out of the features whose rate and noise characteristics met the above criteria, only the 80 channels with the highest modulation depth36 were used in the decoder.
Standard click decoder calibration
To initialize the click decoder in the first session, the participant was asked to imagine clicking by pressing a mouse button with his right index finger when cued to do so during the same center-out blocks as Kalman filter calibration6. Clicks were cued after each return to the center target by changing the color of the center target for 1 second while the cursor remained centered on it. In the final center-out block, the participant was asked to neurally click on every target (including the center and all peripheral targets) using this initial decoder. To label this click-acquire block’s neural data for purposes of updating the LDA classifier, the participant was assumed to have been attempting to click whenever the cursor was on the active target, and was assumed not to be attempting to click during cursor movement periods. To account for the limitations of this assumption (sometimes there was a temporal misalignment between the cursor being on target and T9’s attempted clicks, as evident from the LDA log-likelihood trace), we relabeled the data from these center-out blocks prior to decoder calibration using a k-means clustering approach with cluster means seeded from the original class labels. Both the clustering and decoding were performed on the projection of the data in principal component space.
The click decoder was calibrated on all of the data acquired during the standard calibration tasks using LDA37 to separate the mean-subtracted multi-unit activity observed during intended click periods from those observed during intended cursor movements in the calibration data. The top 80 features (or principal components, in the case of the standard click decoders), ranked by sensitivity index (d’), were included in the click decoder. Neural features were chosen from all spike power features and the subset of threshold crossing features whose mean firing rates fell between 1 and 500 Hz and that were not previously found to have excessive noise. The click log-likelihood threshold was set to a value that had been found in previous sessions to reliably separate click from non-click, and remained at that setting for all sessions. In the blocks in which neural clicks were decoded (in the last center-out block and all typing blocks), multi-unit activity was averaged over the previous 400 ms, which was empirically found (over the course of multiple previous sessions with T9) to provide a good tradeoff between responsiveness of click on the one hand, and a clean separation between click and non-click on the other. A click was generated in a given 20 ms bin if the click log-likelihood computed from that multi-unit activity exceeded the click threshold (but was below threshold in the previous 20 ms bin).
Retrospectively Supervised (RS) click decoder calibration
For click decoder calibration using data acquired during practical BCI use, we retrospectively labeled neural data patterns as corresponding to “click” during all time bins in which the decoded click log-likelihood had been above the click threshold that was used during real-time neural control (this was our best estimate of the neural activity most likely to have corresponded to intended click). The periods that our kinematic decoder’s RTI heuristics determined to be intended cursor movement periods (as described in reference6) were retrospectively labeled as “non-click.” Figure 3 shows an example of how these RS heuristics are applied using kinematic and click data acquired during free-typing.
Figure 3. Retrospectively supervised (RS) decoder calibration method, shown for a representative one-minute sample of data collected during T9’s virtual point-and-click typing (trial day 134).
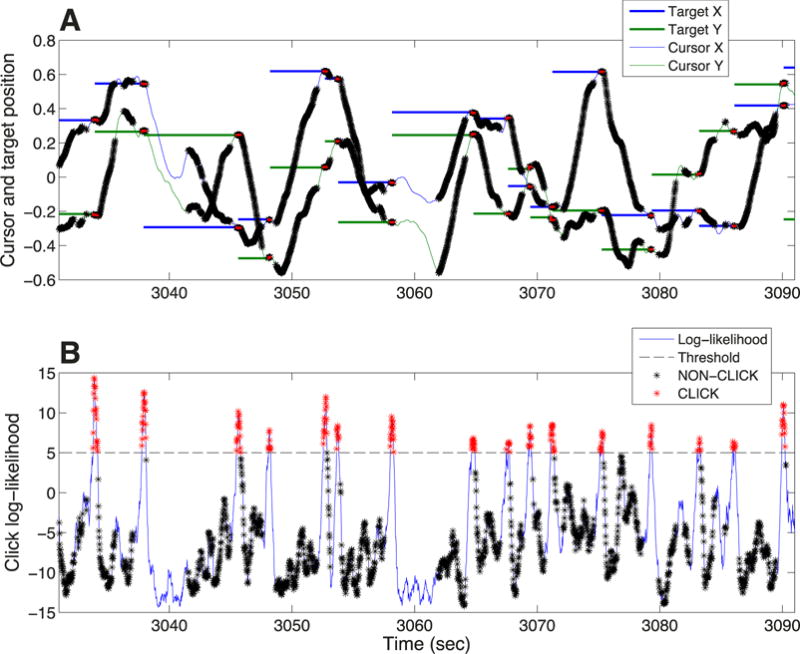
A. RTI decoder calibration using data acquired during free-typing. Thin blue and green lines represent the cursor x and y-position over time, respectively (in screen units, where edges are represented as [-1 1]). Thick blue and green lines represent the x and y-positions of the retrospectively inferred targets6. Black and red asterisks in both Panel A and B represent time periods labeled as intended movement and intended click, respectively, for purposes of both RTI and RS decoder calibration. B. RS click decoder calibration using data acquired during free-typing. Thin blue line is the click log-likelihood, decoded using the LDA classifier. Black dashed line represents the click threshold. Intended movement periods were identified using the heuristics described in reference6 and summarized in Methods. Intended click periods were simply identified as periods during which the click log-likelihood was above click threshold, using the decoder that had been used in real time during that part of the collected data.
Once the neural data were labeled using this set of RS heuristics, both RL decoders were calibrated using the same methods as described above. As with RTI calibration, feature selection was recomputed anew at every RS decoder calibration: among those features whose rates and noise characteristics fell within the above criteria, the 80 spike power features with the highest d’ in the new set of RS calibration data were selected for click decoding.
Neural signal nonstationarities
Feature statistics and LDA coefficients over time
To illustrate the nonstationarity of the neural signals across this series of sessions, we extracted for each block in each session the feature means and standard deviations that were used for z-scoring at the start of each block (Fig. 4A, left 2 panels). These feature statistics had been computed in real time during the rest period preceding that block, using a recursively-defined exponential estimate with a 240 sec time constant6. The LDA decoder coefficients (Fig. 4A, right panel) were obtained from the decoders that had been used in the same blocks and sessions. Although 80 channels were used for decoding in each block, for simplicity, these plots only show the channels that were common across all decoders from all blocks and all sessions (thus, the true degree of nonstationarity was even greater than is visible from these figures). The feature statistics and LDA coefficients from the first typing block of the first session used principle components rather than raw neural features for decoding; thus, the first block’s data is also not shown here.
Figure 4. Neural signal nonstationarities.
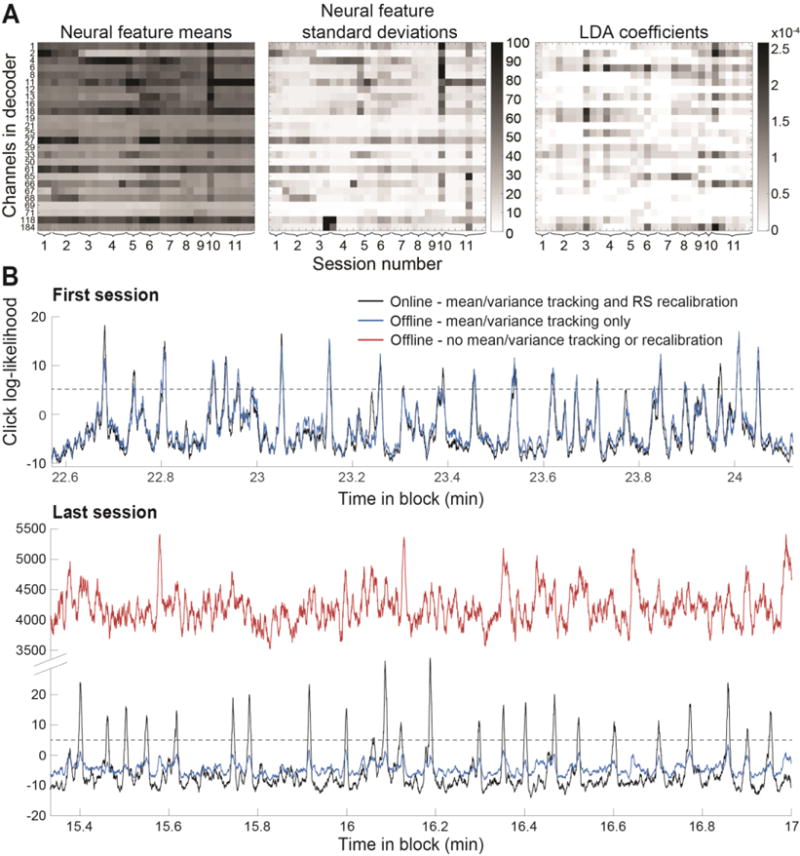
A. Means (left panel) and standard deviations (middle panel) of the neural features (spike power) for the channels that were selected for use in the click decoder across all typing blocks and sessions. Means and standard deviations are capped at 100 for visualization; mean rates actually peaked at 113.57 and standard deviations at 2006.02 (in spike power/sec). LDA click decoder coefficients (right panel) for the same blocks and sessions. (The 1st typing block of the 1st session used principal components of spike power as features for click decoding rather than spike power itself, so that block is skipped in these plots.) B. Top panel (“First session”): Real-time and offline reconstruction of the click log-likelihood signal using the click decoder from last block of the 1st session on the neural data from a small snippet of that same block (black trace = true log-likelihood obtained online; blue trace = offline reconstructed log-likelihood using the same decoder and neural data. Slight differences in these 2 traces are due to slight differences in real-time vs. offline z-scoring). Bottom panel (“Last session”): offline reconstruction of the click log-likelihood signal that would have been obtained during a sample period of the last session if the click decoder from the end of the 1st session had been used with neither feature statistics tracking nor RS calibration (red trace), or with feature statistics tracking but no RS recalibration (blue trace). Black trace shows the true click log-likelihood that had been obtained online for this sample period from the last session, using the fully self-calibrated click decoder with both statistics tracking and RS recalibration enabled.
Offline reconstruction of the click log-likelihood signal using the original decoder
Using the click decoder from last block of the 1st session, we reconstructed offline the log-likelihood signal from 100 sec of that same block, and of a 100 sec snippet from the 3rd block of the last session, with and without an updated estimate of the means and standard deviations for z-scoring prior to offline decoding (Fig. 4B). As previously described, means and standard deviations had been updated in real time using an exponentially decaying sliding average with a time constant of 240 sec6,35; here, we show what the log-likelihood trace would have looked like without mean tracking or RS recalibration, and what it would have looked like using the means and variances from the start of the block but without RS recalibration.
Typing rate assessment metrics and statistics
Selections per minute
Typing rate was quantified using the number of selections per minute (SPM), regardless of the number of characters that resulted from those selections or of the number of backspaces. We assumed that each selection was intentional, unless informed otherwise by the participant. Note that, in previous studies, including the T6 multi-day self-calibration study6 whose results are reproduced and expanded upon in Fig. 1, we used backspaces to inform us of accidental selections, and thus subtracted the number of backspaces from the total number of characters typed (yielding “correct selections per minute,” or CSPM). However, this backspace heuristic did not apply well to the current study’s participant, T9, as Participant T9 frequently backspaced through long phrases to make changes or correct misspellings that he later identified in earlier parts of his text (even though each selection was deliberate when originally typed and during the backspacing). Thus, in the present study, we considered both his previously typed text and his backspaces to be intentional, and report total SPM instead. To assess the quality of click decoding, we also report his false click rate and lag to click after each target entry, as defined below.
False click rate
In addition to reporting typing rate under the assumption that each selection was intentional, we also report a “false click rate” for each block, defined as the percentage of clicks in that block that occurred in inactive locations on the keyboard (including spaces between the available buttons, along the outside edges of the keyboard, inside the typed-text window, etc.). This metric provides a lower estimate of the true false click rate, as traditionally defined (the rate of unintentional clicks), because some unintentional clicks might also have occurred on active buttons and thus been counted as intentional selections. However, the false click rate as defined here is some static percentage of the true false click rate (because the relative amount of space on the keyboard that is inactive remains constant over time); thus, it is a useful relative measure that can be used to assess changes in click quality over time.
Lag to click
As an additional relative measure of click quality, we also report for each click in all blocks and all sessions the amount of time that the cursor had been on the target that was eventually clicked before the click was decoded.
Correlation coefficients and p-values
Pearson’s sample correlation coefficient r was used to test for significant changes in the above metrics over time across all sessions, and to measure the relationships among them (see Fig. 5). For measures reported per block (selections per minute, false click rate), the timestamps used to test for a significant linear relationship with time was the onset of the block (relative to the start of the first typing block of the first session). For the measurement reported per click (lag to click), timestamps were the actual time of each individual click (relative to the start of the first typing block of the first session). P-values for all Pearson correlation coefficients (r) were obtained by comparing the measured r to a null distribution obtained by shuffling the true pairings pseudorandomly 1,000,000 times.
Figure 5. Typing rates and false click rates in T9’s multi-day self-calibration sessions.
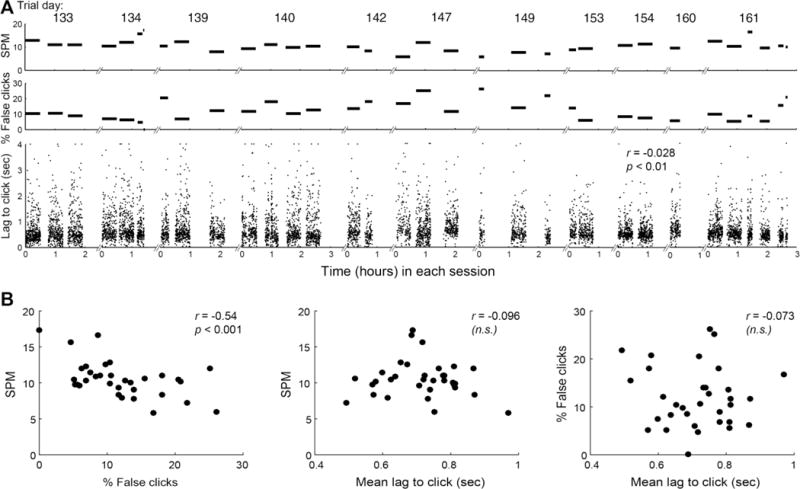
A. Typing rates (top panel) and false click rates (middle panel) are shown for each block from all 11 multi-day self-calibration sessions, spanning approximately one month (breaks along the x-axis denote breaks between different sessions, each labeled above with T9’s trial day). There was no significant decline in typing rate or significant increase in false click rate over time across the series of sessions. The bottom panel shows, for each click in all blocks and all sessions, the delay between the cursor entering the target that was eventually clicked and the click being decoded. Lags to click are capped at 4 sec for visualization only (statistics were performed on the true lag values. The actual range of lags extended to 5.98 sec; throughout the session series, 28 click lags were above this 4 sec cap). There was a significant decrease over time across all blocks and sessions in the lag to click (p = 0.0063). B. (Left) the relationship between false click rate and typing rate for each block of self-paced typing across all sessions (each data point is one block). As for T6, the higher the false click rate, the lower the typing rate (p = 0.00045), providing further evidence that click decoding quality is an important factor in typing performance and validating the use of SPM as a good metric for relative typing performance. (Middle) the relationship between mean lag to click in each block and the typing rate for that block. There is no significant linear relationship between mean lag to click and SPM (p = 0.296). (Right) There is also no significant linear relationship between mean lag to click and false click rate (p = 0.34).
Results
To test whether this suite of self-calibration methods (mean tracking, bias correction, and RTI decoder calibration6, along with the new RS click decoder calibration) allowed for stable neural control across multiple days of practical BCI use, we conducted a multi-day study in which Participant T9 free-typed across a series of sessions using a virtual QWERTY keyboard adapted from5. The first typing block of the first session was the only one that used a standard decoder calibrated with presented targets; after that, the decoders were calibrated exclusively using the previous 20-60 min of typing data. T9 was able to type whatever he wished across 11 sessions spanning about 1 month, without the need for any instructed-target calibration tasks after the decoders were initialized on the first day.
Consistent with previous reports,6,17 the recorded neural signals in this study were nonstationary, both within and across sessions (Fig. 4A). Based on offline analysis, these nonstationarities would have degraded the quality of click decoding by the last session if a static decoder had been used to decode the same neural signals that were actually obtained (Fig 4B). Without updating neural feature statistics for z-scoring, by the last session, the click log-likelihood ratio would have climbed ~90 orders of magnitude higher than the click threshold, which would likely have resulted in constant false clicking. Consistent with previous reports,22,23 updating the estimates of feature statistics helped keep the decoded log-likelihoods in the expected range, but the distinction between decoded click and non-click was larger using the fully statistics-tracked and RS-recalibrated decoder that was actually used online.
Despite these neural signal nonstationarities, RS calibration succeeded in maintaining decoding quality without the need for explicit calibration tasks after day 1. There was no significant decline in typing rate (r = −0.15; n = 33; p = 0.20) or increase in false click rate (r = 0.08; n = 33; p = 0.33) across time in this series of sessions (Fig. 5A, top 2 panels). Furthermore, across all blocks from all sessions, higher false click rates corresponded to lower typing rates (Fig. 5B, left panel; r = −0.54, n = 33; p < 0.001), validating SPM as a useful relative measure of typing rate and further supporting the assertion that click decoding quality is an important factor in point-and-click BCI performance.
To assess whether the responsiveness of click decoding changed over time, we measured for all clicks across all sessions how long it took the click to be decoded after the cursor entered the target that was eventually clicked (“lag to click”; Fig. 5A, bottom panel). There is a significant linear decrease in lag to click across the whole session series (r = −0.028; n = 7827; p < 0.01). One possible explanation is that click decoding becomes more responsive because it improves over time with RS recalibration (i.e. the non-click state and the click state become more distinct, resulting in a decrease in both false positives and false negatives). However, this interpretation is inconsistent with the finding that the false click rate does not decrease over the same period. Another possibility is that click decoding simply becomes more sensitive across time; i.e. the click signal moves closer to the click threshold so that both intentional and unintentional clicks are more easily generated. However, this interpretation is not consistent with the finding that false click rate does not increase over time. The fact that lag to click and false click rate are not significantly correlated (Fig. 5B, rightmost panel; r = -0.073; n = 33; p = 0.34) further helps to rule out both of these possible interpretations. Thus, the decrease across sessions in the lag between target entry and click is likely attributable to the participant learning, with practice, to initiate his click neural activity earlier, perhaps predictively as he’s approaching each desired target.
With the caveat that T9’s use of backspaces is not necessarily indicative of an accidental selection having been made (as described in Methods), we also assessed whether the percentage of backspace events (defined as a series of consecutive backspaces) changed over the course of these sessions. We found that there was a non-significant trend toward fewer backspace events over time (r = −0.271067; n = 33; p = 0.060; data not shown), which is also consistent with click decoding quality remaining high across the series of sessions.
Though we did not collect any formal metrics of user satisfaction, we welcomed any subjective impressions that the participant spontaneously shared about his neural control quality. Some notable excerpts of his verbal feedback included the following: (1st session, 1st typing block; slang replaced by asterisks): “We’re kicking **** and taking names!”; (2nd session, 1st typing block, having skipped the standard center-out calibration task that he was used to doing at the beginning of each session): “Amazing. Absolutely amazing! No radial 8!”; (11th session, 3rd typing block): “Wow, this filter is really good!”
Discussion
This study replicates and extends a previous study in which we demonstrated methods to keep the kinematic (velocity) decoder calibrated using data acquired during practical point-and-click control of the BCI.6 Here, we have extended these methods for self-calibration to the click decoder, and have shown that these methods enabled a participant with tetraplegia to type freely using a neurally controlled virtual keyboard for hours a day, across 11 sessions spanning 29 days, with no degradation in typing rate despite neural signal nonstationarities. Though we did not perform a series of sessions with T9 in which RS click recalibration was turned off, our offline analysis reconstructing the state log-likelihood that would have been obtained using the first session’s decoder on the last session’s neural data suggests that feature tracking and RS recalibration were important for maintaining high click decoding quality.
In the previous multi-day self-calibration study with T6,6 the virtual typing was done in a radial keyboard,5 which by design is robust to high false click rates (if kinematic decoding quality remains high) because the inactive zone in the center of the keyboard allows any accidental clicks that occur en route to the desired target to be ignored. In the current study, a QWERTY keyboard was used, which is more sensitive to degradation in click decoding quality because false clicks that occur en route to the desired target are more likely to cause accidental selections that need to be corrected. This was a deliberate choice, as we aimed to model a more general point-and-click use case in which false selections are likely to require subsequent correction. Despite this increased sensitivity to false clicks and a similar degree of signal nonstationarity as in the previous study6, the typing rate and click decoding quality in the present study was maintained across 11 self-paced typing sessions. Furthermore, the false click rate (measured by proxy as the % of clicks that occurred in inactive zones of the QWERTY keyboard) did not increase significantly across time in this study, reinforcing the value of RS click calibration in maintaining the quality and robustness of neural control during practical BCI use.
In this study, high false click rates might be expected to artificially inflate the typing performance metric used in this study, selections per minute (SPM), because SPM only considers the total rate of (active) clicks without taking into account whether those clicks were intentional or unintentional. However, higher false click rates were correlated with a lower SPM in this study. Thus, false clicks did not appear to artificially elevate SPM, validating SPM as a useful relative measure of free-typing performance.
We should note that the participant was not asked to type as quickly as possible, and sometimes took time during the typing blocks to consider what he wanted to write next, which decreased the apparent typing rate during the block and added some variability that might not have been present had the participant been asked to type as quickly as possible and/or was given prescribed text to copy. Thus, the typing rates presented here should not be interpreted to reflect optimized performance, but instead to provide relative typing performance metrics that allow the effect of relative click decoding quality to be assessed across blocks and sessions.
It is perhaps not immediately evident how using data for click decoder calibration could improve the click decoder when that data had already been decoded as click. One important factor is that the best features for click decoding were recomputed anew at every RS calibration, using more recent data. A second important factor is that, even when the same features are selected during a new RS calibration, their activity patterns in relation to desired click vs. non-click can change gradually over time (as shown by the means, standard deviations, and LDA coefficients changing over time in Fig. 4A). Each recalibration can thus improve subsequent click decoding by updating the features’ means, standard deviations, and classifier coefficients (reflecting their relative tuning along the click — non-click axis). A third factor is that the neural data labeled with “click” for RS decoder updates was not precisely aligned in time with the data that caused a click to be decoded during closed-loop neural control: each click was registered in real-time control as soon as the click log-likelihood crossed threshold. However, the log-likelihood often remained above threshold for some time after each click occurred (i.e. until the participant registered that the click had occurred and stopped modulating his neural activity accordingly), and all of this above-threshold neural activity was labeled as “click” for RS calibration. Even though this retrospectively supervisory signal may not be 100% reliable, it has been shown in previous studies that even a semisupervisory error signal that is only 80% reliable helps to improve subsequent decoding quality when used to select data for classifier recalibration23. Thus, the combination of these factors all likely contribute to the utility of RS decoder calibration, even though the data for calibration were taken from data previously used to decode click during real-time neural control.
In this study, the click decoder was a simple two-state LDA classifier2,4. However, these methods can be applied to any click decoding algorithm that turns a continuous signal (such as click log-likelihood, velocity or position in the click dimension of a continuous filter, etc.) into a binary signal (click vs. non-click). We also expect this method to extend naturally to multi-state and multi-stage decoders; for example, decoders that first detect whether the user actively intends to be using the BCI or resting38, and only allowing decoding of click during active BCI use. The click and kinematic decoder self-calibration methods can then automatically be applied only to periods of active BCI use. Given that these self-calibration methods are not tied to any specific kinematic decoder or classifier, they can continue to be applied as decoding algorithms continue to evolve.
By eliminating the need for daily calibration tasks with prescribed targets despite neural signal nonstationarities, this set of approaches brings BCIs a step closer to restoring independence to individuals with severe motor disability.
Acknowledgments
The authors would like to thank Participant T9 and his family, and John Simeral, Damien Lesenfants, Tommy Hosman, Marco Vilela, John Donoghue, Chethan Pandarinath, Paul Nuyujukian, Nicolas Masse, Stephen Mernoff, Brian Edlow, Dave Rosler, Beth Travers, Carol Grant, and Laurie Barefoot for their contributions to this research.
Funding was provided by the Office of Research and Development, Rehabilitation R&D Service, Department of Veterans Affairs (N9288C, B6453R, A6779I, P1155R); NIH: NIDCD (R01DC009899); MGH-Deane Institute for Integrated Research on Atrial Fibrillation and Stroke; and the Executive Committee on Research (ECOR) of Massachusetts General Hospital. The content is solely the responsibility of the authors and does not necessarily represent the official views of the National Institutes of Health, or the Department of Veterans Affairs or the United States Government. CAUTION: Investigational Device. Limited by Federal Law to Investigational Use.
Abbreviations
- ALS
Amyotrophic lateral sclerosis
- BCI
Brain-computer interface
- LDA
Linear Discriminant Analysis
- RL
Retrospectively Labeled
- RTI
Retrospective Target Inference
- RS
Retrospectively Supervised
- CSPM
Correct selections per minute
- SPM
Selections per minute
Footnotes
Author Contributions
BJ conceived the study, designed and implemented the RTI and RS calibration methods, performed the data analyses, and drafted the manuscript, which was further edited by all authors. AAS and JS contributed to the BrainGate hardware and software infrastructure, participated in discussions about RS implementation, and participated in session software validation and support. BF participated in software validation, coordinated research session time, and collected the data with Participant T9. S.S.C. is a clinical co-investigator of the pilot clinical trial and assisted in the clinical oversight of the participant. ENE planned and executed the neurosurgical placement of the electrode arrays. LRH helped to conceive and plan, and continues to direct, the ongoing BrainGate research, and is principal investigator of the BrainGate2 pilot clinical trial.
References
- 1.Kim S-PP, et al. Multi-state decoding of point-and-click control signals from motor cortical activity in a human with tetraplegia. Neural Engineering, 2007 CNE ’07 3rd International IEEE/EMBS Conference on. 2007:486–489. doi: 10.1109/CNE.2007.369715. [DOI] [Google Scholar]
- 2.Kim SP, et al. Point-and-click cursor control with an intracortical neural interface system by humans with tetraplegia. IEEE Trans Neural Syst Rehabil Eng. 2011;19:193–203. doi: 10.1109/TNSRE.2011.2107750. [DOI] [PMC free article] [PubMed] [Google Scholar]
- 3.Kim SPP, Simeral JD, Hochberg LR, Donoghue JP, Black MJ. Neural control of computer cursor velocity by decoding motor cortical spiking activity in humans with tetraplegia. J Neural Eng. 2008;5:455–476. doi: 10.1088/1741-2560/5/4/010. [DOI] [PMC free article] [PubMed] [Google Scholar]
- 4.Simeral JD, Kim SP, Black MJ, Donoghue JP, Hochberg LR. Neural control of cursor trajectory and click by a human with tetraplegia 1000 days after implant of an intracortical microelectrode array. J Neural Eng. 2011;8:25027. doi: 10.1088/1741-2560/8/2/025027. [DOI] [PMC free article] [PubMed] [Google Scholar]
- 5.Bacher D, et al. Neural Point-and-Click Communication by a Person With Incomplete Locked-In Syndrome. Neurorehabil Neural Repair. 2015;29:462–471. doi: 10.1177/1545968314554624. [DOI] [PMC free article] [PubMed] [Google Scholar]
- 6.Jarosiewicz B, et al. Virtual typing by people with tetraplegia using a self-calibrating intracortical brain-computer interface. Sci Transl Med. 2015;11:313RA179. doi: 10.1126/scitranslmed.aac7328. [DOI] [PMC free article] [PubMed] [Google Scholar]
- 7.Hochberg LR, et al. Reach and grasp by people with tetraplegia using a neurally controlled robotic arm. Nature. 2012;485:372–375. doi: 10.1038/nature11076. [DOI] [PMC free article] [PubMed] [Google Scholar]
- 8.Tyler-Kabara EC, et al. 10 Degree-Of-Freedom Neuroprosthetic Control By An Individual With Tetraplegia. JOURNAL OF NEUROSURGERY. 2013;119:A553–A553. [Google Scholar]
- 9.Wodlinger B, et al. Ten-dimensional anthropomorphic arm control in a human brain—machine interface: difficulties, solutions, and limitations. J Neural Eng. 2015;12:16011. doi: 10.1088/1741-2560/12/1/016011. [DOI] [PubMed] [Google Scholar]
- 10.Aflalo T, et al. Decoding motor imagery from the posterior parietal cortex of a tetraplegic human. Science (80-) 2015;348:906–910. doi: 10.1126/science.aaa5417. [DOI] [PMC free article] [PubMed] [Google Scholar]
- 11.Collinger JL, et al. High-performance neuroprosthetic control by an individual with tetraplegia. Lancet. 2013;381:557–64. doi: 10.1016/S0140-6736(12)61816-9. [DOI] [PMC free article] [PubMed] [Google Scholar]
- 12.Bouton CE, et al. Restoring cortical control of functional movement in a human with quadriplegia. Nature. 2016;533:247–250. doi: 10.1038/nature17435. [DOI] [PubMed] [Google Scholar]
- 13.Chestek CA, et al. Long-term stability of neural prosthetic control signals from silicon cortical arrays in rhesus macaque motor cortex. J Neural Eng. 2011;8:45005. doi: 10.1088/1741-2560/8/4/045005. [DOI] [PMC free article] [PubMed] [Google Scholar]
- 14.Santhanam G, et al. HermesB: a continuous neural recording system for freely behaving primates. IEEE Trans Biomed Eng. 2007;54:2037–50. doi: 10.1109/TBME.2007.895753. [DOI] [PubMed] [Google Scholar]
- 15.Wessberg J, Nicolelis MAL. Optimizing a linear algorithm for real-time robotic control using chronic cortical ensemble recordings in monkeys. J Cogn Neurosci. 2006;16:1022–35. doi: 10.1162/0898929041502652. [DOI] [PubMed] [Google Scholar]
- 16.Kim S, Wood F, Fellows M, Donoghue JP, Black M. J Statistical analysis of the non-stationarity of neural population codes. First IEEE/RAS-EMBS Int Conf Biomed Robot Biomechatronics. 2006:811–816. doi: 10.1109/BIOROB.2006.1639190. [DOI] [Google Scholar]
- 17.Perge JA, et al. Intra-day signal instabilities affect decoding performance in an intracortical neural interface system. J Neural Eng. 2013;10:36004. doi: 10.1088/1741-2560/10/3/036004. [DOI] [PMC free article] [PubMed] [Google Scholar]
- 18.Nuyujukian P, et al. Performance sustaining intracortical neural prostheses. J Neural Eng. 2014;11:66003. doi: 10.1088/1741-2560/11/6/066003. [DOI] [PubMed] [Google Scholar]
- 19.Santhanam G, et al. Factor-analysis methods for higher-performance neural prostheses. J Neurophysiol. 2009;102:1315–30. doi: 10.1152/jn.00097.2009. [DOI] [PMC free article] [PubMed] [Google Scholar]
- 20.Jarosiewicz B, et al. Advantages of closed-loop calibration in intracortical brain — computer interfaces for people with tetraplegia. J Neural Eng. 2013;10:46012. doi: 10.1088/1741-2560/10/4/046012. [DOI] [PMC free article] [PubMed] [Google Scholar]
- 21.Bacher D, et al. Neural Point-and-Click Communication by a Person With Incomplete Locked-In Syndrome. Neurorehabil Neural Repair. 2014 doi: 10.1177/1545968314554624. [DOI] [PMC free article] [PubMed] [Google Scholar]
- 22.Shenoy P, Krauledat M, Blankertz B, Rao RPN, Müller KR. Towards adaptive classification for BCI. J Neural Eng. 2006;3:R13–23. doi: 10.1088/1741-2560/3/1/R02. [DOI] [PubMed] [Google Scholar]
- 23.Blumberg J, et al. Adaptive classification for brain computer interfaces. Conf Proc IEEE Eng Med Biol Soc. 2007;2007:2536–9. doi: 10.1109/IEMBS.2007.4352845. [DOI] [PubMed] [Google Scholar]
- 24.Bishop W, et al. Self-recalibrating classifiers for intracortical brain—computer interfaces. J Neural Eng. 2014;11:26001. doi: 10.1088/1741-2560/11/2/026001. [DOI] [PMC free article] [PubMed] [Google Scholar]
- 25.Chavarriaga R, Sobolewski A, Millán JDR. Errare machinale est: the use of error-related potentials in brain-machine interfaces. Front Neurosci. 2014;8:208. doi: 10.3389/fnins.2014.00208. [DOI] [PMC free article] [PubMed] [Google Scholar]
- 26.Jarosiewicz B, Sarma AA, Saab J, Franco B, Hochberg LR. Retrospectively supervised point-and-click decoder calibration during practical use of an intracortical brain-computer interface. Society for Neuroscience. 2016;439.12 doi: 10.1016/j.jphysparis.2017.03.001. [DOI] [PMC free article] [PubMed] [Google Scholar]
- 27.Yousry T. Localization of the motor hand area to a knob on the precentral gyrus: A new landmark. Brain. 1997;120:141–157. doi: 10.1093/brain/120.1.141. [DOI] [PubMed] [Google Scholar]
- 28.Hochberg LR, et al. Neuronal ensemble control of prosthetic devices by a human with tetraplegia. Nature. 2006;442:164–171. doi: 10.1038/nature04970. [DOI] [PubMed] [Google Scholar]
- 29.Ludwig KA, et al. Using a common average reference to improve cortical neuron recordings from microelectrode arrays. J Neurophysiol. 2009;101:1679–89. doi: 10.1152/jn.90989.2008. [DOI] [PMC free article] [PubMed] [Google Scholar]
- 30.Masse NY, et al. Non-causal spike filtering improves decoding of movement intention for intracortical BCIs. J Neurosci Methods. 2014 doi: 10.1016/j.jneumeth.2014.08.004. [DOI] [PMC free article] [PubMed] [Google Scholar]
- 31.Fraser GW, Chase SM, Whitford A, Schwartz AB. Control of a brain-computer interface without spike sorting. J Neural Eng. 2009;6:55004. doi: 10.1088/1741-2560/6/5/055004. [DOI] [PubMed] [Google Scholar]
- 32.Christie BP, et al. Comparison of spike sorting and thresholding of voltage waveforms for intracortical brain—machine interface performance. J Neural Eng. 2015;12:16009. doi: 10.1088/1741-2560/12/1/016009. [DOI] [PMC free article] [PubMed] [Google Scholar]
- 33.Wu W, Gao Y, Bienenstock E, Donoghue JP, Black MJ. Bayesian population decoding of motor cortical activity using a Kalman filter. Neural Comput. 2006;18:80–118. doi: 10.1162/089976606774841585. [DOI] [PubMed] [Google Scholar]
- 34.Malik WQ, Truccolo W, Brown EN, Hochberg LR. Efficient decoding with steady-state Kalman filter in neural interface systems. IEEE Trans Neural Syst Rehabil Eng. 2011;19:25–34. doi: 10.1109/TNSRE.2010.2092443. [DOI] [PMC free article] [PubMed] [Google Scholar]
- 35.Bruce M. Estimation of variance by a recursive equation. National Aeronautics and Space Administration: 1969. [Google Scholar]
- 36.Malik WQ, Hochberg LR, Donoghue JP, Brown EN. Modulation depth estimation and variable selection in state-space models for neural interfaces. IEEE Trans Biomed Eng. 2015;62:570–81. doi: 10.1109/TBME.2014.2360393. [DOI] [PMC free article] [PubMed] [Google Scholar]
- 37.Izenman AJ. Modern Multivariate Statistical Techniques. Springer; New York: 2008. [DOI] [Google Scholar]
- 38.Lesenfants D, et al. Idle state detection from motor cortical activity in a person with tetraplegia using an intracortical brain-computer interface. Society for Neuroscience. 2016;439.07 [Google Scholar]
- 39.Kipling R. In: A choice of Kipling’s verse. Eliot TS, editor. Charles Scribner’s Sons; 1943. [Google Scholar]