

Abstract
Proportions of omega-3 (n-3) and omega-6 (n-6) in 20- and 22-carbon highly unsaturated fatty acids with 3 or more double bonds (HUFA) accumulated in tissue HUFA (e.g., the %n-6 in HUFA) are biomarkers reflecting intakes of n-6 and n-3 fatty acids. An empirical equation, referred to here as the Lands’ Equation, was developed previously to use dietary intakes of n-6 and n-3 HUFA and their 18-carbon precursors to estimate the %n-6 in HUFA of humans. From the PubMed database, we identified clinical trials reporting (a) dietary intake of at least linoleic acid (18:2n-6) and alpha-linolenic acid (18:3n-3), and (b) the amounts of at least arachidonic acid (20:4n-6), eicosapentaenoic acid (20:5n-3), and docosahexaenoic acid (22:6n-3) in lipids of plasma, serum, or red blood cell. Linear regression analyses comparing reported and predicted %n-6 in HUFA gave a correlation coefficient of 0.73 (p < 0.000000) for 34 studies with 92 subject groups. These results indicate that circulating HUFA compositions can be reliably estimated from dietary intake data that not only includes n-3 and n-6 HUFA consumption, but also includes consumption of 18 carbon n-3 and n-6 precursor fatty acids.
Keywords: blood lipids, highly unsaturated fatty acids (HUFA), HUFA balance, omega-3, omega-6
1. INTRODUCTION
Omega-6 (n-6) and omega-3 (n-3) polyunsaturated fatty acids (PUFA) are essential vitamin-like components of the human diet. They have important roles in both the prevention and the development of various diseases [1]. A potential biomarker for both monitoring dietary intake of PUFA and assessing disease risk is the percentage of n-6 highly unsaturated fatty acids (HUFA; 20- and 22-carbon fatty acids with 3 or more double bonds) in total tissue HUFA (i.e., the %n-6 in HUFA), defined as follows:
| (Equation 1) |
where the fatty acids are expressed as concentrations or percentages of total fatty acids in any tissue or blood fraction.
Tissue HUFA are precursors of signalling molecules called eicosanoids that regulate many physiological processes [2]. The wide impact of these signalling molecules is evident from the occurrence of receptors responding differently to n-6 and n-3 eicosanoids on cells in nearly every human tissue [3]. Numerous studies suggest that overproduction of n-6 eicosanoids contributes to cardiovascular disease [4, 5], cancer [6], and other chronic diseases [7, 8], as well as psychiatric and neurodegenerative disorders [9, 10]. Because the intensity of n-6 eicosanoid-mediated events depends on the intensity of n-6 HUFA release from tissue phospholipids [11], the %n-6 in HUFA serves as a biomarker that predicts n-6 eicosanoid overproduction and therefore can potentially be used to monitor health status [5, 12].
In addition to its clinical relevance in health risk assessment, the %n-6 in HUFA is useful in monitoring essential fatty acid intake [13]. Tissue HUFA composition is influenced by dietary intake of n-6 and n-3 HUFA and their 18-carbon PUFA precursors, linoleic acid (LA; 18:2n-6), gamma-linolenic acid (GLA; 18:3n-6), alpha-linolenic acid (ALA; 18:3n-3), and stearidonic acid (SDA; 18:4n-3) [1]. Accumulation of arachidonic acid (AA; 20:4n-6) in human tissues depends on dietary intake of AA as well as LA and GLA, which are elongated and desaturated to form AA (primarily in the liver). In addition, metabolic competition from intake of ALA, SDA and n-3 HUFA alters the proportion of AA accumulated in human tissue HUFA. Therefore, metabolic interactions among all four main types of essential fatty acids (n-6 and n-3 HUFA plus n-6 and n-3 18-carbon PUFA) should be included to estimate quantitatively the %n-6 in HUFA that results from dietary information. Such estimates allow researchers, clinicians, and patients to design new dietary interventions with a predicted impact on tissue composition and health status prior to actually doing the intervention and measuring the blood fatty acids.
Quantitative evidence from Mohrhauer and Holman (14, 15) showed a hyperbolic competitive relationship by which LA and ALA affect the accumulation of HUFA in liver and other tissues (reviewed in Figure 4 of [16]). An often overlooked fact from those 50-year old studies is that the increased proportions of n-3 or n-6 in HUFA in response to dietary increases in ALA or LA had a mid-point near 0.1 % of food energy (0.1 en%), and relatively little increase in HUFA was observed with dietary supplies above 2% of food energy (2 en%). Lands et al. [17] confirmed this competitive hyperbolic relationship for rats and developed an empirical equation to describe quantitatively the proportions of n-3 and n-6 in HUFA accumulated in rat liver, plasma and RBC phospholipids. In 1992, Lands et al. [13] extended the empirical equation to include dietary n-3 HUFA effects on the %n-6 in HUFA in human, rat, and mouse tissues. The equation and constants allowed successful use of blood fatty acid analyses to predict the number of n-3 HUFA capsules that some patients were taking in a small blinded clinical study [13]. They also accurately predicted the observed HUFA proportions in the blood of infants fed diets containing only 18-carbon precursors [18]. Later, two studies of Japanese consuming a wide range of n-3 HUFA [19] led to adjusting three of the eight constants [20] to give a better fit with the much broader set of data.
Here we test the ability of the empirical equation and revised constants [20] to fit data from additional, more recent, clinical studies that reported both dietary intake of fatty acids and the HUFA blood compositions of subjects consuming a variety of different diets. For each study group, we compare the %n-6 in HUFA predicted by the empirical equation, referred to here as the Lands’ Equation, to values reported for the HUFA observed in diverse blood fractions.
2. METHODS
2.1 Literature search
We conducted a literature search of the US National Library of Medicine’s PubMed database to identify clinical trials that report dietary intake of PUFA and blood fatty acid compositions of adult subjects. The search terms used were “polyunsaturated fatty acids AND (diet OR diets OR dietary) AND blood composition,” and the results were restricted to human studies published in English after 1990. We scanned titles and abstracts for potentially relevant studies and included studies if they (a) reported enough dietary data to calculate the intake of at least LA and ALA as a percentage of food energy (en%), and (b) reported enough data to calculate at least arachidonic acid (AA; 20:4n-6), eicosapentaenoic acid (EPA; 20:5n-3), and docosahexaenoic acid (DHA; 22:6n-3) as a percentage of total fatty acids in phospholipids or total lipids of either plasma, serum, or red blood cell (RBC). We excluded studies if subjects consumed more than one fish meal per week and the dietary intake of n-3 HUFA was not reported. However, for studies that did not report n-6 and/or n-3 HUFA dietary data, we used an average intake of n-6 HUFA (0.07 en%) and n-3 HUFA (0.11 en%) for typical Western diets [4].
2.2 Dietary and tissue composition data and calculations
The Lands’ Equation (Equation 2) [13] predicts a likely %n-6 in HUFA by combining dietary intakes (expressed as en%) of four categories of essential fatty acids: 18-carbon n-6 PUFA (P6; 18:2n-6 and 18:3n-6), 18-carbon n-3 PUFA (P3; 18:3n-3 and 18:4n-3), n-6 HUFA (H6; 20:3+20:4 +22:4+22:5), n-3 HUFA (H3; 20:5+22:5+22:6). The other fatty acids (O) were calculated by subtracting the en% of n-3 and n-6 nutrients from the percent of calories as fat (details are shown in an additional file, Table S1). The revised constants from [20] are
| (2) |
HC3 = 3.0, HC6 = 0.70, PC3 = 0.0555, PC6 = 0.0441, HI3 = 0.005, CO = 5.0, and Ks = 0.175. For studies that did not report dietary intake of any of the minor nutrients (18:3n-6, 18:4n-3, 20:3n-6, 22:4n-6, 22:5n-6, 22:5n3), these fatty acids were regarded as zero in calculating P6, P3, H6, and H3 for Equation 2. To compare limited data from studies that did not report dietary intake of major HUFA, we used rough estimates for typical Western diets: 0.07 en% for H6 and 0.11 en% for H3 [4]. The reported %n-6 in HUFA was calculated using Equation 1, where the amount of each tissue HUFA was expressed as a percentage of total fatty acids reported in phospholipids or total lipids of plasma, serum, or RBC. Unreported tissue HUFA were regarded as zero in Equation 1.
2.3 Statistical analysis
Data were evaluated for normality of distribution and examined for outliers. Univariate and multivariate Pearson and Spearman linear regression analyses were performed using Statistica 8.0 (StatSoft, Tulsa, OK). P-values less than 0.05 were considered statistically significant.
3. RESULTS
3.1 Literature search
The literature search resulted in 92 study groups from 34 separate studies [13,21–53] conducted in 11 different countries. The complete data are given in an additional file, Table S1. Examples of fatty acid intake and blood composition results are provided in Table 1, illustrating the variety of studies included in this analysis. Studies considered were both interventional (23 studies) [13, 21–42] and observational (11 studies) [43–53], with an average of 69 subjects per group (range 7 to 2114). The interventional studies ranged from 3 to 26 weeks, with an average of 9 weeks.
Table 1.
Dietary fatty acid intake and blood compositions for example data sets.
| Reference | Country | N | Duration (weeks) | LA | ALA | n-6 HUFA | n-3 HUFA | Blood Fraction | 20:3n-6 | 20:4n-6 | 22:4n-6 | 20:5n-3 | 22:5n-3 | 22:6n-3 | Reported %n-6 in HUFA1 | Predicted %n-6 in HUFA2 |
|---|---|---|---|---|---|---|---|---|---|---|---|---|---|---|---|---|
|
| ||||||||||||||||
| en% | % Total Fatty Acids | |||||||||||||||
|
|
|
|||||||||||||||
| [46] | Japan | 229 | Obs | 2.10 | 0.42 | 0.07 | 0.86 | S-TL | NR | 5.90 | NR | 3.80 | 1.34 | 8.40 | 30.35 | 27.21 |
| Japan | 202 | Obs | 2.54 | 0.51 | 0.06 | 0.50 | S-TL | NR | 5.30 | NR | 3.20 | 1.20 | 7.70 | 30.46 | 37.90 | |
| [21] | Sweden | 19 | 4 | 4.88 | 0.33 | 0.05 | 0.28 | S-PL | 3.15 | 8.14 | NR | 1.37 | 1.10 | 4.48 | 61.90 | 59.73 |
| Sweden | 19 | 4 | 7.33 | 2.87 | 0.04 | 0.27 | S-PL | 2.82 | 8.12 | NR | 1.79 | 1.13 | 4.75 | 58.79 | 57.52 | |
| [18] | US | 31 | 6 | 5.21 | 0.57 | 0.06 | 0.12 | P-PL | 3.45 | 11.62 | 0.44 | 0.94 | 0.97 | 3.8 | 73.09 | 70.85 |
| US | 31 | 6 | 3.15 | 0.31 | 0.04 | 0.13 | P-PL | 3.81 | 12.10 | 0.52 | 0.99 | 1.01 | 5.15 | 69.68 | 62.70 | |
| US | 30 | 6 | 5.47 | 0.64 | 0.06 | 0.10 | P-PL | 3.45 | 11.19 | 0.45 | 0.99 | 0.98 | 4.14 | 71.18 | 72.48 | |
| US | 30 | 6 | 5.46 | 0.71 | 0.05 | 0.19 | P-PL | 3.12 | 10.83 | 0.38 | 1.11 | 0.84 | 5.63 | 65.40 | 64.38 | |
| [37] | France | 276 | Obs | 4.70 | 0.37 | 0.08 | 0.20 | P-TL | 1.54 | 7.90 | 0.21 | 1.36 | 0.54 | 2.49 | 68.73 | 66.57 |
| France | 257 | Obs | 4.96 | 0.40 | 0.08 | 0.21 | P-TL | 1.51 | 8.05 | 0.20 | 1.29 | 0.54 | 2.65 | 68.54 | 66.57 | |
| [20] | Spain | 17 | 26 | 8.14 | 0.12 | 0.00 | 0.10 | P-PL | NR | 10.20 | NR | 0.81 | 0.68 | 3.96 | 65.18 | 71.19 |
| Spain | 20 | 26 | 6.55 | 0.12 | 0.00 | 0.00 | P-PL | NR | 12.30 | NR | 0.84 | 0.71 | 3.15 | 72.35 | 76.59 | |
| [42] | Germany | 2114 | Obs | 5.86 | 0.75 | 0.07 | 0.11 | RBC-PL | 1.50 | 13.10 | 2.70 | 0.75 | 2.30 | 4.70 | 69.06 | 73.05 |
ALA: alpha-linolenic acid; en%: percent of energy; HUFA: highly unsaturated fatty acids; LA: linoleic acid; n-3: omega-3; n-6: omega-6; NR: not reported; O: other fatty acids; Obs: observational study; P-PL: plasma phospholipids; P-TL: plasma total lipids; RBC-PL: red blood cell phospholipids; S-PL: serum phospholipids; S-TL: serum total lipids. % Total Fatty Acids was not reported for 22:5n-6 and 20:3n-9 in these studies.
Reported %n-6 in HUFA = (20:3n-6 + 20:4n-6 + 22:4n-6 + 22:5n-6)/(20:5n-3 + 22:5n-3 + 22:6n-3 + 20:3n-6 + 20:4n-6 + 22:4n-6 + 22:5n-6 + 20:3n-9) × 100
Predicted %n-6 in HUFA = [100][1 + HC6/en%n-6HUFA/(1 + en%n-3HUFA/HC3]−1 + [100][1 + PC6/en%LA(1 + en%ALA/PC3) + en%n-3HUFA/HI3 + en%O/Co + en%LA/Ks]−1; HC3 = 3.0, HC6 = 0.70, PC3 = 0.0555, PC6 = 0.0441, HI3 = 0.005, Co = 5.0, Ks = 0.175
3.2 Dietary and tissue composition data and calculations
Of the 34 studies included in this analysis, 19 studies (48 groups) [21–29, 43–52] published enough data to calculate all four dietary variables in the Lands’ Equation. The correlation for those 19 studies was compared with the overall result from including the remaining 15 incomplete studies (44 groups) [13, 30–42, 53] which did not report dietary intake of n-6 HUFA (and 12 of the latter studies (36 groups) [13, 33–42, 53] also did not report dietary intake of n-3 HUFA). The blood fractions analyzed included plasma phospholipids (15 studies, 52 groups) [13, 21–23, 26, 28–30, 32, 35, 37–40], plasma total lipids (5 studies, 13 groups) [31,43,44,49,50], serum phospholipids (7 studies, 14 groups) [27, 31, 41, 42, 46, 47, 51], serum total lipids (2 studies, 5 groups) [36, 52], RBC phospholipids (2 studies, 3 groups) [48, 53], RBC ethanolamine phosphoglycerides (1 study, 1 group) [45], and RBC total lipids (2 studies, 4 groups) [25, 34]. Only one study (2 groups) [31] included blood composition data for all HUFA. Many studies did not provide values for 20:3n-9 (32 studies, 86 groups) [21–30, 32–53], 22:5n-6 (29 studies, 84 groups) [13, 21–30, 32–36, 38–44, 47–52], 22:4n-6 (23 studies, 68 groups) [22, 23, 25–30, 32–36, 38–42, 44, 47, 49, 50, 52], 20:3n-6 (17 studies, 51 groups) [22, 25, 26, 29, 30, 33–36, 38, 39, 41, 42, 47, 49, 50, 52], and/or 22:5n-3 (10 studies, 35 groups) [23, 25, 28, 29, 33, 36, 41, 42, 46, 49].
Figure 1 compares the observed %n-6 in HUFA derived from blood composition data and the predicted %n-6 in HUFA estimated from dietary data using the Lands’ Equation. The regression analysis including all study groups (n = 92) gave a correlation coefficient of r = 0.73 (p < 0.000000), with a slope of 0.83 and a y-intercept of 9.92. Restricting the analysis to groups with complete dietary data (n = 48) resulted in a higher correlation coefficient (r = 0.78; p < 0.000000) and a slope and y-intercept of 0.94 and 1.33, respectively. In contrast, for groups with incomplete dietary data (n = 44), the correlation coefficient was lower (r = 0.40; p < 0.007), with a slope and y-intercept of 0.35 and 44.97, respectively (data not shown), indicating that using generalized estimates for n-6 and n-3 HUFA intake reduces the accuracy of the Lands’ Equation.
Figure 1.
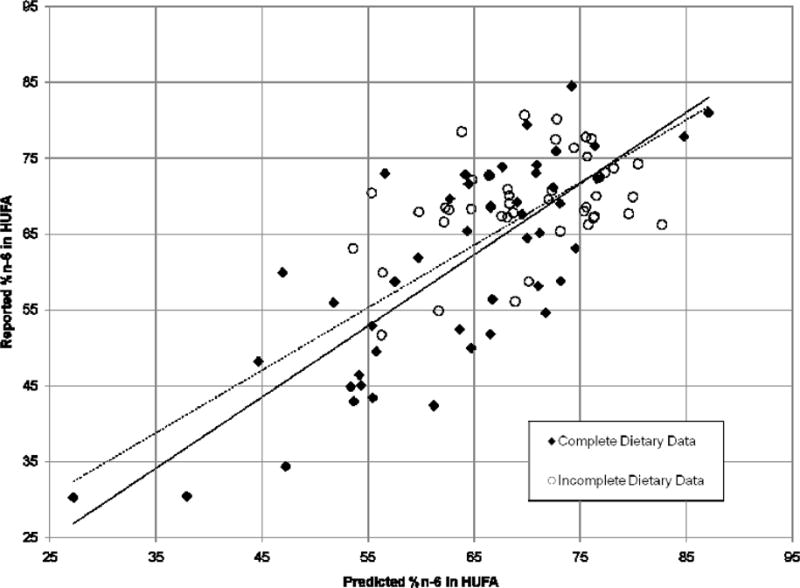
Correlation between the reported and predicted %n-6 in HUFA. The reported %n-6 in HUFA was calculated from blood fatty acid compositions expressed as percentages of total fatty acids in plasma, serum, or RBC phospholipids or total lipids. The predicted %n-6 in HUFA was calculated from dietary intakes using the Lands’ Equation [13] with revised constants [20]. The solid line represents the regression analysis for study groups with complete dietary data (n = 48, y = 0.94x + 1.33, r = 0.78, p < 0.000000). The dashed line represents the regression analysis for all study groups (n = 92, y = 0.83x + 9.92, r = 0.73, p < 0.000000).
For study groups with complete dietary data (n = 48), we also evaluated each dietary fatty acid component (n-6 HUFA, n-3 HUFA, 18-carbon n-6 PUFA, and 18-carbon n-3 PUFA) as a predictor of the %n-6 in HUFA. Using univariate regression models, only n-3 HUFA intake was significantly correlated with the reported %n-6 in HUFA (r = −0.85; p < 0.000000). We then entered all four dietary fatty acid components into a multivariate regression analysis to evaluate the apparent influence of each component on the observed %n-6 in HUFA. For the range of dietary intakes studied, both n-3 HUFA (β = −0.89) and 18-carbon n-3 PUFA (β = −0.18), but not AA or 18-carbon n-6 PUFA, were significant predictors in the overall model (r = 0.87; p < 0.000000).
4. DISCUSSION
The present analysis provides further evidence that the Lands’ Equation can reliably predict the %n-6 in HUFA in human plasma, serum, or RBC blood fractions using dietary intakes of n-6 and n-3 HUFA and their 18-carbon precursors. Our results confirm that the %n-6 in HUFA is a suitable biomarker for the relative intake of n-6 and n-3 fatty acids in the human diet. In the 1992 study that developed the quantitative, competitive, hyperbolic relationship for humans [13], the authors used an empirical equation with constants that fitted HUFA accumulation in liver, plasma, and RBC of rats [17]. The equation closely estimated the proportions of HUFA in plasma of human subjects who ate little n-6 or n-3 HUFA.
To describe the tissue HUFA of 8 additional patients taking n-3 HUFA supplements, a term was added to the equation to account for competitive interactions of n-6 and n-3 HUFA [13]. At the time, the report noted that: “Future controlled studies of humans with a wide range of en% fat and a widely varied intake of (n - 3) and (n - 6) fatty acids could provide data needed to establish the relationship more firmly.” The present report (like the 1992 report) adds to the growing evidence of extensive similarities between rats and humans in the selectivity of essential fatty acid metabolism.
In 2003, Lands [19] applied the equation to two sets of data from Japanese with a wider range of HUFA in their diets ([47], n = 87; [49], n = 79) and adjusted three of the eight original constants to fit the additional data. The regression line comparing the reported and predicted %n-6 in HUFA values for the combined original and Japanese data [19] had a slope and y-intercept of 0.90 and 1.43 (r = 0.90), respectively, which are similar to the slope and y-intercept found for studies with complete dietary data in the present analysis (slope = 0.94 and y-intercept = 1.33; r = 0.78; Figure 1) using the same constants.
In this study, a high inverse linear correlation (r = −0.85) was observed between dietary intake of n-3 HUFA and the %n-6 in HUFA for subject groups with complete dietary data. This finding is consistent with other reports of significant correlations between dietary intake of n-3 HUFA and the level of n-3 HUFA in plasma or serum [43, 47, 50], since any increase in tissue n-3 HUFA decreases the relative proportion of n-6 HUFA in total tissue HUFA. Multivariate regression analysis of the present data set indicates that dietary intake of 18-carbon n-3 PUFA also associates with the %n-6 in HUFA, although the effect was small (β = −0.18) compared to that for dietary n-3 HUFA (β = −0.89).
The small apparent influence of 18-carbon n-3 PUFA intake on the %n-6 in HUFA, as well as the insignificant apparent influence of 18-carbon n-6 PUFA and n-6 HUFA intakes, can be understood by comparing the diets included in this study. For each diet, LA intake far exceeded the intake of all other essential acids, with an average intake of 6 en% (range 1.77 to 15.16 en%). Our studies following those of Mohrhauer and Holman [14, 15] noted a mid-point of response to dietary abundance near 0.1 en% as reflected in the currently used values for PC3 (0.0555) and PC6 (0.044). At levels of LA intake above 1.77 en%, the enzymes involved in PUFA elongation and desaturation were likely saturated with LA and its metabolites. As a result, we do not expect the differences in LA intake among the diets in this study to appreciably affect the accumulated %n-6 in HUFA [16].
The intake of n-6 HUFA was the lowest of any of the four types of n-3 and n-6 nutrients (P3, P6, H3, H6). Only one subject group consumed more than 0.16 en%, whereas intake of n-3 HUFA ranged from 0 to 0.86 en%. Table 1 (and an additional file, Table S1) illustrate how different ethnic lifestyles give different average intakes of n-3 and n-6 nutrients and cause different outcomes of HUFA balance. To estimate the likely impact of changing any of the four types of nutrient intake, the equation and constants were embedded into a simple spreadsheet calculator ([54], Figure 10 in [16]). For example, lowering P6 from 6.95 to 2 en% may lower HUFA balance from 80% n-6 in HUFA (near typical USA values) to 64% n-6 in HUFA (near traditional Mediterranean values). Alternatively, raising H3 intake from 0.03 to 0.3 en% may lower the former outcome of 80 % to 67% n-6 in HUFA whereas it could be expected to lower the latter 64% to 43% n-6 in HUFA.
Importantly, voluntary food intakes differ widely from day to day, and estimates of the likely outcome of metabolic competitions among the four types of essential acids include an assumption that sufficient time with a consistent diet pattern has allowed a steady-state equilibration. There is a long history of unreliable dietary data due to errors in human recall, data base adequacy, etc. The successful fit of predicted and observed values for HUFA balance in Figure 1 makes the empirical relationship an objective clinical biomarker of HUFA balance to serve as a credible surrogate for inadequate dietary estimates.
The relationship between dietary n-3 HUFA and tissue HUFA composition found for most contemporary diets led some researchers to advocate n-3 HUFA biomarkers that neglect the influence of dietary n-6 PUFA. One proposed biomarker is the “Omega-3 Index”, defined as the sum of the percentage of EPA and DHA in total fatty acids of RBC (%EPA + DHA in RBC) [55]. Studies on subjects consuming Western diets have reported strong correlations between the %EPA + DHA in RBC and the %n-3 or the %n-6 in HUFA, suggesting that HUFA biomarkers might be useful in a limited range of dietary PUFA intake [5].
The %n-6 in HUFA parameter has some advantages over the %EPA + DHA in RBC, especially for use in low-cost, high-throughput health risk assessments. First, the %n-6 in HUFA focuses attention on the production of n-6 eicosanoids, a major determinant for many chronic diseases [2, 12]. Second, the value for 100 - %n-6 in HUFA equals the value for %n-3 in HUFA, which includes 22:5n-3, an acid often more abundant than 20:5n-3, EPA and associated with decreased eicosanoid production [56]. Sun et al. [57] concluded from data in the Nurses’ Health Study that 22:5n-3 alone, after total combined n-3 HUFA, was the best predictor of a lower incidence of nonfatal myocardial infarction among US women. Third, the proportions of n-6 or n-3 HUFA in total HUFA are comparable for liver, plasma, serum and RBC in rats [17] and for plasma, serum and RBC in humans [58, 59]. The comparable proportions likely reflect the continual remodelling of fatty acids in RBC phospholipids [60]. The rapid turnover makes proportions of HUFA in RBC respond to diet changes much faster than the overall 120-day lifespan of a RBC.
Moreover, the comparable HUFA proportions in whole blood make it possible to measure the %n-6 in HUFA economically without the need to centrifuge to separate blood fractions or prepare phospholipid fractions as done by others [58]. Fourth, the %n-6 in HUFA does not require integration of peaks that elute before methyl eicosanoate (20:0), resulting in a more rapid chromatographic analysis that is suitable for a high-throughput assays. Fifth, the similar chemical stabilities of HUFA allow each HUFA to serve as an internal recovery standard for other HUFA in the %n-6 in HUFA, regardless of the different stabilities of saturated, monounsaturated, and polyunsaturated acids. Furthermore, although studies have demonstrated that the %EPA + DHA in RBC can change with changed diets, there is no published equation to estimate quantitatively the response of RBC HUFA to a changed diet. In contrast, the Lands’ Equation provides estimates of likely values for the %n-6 in HUFA in multiple blood fractions for a wide range of diets and dietary changes.
The present study had several weaknesses, particularly the limited diversity and accuracy of dietary data available. As discussed above, the limited range of diets available for our analysis did not allow us to evaluate the full spectrum of possibly desirable human diets. Many of the diets analyzed did not report dietary intake of n-6 HUFA and/or n-3 HUFA, and they required the use of rough estimates to estimate tissue HUFA composition with the Lands’ Equation. In addition to incomplete dietary data, most studies did not report the amounts of all the HUFA present in the blood fraction analyzed. This weakness is particularly evident in reports that emphasize the %EPA + DHA in RBC and tend to neglect competing n-6 HUFA. 5.
5. CONCLUSIONS
This study shows that the Lands’ Equation reliably estimates the %n-6 in HUFA of plasma, serum, and RBC using the average dietary intake of n-6 and n-3 HUFA and their 18-carbon precursors. Future studies should confirm these findings and further assess the Lands’ Equation and its constants on a wider range of diets, particularly diets with low LA content. In addition, with the recognized causal role for n-6 arachidonate in chronic inflammatory and thrombotic disorders [61], it would be valuable to evaluate the %n-6 in HUFA as a biomarker for monitoring nutritional interventions in cardiovascular and other chronic inflammatory diseases.
Supplementary Material
Highlights.
Blood compositions of omega-3 and omega-6 highly unsaturated fatty acids (HUFA) are biomarkers useful for estimating disease risks.
Estimations of n-3 and n-6 HUFA compositions form dietary intakes typically do not include the contribution of dietary 18 carbon n-3 and n-6 precursor fatty acids.
Circulating HUFA compositions can be reliably estimated from dietary intake data that not only includes n-3 and n-6 HUFA consumption, but also includes consumption of 18 carbon n-3 and n-6 precursor fatty acids.
Acknowledgments
This research was supported by the Intramural Research Program of the National Institutes on Alcohol Abuse and Alcoholism, NIH.
List of abbreviations
- AA
arachidonic acid
- ALA
alpha-linolenic acid
- DHA
docosahexaneoic acid
- GLA
gamma-linolenic acid
- en%
percent of energy
- EPA
eicosapentaenoic acid
- %EPA + DHA in RBC
percentage of EPA and DHA in total fatty acids of red blood cell
- HUFA
highly unsaturated fatty acids
- LA
linoleic acid
- NR
not reported
- n-3
omega-3
- n-6
omega-6
- %n-6 in HUFA
the percentage of omega-6 highly unsaturated fatty acids in total tissue HUFA
- P-PL
plasma phospholipids
- P-TL
plasma total lipids
- PUFA
polyunsaturated fatty acids
- RBC
red blood cell
- RBC-PL
red blood cell phospholipids
- S-PL
serum phospholipids
- SDA
stearidonic acid
- S-TL
serum total lipids
Footnotes
Publisher's Disclaimer: This is a PDF file of an unedited manuscript that has been accepted for publication. As a service to our customers we are providing this early version of the manuscript. The manuscript will undergo copyediting, typesetting, and review of the resulting proof before it is published in its final citable form. Please note that during the production process errors may be discovered which could affect the content, and all legal disclaimers that apply to the journal pertain.
Competing interests
The authors declare that they have no competing interests.
Authors’ contributions
SES performed the literature search, analysed the data, and drafted the manuscript. BL participated in the design of the study and helped draft the manuscript. JRH conceived of the study, performed the statistical analysis and assisted in the manuscript. All authors read and approved the final manuscript.
References
- 1.Das UN. Essential fatty acids—a review. Curr Pharm Biotechnol. 2006;7:467–482. doi: 10.2174/138920106779116856. [DOI] [PubMed] [Google Scholar]
- 2.Khanapure SP, Garvey DS, Janero DR, Letts LG. Eicosanoids in inflammation: biosynthesis, pharmacology, and therapeutic frontiers. Curr Top Med Chem. 2007;7:311–340. doi: 10.2174/156802607779941314. [DOI] [PubMed] [Google Scholar]
- 3.Wada M, DeLong CJ, Hong YH, Rieke CJ, Song I, Sidhu RS, Yuan C, Warnock M, Schmaier AH, Yokoyama C, Smyth EM, Wilson SJ, FitzGerald GA, Garavito RM, Sui de X, Regan JW, Smith WL. Enzymes and receptors of prostaglandin pathways with arachidonic acid-derived versus eicosapentaenoic acid-derived substrates and products. J Biol Chem. 2007;282:22254–22266. doi: 10.1074/jbc.M703169200. [DOI] [PubMed] [Google Scholar]
- 4.Hibbeln JR, Nieminen LR, Blasbalg TL, Riggs JA, Lands WE. Healthy intakes of n-3 and n-6 fatty acids: estimations considering worldwide diversity. Am J Clin Nutr. 2006;83(Suppl):1483S–1493S. doi: 10.1093/ajcn/83.6.1483S. [DOI] [PubMed] [Google Scholar]
- 5.Lands B. Measuring blood fatty acids as a surrogate indicator for coronary heart disease risk in population studies. World Rev Nutr Diet. 2009;100:22–34. doi: 10.1159/000235708. [DOI] [PubMed] [Google Scholar]
- 6.Wang D, Dubois RN. Eicosanoids and cancer. Nat Rev Cancer. 2010;10:181–193. doi: 10.1038/nrc2809. [DOI] [PMC free article] [PubMed] [Google Scholar]
- 7.Calder PC. Polyunsaturated fatty acids, inflammation, and immunity. Lipids. 2001;36:1007–1024. doi: 10.1007/s11745-001-0812-7. [DOI] [PubMed] [Google Scholar]
- 8.Simopoulos AP. Essential fatty acids in health and chronic disease. Am J Clin Nutr. 1999;70:560S–569S. doi: 10.1093/ajcn/70.3.560s. [DOI] [PubMed] [Google Scholar]
- 9.Phillis JW, Horrocks LA, Farooqui AA. Cyclooxygenases, lipoxygenases, and epoxygenases in CNS: their role and involvement in neurological disorders. Brain Res Rev. 2006;52:201–243. doi: 10.1016/j.brainresrev.2006.02.002. [DOI] [PubMed] [Google Scholar]
- 10.Tassoni D, Kaur G, Weisinger RS, Sinclair AJ. The role of eicosanoids in the brain. Asia Pac J Clin Nutr. 2008;17:220–228. [PubMed] [Google Scholar]
- 11.Bibus D, Lands B. Balancing proportions of competing omega-3 and omega-6 highly unsaturated fatty acids (HUFA) in tissue lipids. Prost Leuko Essent Fatty Acids. 2015;99:19–23. doi: 10.1016/j.plefa.2015.04.005. http://www.plefa.com/article/S0952-3278(15)00087-3/pdf. Accessed June 2016. [DOI] [PubMed] [Google Scholar]
- 12.Lands B. Omega-3 PUFAs lower the propensity for arachidonic acid cascade overreactions. Biomed Res Int. 2015;2015:285135. doi: 10.1155/2015/285135. http://www.hindawi.com/journals/bmri/2015/285135/. Accessed June 2016. [DOI] [PMC free article] [PubMed] [Google Scholar]
- 13.Lands WEM, Libelt B, Morris A, Kramer NC, Prewitt TE, Bowen P, Schmeisser D, Davidson MH, Burns JH. Maintenance of lower proportions of (n-6) eicosanoid precursors in phospholipids of human plasma in response to added dietary (n-3) fatty acids. Biochim Biophys Act. 1992;1180:147–162. doi: 10.1016/0925-4439(92)90063-s. [DOI] [PubMed] [Google Scholar]
- 14.Mohrhauer H, Holman RT. The effect of dose level of essential fatty acids upon fatty acid composition of the rat liver. J Lipid Res. 1963;4:151–159. [PubMed] [Google Scholar]
- 15.Mohrhauer H, Holman RT. Effect of linolenic acid upon the metabolism of linoleic acid. J Nutr. 1963;81:67–74. doi: 10.1093/jn/81.1.67. [DOI] [PubMed] [Google Scholar]
- 16.Lands B. A critique of paradoxes in current advice on dietary lipids. Prog Lipid Res. 2008;47(2):77–106. doi: 10.1016/j.plipres.2007.12.001. [DOI] [PubMed] [Google Scholar]
- 17.Lands WEM, Morris AJ, Libelt B. Quantitative Effects of Dietary Polyunsaturated Fats on the Composition of Fatty Acids in Rat Tissues. Lipids. 1990;5:505–516. doi: 10.1007/BF02537156. [DOI] [PubMed] [Google Scholar]
- 18.Clark KJ, Makrides M, Neumann MA, Gibson RA. Determination of the optimal ratio of linoleic acid to alpha-linolenic acid in infant formulas. J Pediatr. 1992;120(Suppl):S151–S158. doi: 10.1016/s0022-3476(05)81250-8. [DOI] [PubMed] [Google Scholar]
- 19.Lands WEM. Functional foods in primary prevention or nutraceuticals in secondary prevention? Current Topics in Nutraceutical Research. 2003;1(2):113–120. [Google Scholar]
- 20.Equation with revised constants online. http://efaeducation.org/relating-diets-to-hufa/
- 21.Chan JK, McDonald BE, Gerrard JM, Bruce VM, Weaver BJ, Holub BJ. Effect of dietary alpha-linolenic acid and its ratio to linoleic acid on platelet and plasma fatty acids and thrombogenesis. Lipids. 1992;28:811–817. doi: 10.1007/BF02536235. [DOI] [PubMed] [Google Scholar]
- 22.Finnegan YE, Minihane AM, Leigh-Firbank EC, Kew S, Meijer GW, Muggli R, Calder PC, Williams CM. Plant- and marine-derived n-3 polyunsaturated fatty acids have differential effects on fasting and postprandial blood lipid concentrations and on the susceptibility of ldl to oxidative modification in moderately hyperlipidemic subjects. Am J Clin Nutr. 2003;77:783–795. doi: 10.1093/ajcn/77.4.783. [DOI] [PubMed] [Google Scholar]
- 23.Hirota S, Adachi N, Gomyo T, Kawashima H, Kiso Y, Kawabata T. Low-dose arachidonic acid intake increases erythrocytes and plasma arachidonic acid in young women. Prostaglandins Leukot Essent Fatty Acids. 2010;83:83–88. doi: 10.1016/j.plefa.2010.05.003. [DOI] [PubMed] [Google Scholar]
- 24.King IB, Lemaitre RN, Kestin M. Effect of a low-fat diet on fatty acid composition in red cells, plasma, phospholipids, and cholesterol esters: investigation of a biomarker of total fat intake. Am J Clin Nutr. 2006;83:227–236. doi: 10.1093/ajcn/83.2.227. [DOI] [PubMed] [Google Scholar]
- 25.Legrand P, Schmitt B, Mourot J, Catheline D, Chesneau G, Mireaux M, Kerhoas N, Weill P. The consumption of food products from linseed-fed animals maintains erythrocyte omega-3 fatty acids in obese humans. Lipids. 2010;45:11–19. doi: 10.1007/s11745-009-3376-5. [DOI] [PubMed] [Google Scholar]
- 26.Olza J, Mesa MD, Aguilera CM, Moreno-Torres R, Jiménez A, Pérez de la Cruz A, Gil A. Influence of an eicosapentaenoic and docosahexaenoic acid-enriched enteral nutrition fomula on plasma fatty acid composition and biomarkers of insulin resistance in the elderly. Clin Nutr. 2010;29:31–37. doi: 10.1016/j.clnu.2009.06.003. [DOI] [PubMed] [Google Scholar]
- 27.Södergren E, Gustafsson IB, Basu S, Nourooz-Zadeh J, Nälsén C, Turpeinen A, Berglund L, Vessby B. A diet containing rapeseed oil-based fats does not increase lipid peroxidation in humans when compared to a diet rich in saturated fatty acids. Eur J Clin Nutr. 2001;55:922–93. doi: 10.1038/sj.ejcn.1601246. [DOI] [PubMed] [Google Scholar]
- 28.Thies F, Nebe-von-Caron G, Powell JR, Yaqoob P, Newsholme EA, Calder PC. Dietary supplementation with eicosapentaenoic acid, but not with other long-chain n-3 or n-6 polyunsaturated fatty acids, decreases natural killer cell activity in healthy subjects aged >55 y. Am J Clin Nutr. 2001;73:539–548. doi: 10.1093/ajcn/73.3.539. [DOI] [PubMed] [Google Scholar]
- 29.Wallace FA, Miles EA, Calder PC. Comparison of the effects of linseed oil and different doses of fish oil on mononuclear cell function in healthy human subjects. Br J Nutr. 2003;89:679–689. doi: 10.1079/BJN1079/2002821. [DOI] [PubMed] [Google Scholar]
- 30.Dabadie H, Motta C, Peuchant E, LeRuyet P, Mendy F. Variations in daily intakes of myristic and alpha-linolenic acids in sn-2 position modify lipid profile and red blood cell membrane fluidity. Br J Nutr. 2006;96:283–289. doi: 10.1079/bjn20061813. [DOI] [PubMed] [Google Scholar]
- 31.Forsythe CE, Phinney SD, Fernandez ML, Quann EE, Wood RJ, Bibus DM, Kraemer WJ, Feinman RD, Volek JS. Comparison of low fat and low carbohydrate diets on circulating fatty acid composition and markers of inflammation. Lipids. 2007;43:65–77. doi: 10.1007/s11745-007-3132-7. [DOI] [PubMed] [Google Scholar]
- 32.Valsta LM, Salminen I, Aro A, Mutanen M. Alpha-linolenic acid in rapeseed oil partly compensates for the effect of fish restriction on plasma long chain n-3 fatty acids. Eur J Clin Nutr. 1996;50:229–235. [PubMed] [Google Scholar]
- 33.Almario RU, Vonghavaravat V, Wong R, Kasim-Karakas SE. Effects of walnut consumption on plasma fatty acids and lipoproteins in combined hyperlipidemia. Am J Clin Nutr. 2001;74:72–79. doi: 10.1093/ajcn/74.1.72. [DOI] [PubMed] [Google Scholar]
- 34.Bourque C, St-Onge P, Papamandjaris AA, Cohn JS, Jones PJ. Consumption of an oil composed of medium chain triacylglycerols, phytosterols, and N-3 fatty acids improves cardiovascular risk profile in overweight women. Metabolism. 2003;52:771–777. doi: 10.1016/s0026-0495(03)00070-2. [DOI] [PubMed] [Google Scholar]
- 35.Goyens PL, Spilker ME, Zock PL, Katan MB, Mensink RP. Conversion of alpha-linolenic acid in humans is influenced by the absolute amounts of alpha-linolenic acid and linoleic acid in the diet and not by the ratio. Am J Clin Nutr. 2006;84:44–53. doi: 10.1093/ajcn/84.1.44. [DOI] [PubMed] [Google Scholar]
- 36.Griel AE, Kris-Etherton PM, Hilpert KF, Zhao G, West SG, Corwin RL. An increase in dietary n-3 fatty acids decreases a marker of bone resorption in humans. Nutr J. 2007;6:2. doi: 10.1186/1475-2891-6-2. [DOI] [PMC free article] [PubMed] [Google Scholar]
- 37.Li DA, Sinclair A, Wilson A, Nakkote S, Kelly F, Abedin L, Mann N, Turner A. Effect of dietary alpha-linolenic acid on thrombotic risk factors in vegetarian men. Am J Clin Nutr. 1999;69:872–882. doi: 10.1093/ajcn/69.5.872. [DOI] [PubMed] [Google Scholar]
- 38.Lichtenstein AH, Matthan NR, Jalbert SM, Resteghini NA, Schaefer EJ, Ausman LM. Novel soybean oils with different fatty acid profiles alter cardiovascular disease risk factors in moderately hyperlipidemic subjects. Am J Clin Nutr. 2006;84:497–504. doi: 10.1093/ajcn/84.3.497. [DOI] [PubMed] [Google Scholar]
- 39.Raatz SK, Bibus D, Thomas W, Kris-Etherton P. Total fat intake modifies plasma fatty acid composition in humans. J Nutr. 2001;131:231–234. doi: 10.1093/jn/131.2.231. [DOI] [PubMed] [Google Scholar]
- 40.Seppänen-Laaksoa T, Laakso I, Lehtimäki T, Rontu R, Moilanen E, Solakivi T, Seppo L, Vanhanen H, Kiviranta K, Hiltunen R. Elevated plasma fibrinogen caused by inadequate alpha-linolenic acid intake can be reduced by replacing fat with canola-type rapeseen oil. Prostaglandins Leukot Essent Fatty Acids. 2010;83:45–54. doi: 10.1016/j.plefa.2010.02.001. [DOI] [PubMed] [Google Scholar]
- 41.Thijssen MA, Mensink RP. Small differences in the effects of stearic acid, oleic acid, and linoleic acid on the serum lipoprotein profile of humans. Am J Clin Nutr. 2005;82:510–516. doi: 10.1093/ajcn.82.3.510. [DOI] [PubMed] [Google Scholar]
- 42.Vega-López S, Ausman LM, Jalbert SM, Erkkilä AT, Lichtenstein AH. Palm and partially hydrogenated soybean oils adversely alter lipoprotein profiles compared with soybean and canola oils in moderately hyperlipidemic subjects. Am J Clin Nutr. 2006;84:54–62. doi: 10.1093/ajcn/84.1.54. [DOI] [PubMed] [Google Scholar]
- 43.Astorg P, Bertrais S, Laporte F, Arnault N, Estaquio C, Galan P, Favier A, Hercberg S. Plasma n-6 and n-3 polyunsaturated fatty acids as biomarkers of their dietary intakes: a cross-sectional study within a cohort of middle-aged French men and women. Eur J Clin Nutr. 2008;62:1155–1161. doi: 10.1038/sj.ejcn.1602836. [DOI] [PubMed] [Google Scholar]
- 44.Bakewell L, Burdge GC, Calder PC. Polyunsaturated fatty acid concentrations in young men and women consuming their habitual diets. Br J Nutr. 2006;96:98–99. doi: 10.1079/bjn20061801. [DOI] [PubMed] [Google Scholar]
- 45.Friesen RW, Innis SM. Linoleic acid is associated with lower long-chain n-6 and n-3 fatty acids in red blood cell lipids in Canadian pregnant women. Am J Clin Nutr. 2010;91:23–31. doi: 10.3945/ajcn.2009.28206. [DOI] [PubMed] [Google Scholar]
- 46.Glew RH, Wold RS, Herbein JH, Wark WA, Martinez MA, Vanderjagt DJ. Low docosahexaenoic acid in the diet and milk of women in New Mexico. J Am Diet Assoc. 2008;108:1693–1699. doi: 10.1016/j.jada.2008.07.006. [DOI] [PubMed] [Google Scholar]
- 47.Kobayashi M, Sasaki S, Kawabata T, Hasegawa K, Akabane M, Tsugane S. Single measurement of serum phospholipid fatty acid as a biomarker of specific fatty acid intake in middle-aged men. Eur J Clin Nutr. 2001;55:643–650. doi: 10.1038/sj.ejcn.1601194. [DOI] [PubMed] [Google Scholar]
- 48.Kröger J, Zietemann V, Enzenbach C, Weikert C, Jansen EH, Döring F, Joost HG, Boeing H, Schulze MB. Erythrocyte membrane phospholipid fatty acids, desaturase activity, and dietary fatty acids in relation to risk of type 2 diabetes in European Prospective Investigation into Cancer and Nutrition (EPIC)-Potsdam Study. Am J Clin Nutr. 2011;93:127–143. doi: 10.3945/ajcn.110.005447. [DOI] [PubMed] [Google Scholar]
- 49.Kuriki K, Nagaya T, Imaeda N, Tokudome Y, Fujiwara N, Sato J, Ikeda M, Maki S, Tokudome S. Discrepancies in dietary intakes and plasma concentrations of fatty acids according to age among Japanese female dietitians. Eur J Clin Nutr. 2002;56:524–531. doi: 10.1038/sj.ejcn.1601344. [DOI] [PubMed] [Google Scholar]
- 50.Kuriki K, Nagaya T, Tokudome Y, Imaeda N, Fujiwara N, Sato J, Goto C, Ikeda M, Maki S, Tajima K, Tokudome S. Plasma concentrations of (n-3) highly unsaturated fatty acids are good biomarkers of relative dietary fatty acid intakes: a cross-sectional study. J Nutr. 2003;133:3643–3650. doi: 10.1093/jn/133.11.3643. [DOI] [PubMed] [Google Scholar]
- 51.Thiébaut AC, Kasai M, Taguchi N, Lenoir GM, Boutron-Ruault MC, Joulin V, Clavel-Chapelon F, Chajès V. Correlation between serum phospholipid fatty acids and dietary intakes assessed a few years earlier. Nutr Cancer. 2009;61:500–509. doi: 10.1080/01635580802710717. [DOI] [PubMed] [Google Scholar]
- 52.Yamada T, Strong JP, Ishii T, Ueno T, Koyama M, Wagayama H, Shimizu A, Sakai T, Malcom GT, Guzman MA. Atherosclerosis and omega-3 fatty acids in the populations of a fishing village and a farming village in Japan. Atherosclerosis. 2000;153:469–481. doi: 10.1016/s0021-9150(00)00431-7. [DOI] [PubMed] [Google Scholar]
- 53.Fuhrman BJ, Barba M, Krogh V, Micheli A, Pala V, Lauria R, Chajes V, Riboli E, Sieri S, Berrino F, Muti P. Erythrocyte membrane phospholipid composition as a biomarker of dietary fat. Ann Nutr Metab. 2006;50:95–102. doi: 10.1159/000090496. [DOI] [PubMed] [Google Scholar]
- 54.Simple calculator. http://efaeducation.org/omega_foods_apps/dietary-balance/
- 55.Harris WS. The omega-3 index as a risk factor for coronary heart disease. Am J Clin Nutr. 2008;87(Suppl):1997S–2002S. doi: 10.1093/ajcn/87.6.1997S. [DOI] [PubMed] [Google Scholar]
- 56.Stark KD. The percentage of n-3 highly unsaturated fatty acids in total HUFA as a biomarker for omega-3 fatty acid status in tissues. Lipids. 2008;43:45–53. doi: 10.1007/s11745-007-3128-3. [DOI] [PubMed] [Google Scholar]
- 57.Murphy MG, Wright V, Scott J, Timmins A, Ackman RG. Dietary menhaden, seal, and corn oils differentially affect lipid and ex vivo eicosanoid and thiobarbituric acid-reactive substances generation in the guinea pig. Lipids. 1999;34:115–124. doi: 10.1007/s11745-999-0344-1. [DOI] [PubMed] [Google Scholar]
- 58.Sun Q, Ma J, Campos H, Rexrode KM, Albert CM, Mozaffarian D, Hu FB. Blood concentrations of individual long-chain n-3 fatty acids and risk of nonfatal myocardial infarction. Am J Clin Nutr. 2008;88:216–223. doi: 10.1093/ajcn/88.1.216. [DOI] [PMC free article] [PubMed] [Google Scholar]
- 59.Armstrong JF, Metherel AH, Stark KD. Direct microwave transesterification of fingertip prick blood samples for fatty acid determinations. Lipids. 2008;43:187–196. doi: 10.1007/s11745-007-3141-6. [DOI] [PubMed] [Google Scholar]
- 60.Stark KD, Beblo S, Murthy M, Buda-Abela M, Janisse J, Rockett H, Whitty JE, Martier SS, Sokol RJ, Hannigan JH, Salem N. Comparison of bloodstream fatty acid composition from African-American women at gestation, delivery, and postpartum. J Lipid Res. 2005;46:516–525. doi: 10.1194/jlr.M400394-JLR200. [DOI] [PubMed] [Google Scholar]
- 61.Waku K, Lands WEM. Control of Lecithin Biosynthesis in Erythrocyte Membranes. J Lipid Res. 1968;9:12–18. [PubMed] [Google Scholar]
- 62.Lands B. Benefit–Risk Assessment of Fish Oil in Preventing Cardiovascular Disease. Drug Safety. 2016;39(9):787–799. doi: 10.1007/s40264-016-0438-5. [DOI] [PMC free article] [PubMed] [Google Scholar]
Associated Data
This section collects any data citations, data availability statements, or supplementary materials included in this article.