

Summary
Most disease variants lie within noncoding genomic regions, making their functional interpretation challenging. Because chromatin openness strongly influences transcriptional activity, we hypothesized that cell-type-specific open chromatin regions (OCRs) might highlight disease-relevant noncoding sequences. To investigate, we mapped global OCRs in neurons differentiating from hiPSCs, a cellular model for studying neurodevelopmental disorders such as schizophrenia (SZ). We found that the OCRs are highly dynamic and can stratify GWAS-implicated SZ risk variants. Of the more than 3,500 SZ-associated variants analyzed, we prioritized ∼100 putatively functional ones located in neuronal OCRs, including rs1198588, at a leading risk locus flanking MIR137. Excitatory neurons derived from hiPSCs with CRISPR/Cas9-edited rs1198588 or a rare proximally located SZ risk variant showed altered MIR137 expression, dendrite arborization, and synapse maturation. Our study shows that noncoding disease variants in OCRs can affect neurodevelopment, and that analysis of open chromatin regions can help prioritize functionally relevant noncoding variants identified by GWAS.
Graphical abstract
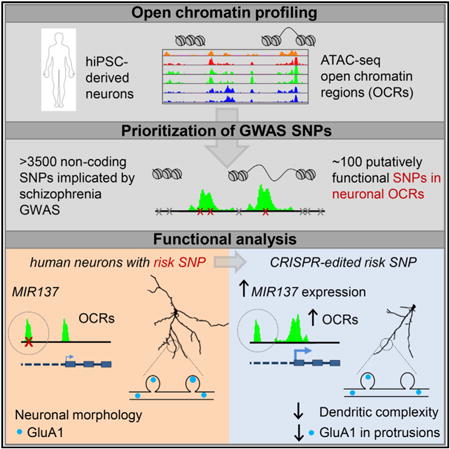
Forrest et al. outline an approach for prioritizing noncoding GWAS risk variants using open chromatin analysis in differentiating hiPSCs. They further show that CRISPR/Cas9 editing of prioritized schizophrenia risk SNPs near MIR137 alters gene expression, open chromatin, and neurodevelopment in hiPSC-derived neurons.
Introduction
Genome-wide association studies (GWASs) of complex disorders have revealed a plethora of risk variants (Welter et al., 2014). However, understanding causal disease mechanisms has been limited by the difficulty of interpreting disease risk variants, most of which are in noncoding DNA sequences that are poorly annotated. Chromatin openness or accessibility to transcription factors (TFs) has marked effects on gene transcription (Degner et al., 2012; Thurman et al., 2012). Thus, open chromatin regions (OCRs) likely contain functional noncoding variants that regulate chromatin state and gene expression by affecting TF-binding sites (TFBSs) (Ang et al., 2016; Grubert et al., 2015). Although chromatin state profiles (e.g., monomethylated histone H3 lysine 4 [H3K4me1] and trimethylated histone H3 lysine 4 [H3K4me3]) from the Encyclopedia of DNA Elements (ENCODE) Project have been used to predict functional noncoding sequences (Dunham et al., 2012; Lee et al., 2015; Thurman et al., 2012), their utility is limited by the lack of open chromatin profiles of disease-relevant cell types (Paul et al., 2014).
Studying the functional relevance of OCRs in disease-relevant neuronal cell types is particularly important for neuropsychiatric disorders. The number of known GWAS risk loci for neuropsychiatric disorders is among the highest for a complex disease, with schizophrenia (SZ) alone having more than 100 risk loci (Schizophrenia Working Group of the Psychiatric Genomics Consortium, 2014). ENCODE open chromatin data from postmortem brains are the primary resource for functional prediction of non-coding variants of brain disorders. However, postmortem brain data are well known to be confounded by cell heterogeneity and environmental factors (Lipska et al., 2006) and do not capture changes at early neurodevelopmental stages (Brennand et al., 2015). Enrichment analyses of GWAS risk variants for SZ and other brain disorders using postmortem brain open chromatin data (DNase I hypersensitive sites [DHSs]) yield inconsistent findings (Schizophrenia Working Group of the Psychiatric Genomics Consortium, 2014; Handel et al., 2017). The lack of open chromatin profiles in appropriate cellular models has thus been a roadblock in interpreting functional noncoding sequences and GWAS risk variants for neuropsychiatric disorders.
Neuronal cells derived from human induced pluripotent stem cells (hiPSCs) have emerged as a promising cellular model for neuropsychiatric disorders (Panchision, 2016; Wen et al., 2016), providing an alternative to studying human brains. Compared with human brains and the emerging brain organoids model (Paşca et al., 2015; Rigamonti et al., 2016), iPSC-derived neurons are relatively homogeneous and useful for assaying developmental stage- and cell-type-specific phenotypic changes (Brennand et al., 2011; Wen et al., 2016). However, the genome-wide changes of open chromatin during neuronal differentiation from hiPSCs remain to be explored. Furthermore, whether neuronal OCRs can help prioritize functional noncoding risk variants of neuropsychiatric disorders has not yet been examined.
To functionally assess the relevance of noncoding sequences in neuropsychiatric disorders, we hypothesized that disease-relevant noncoding sequences likely overlap with cell-specific OCRs. Because SZ GWASs suggest a possible pathogenic role of impaired excitatory neurotransmission (Schizophrenia Working Group of the Psychiatric Genomics Consortium, 2014), we carried out global OCR profiling of excitatory neuronal differentiation from hiPSCs using the assay for transposase-accessible chromatin by sequencing (ATAC-seq) (Buenrostro et al., 2013). We found that OCRs were highly dynamic at different cellular stages of neuronal differentiation. We prioritized putatively functional SZ risk variants that may affect OCRs and, consequently, cellular development. At a leading SZ risk locus spanning MIR137, we narrowed down common GWAS risk variants to a single putatively functional SNP, rs1198588, in a neuronal OCR. We further carried out CRISPR/Cas9 editing of a SZ patient line containing MIR137 risk variants located in OCRs and showed that noncoding SZ risk variants are associated with lower MIR137 expression, altered OCR dynamics, and accelerated neuronal maturation. Our study suggests that OCR profiling in an hiPSC model of neuronal differentiation can predict functional noncoding sequences that regulate neurodevelopment, creating a resource that can help prioritize functional risk variants of SZ and other mental disorders.
Results
Global Open Chromatin Profiling of Neuronal Differentiation from hiPSCs Reveals Abundant Cell Stage-Specific OCRs
The dynamic changes of open chromatin during neuronal differentiation from hiPSCs may help identify functional noncoding sequences implicated in neuropsychiatric disorders, which has not yet been investigated. We used a previously described hiPSC line (GM01835) (Shi et al., 2014) for neuronal differentiation (Shi et al., 2012) after reconfirming its pluripotency (Figure 1A; Figures S1A–S2D). We achieved high efficiency of neural induction (∼100%, NESTIN+) (Figure 1A; Figure S1E and S1F), and obtained neurons (Ns) immunostained positively for TUBB3, MAP2, and VGLUT1 (SLC17A7) (Figure 1A). We mapped open chromatin by ATAC-seq in hiPSCs and neurons 27, 33, and 41 days after induction (N-d27, N-d33, and N-d41, respectively), obtaining ∼24 million paired-end (PE) sequencing reads per sample (Table S1). To assure the neuronal identity of the ATAC-seq data, we verified the cellular homogeneity of N-d41 by immunofluorescence (IF) staining of VGLUT1+/PSD-95+) (Figure S2A) and by single-cell gene expression analysis (Figures S2B and S2C). The clear periodicity of ∼200-bp DNA inserts of the PE reads (Figure 1B) represents the DNA fragments protected by the integer multiples of nucleosomes, and the periodicity of ∼10.5-bp peaks represents the helical pitch of DNA (Figure 1B, inset). We called open chromatin peaks by Hotspot (John et al., 2011), and estimated the correlation of ATAC-seq peak intensities between iPSCs, N-d27, N-d33, and N-d41 and compared them with ENCODE DHS data of fetal brain (FB) and ATAC-seq data of a lymphoblastoid cell line (LCL, GM12878) (Buenrostro et al., 2013; Figure 1C). As expected, the correlations were highest between replicates (independent cell cultures) (Pearson R = 0.83∼0.89). The OCR peak intensities clearly distinguished cell stages, with N-d27 and N-d33 showing higher correlation with N-d41 than with iPSCs and lowest correlation with LCLs (Figure 1C). Because of the high correlation between N-d27 and N-d33, we considered them replicates of a hypothetical cellular stage of N-d30 for simplicity.
Figure 1. Mapping Open Chromatin by ATAC-Seq in hiPSCs and Differentiated Neurons.
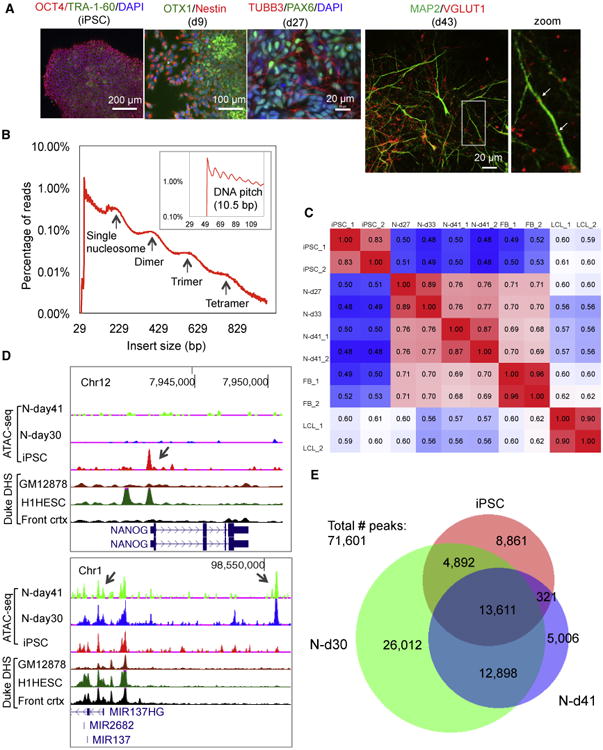
(A) Immunostaining of hiPSCs (OCT4+/TRA-1-60+), neural stem cells (NSCs, day 9; OTX1+/Nestin+), early-stage neurons (N-d27, day 27; TUBB3+/PAX6+), and more mature neurons (N-d43, day 43; MAP2+/VGLUT1+). The arrowheads in the zoom view of N-d43 (right) point to potential synaptic sites.
(B) The size distribution of DNA inserts of ATAC-seq PE reads (2 × 50 bp). Arrows mark the peaks corresponding to integer multiples of nucleosomes. The inset shows DNA pitch at a higher resolution.
(C) Heatmap of Pearson's correlations of ATAC-seq peak intensities between samples (iPSC_1 and its replicate iPSC_2, N-d27, N-d33, N-d41_1 and its replicate N-d41_2). Fetal brain DNase I hypersensitive site (DHS) data (FB_1 and FB_2, GSM595922 and GSM595923) were from ENCODE. Lymphoblastoid cell line data of GM12878 (LCL_1 and LCL_2) were from Buenrostro et al. (2013).
(D) ATAC-seq peaks for NANOG (top) and for the MIR137 locus (bottom) in comparison with ENCODE Duke DHS data (GM12878 is an LCL, H1HESC is a human embryonic stem cell [ESC] line, Front crtx is the prefrontal cortex).
(E) Venn diagram of the number of OCRs in iPSCs, N-d30, and N-d41.
At individual loci, we observed the expected OCR changes for cell stage-specific genes. OCRs upstream of the pluripotent stem cell markers NANOG and POU5F1 (OCT4) were completely inactive in N-d30 (Figure 1D; Figure S2D), whereas the cortical identity markers OTX1, FOXG1, and POU3F2 (Figure S2D) showed an increase in chromatin openness at their promoters in neurons. Interestingly, at a leading SZ risk locus spanning MIR137 (Schizophrenia Working Group of the Psychiatric Genomics Consortium, 2014), we observed neuronal OCRs absent in hiPSCs or in the brain frontal cortex (DHS peak of Duke ENCODE) (Figure 1D). To assess the global dynamic changes of OCRs during neural differentiation, we intersected the OCRs in hiPSCs, N-d30, and N-d41 and defined the union of nonintersecting peaks as the unique set of open chromatin peaks for comparison (n = 71,601). N-d30 had the most peaks (n = 57,413) and gained the most (89%) neural peaks (Figure 1E; Table S2), which is consistent with the reported enhancer dynamics during hematopoietic differentiation, where most de novo enhancers are formed in progenitor cells (Lara-Astiaso et al., 2014). Gene ontology (GO) enrichment analysis of the nearest genes of cell stage-specific OCRs showed a progressive switch of gene regulation from iPSCs to neurons (Table S3): the most enriched GO terms are embryonic morphogenesis for iPSC-specific peaks and cell adhesion, neuron differentiation, axonogenesis, and neuron projection for N-d41 peaks. The enrichments of neural GO terms (e.g., axon guidance, neuron migration, and synaptic neurotransmission) are ∼2-fold higher in N-d41 (versus N-d30) (Table S3), suggesting that N-d41 are more mature neurons. Our results thus indicate that changes of OCRs during neuronal differentiation are highly dynamic and correlate with cell stages.
To help infer functional noncoding sequences, we examined the genomic features of cell stage-specific or conserved OCRs. We found that ∼80% of iPSC- or N-specific peaks are distal (5–500 kb) to the transcription start site (TSS) (Figure 2A) and located in introns or intergenic sequences where enhancers and insulators reside (Figure 2B). In contrast, the peaks shared by iPSCs and neurons mostly (74.5%) cluster within 5 kb of the TSS (Figure 2A) and are overrepresented in core promoters near the TSS and their adjacent 5′ UTRs (Figure 2B). We also found that sequence tag intensity around the TSS (Figure 2C) showed an asymmetric distribution with fewer sequencing reads downstream of the TSS, which likely reflects the “footprints” of RNA polymerase II in the active transcription or “poised” state. These data suggest that OCRs at core promoters near the TSS are often constitutively accessible to DNA transcriptional machinery throughout neuronal differentiation, making a gene actively transcribed or in a poised state. In contrast, OCRs distal to the TSS are more instrumental for determining neuronal lineage and function and, thus, likely harbor cell type-specific functional noncoding sequences.
Figure 2. Genomic Features of Open Chromatin Peaks during Neuronal Differentiation.
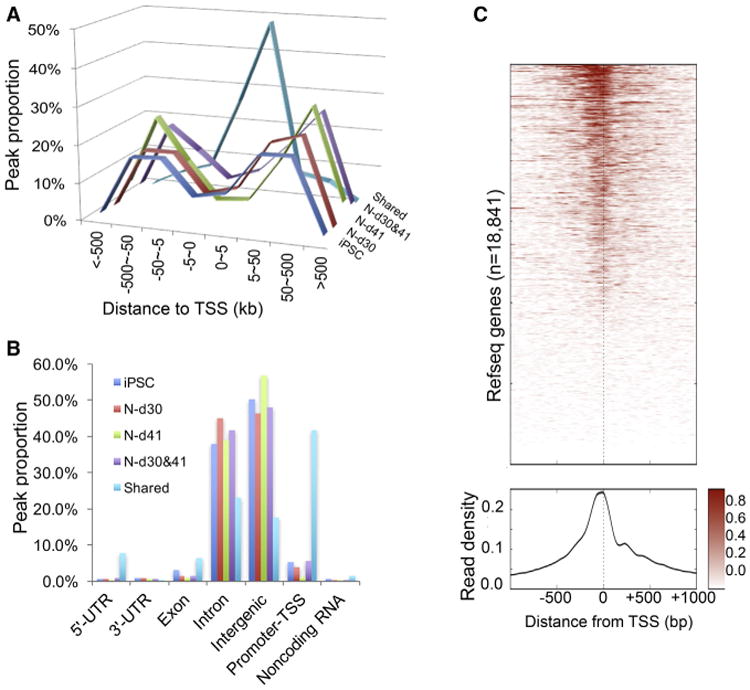
(A and B) Peak distances to the nearest transcriptional start site (TSS) (A) and proportion of open chromatin peaks (B) for each genic feature in hiPSCs, early-stage neurons (N-d30), more mature neurons (N-d41), both neuronal stages (N-d30&d41), and shared by all cell stages.
(C) Heatmap of ATAC-seq read intensity for each Refseq gene (top) and a plot of overall read density (bottom) around the TSS of core promoters (±1 kb) in N-d30. Color scale represents the ATAC-seq reads intensity.
Neuronal OCRs Are Enriched for SZ GWAS Risk Variants
Functional interpretation of noncoding disease risk variants is essential for unraveling causal mechanisms underlying the GWAS findings for complex disorders. Because chromatin accessibility to TFs strongly influences gene expression, we hypothesized that global OCR profiles in hiPSC-differentiated neurons would help prioritize functional noncoding risk variants for SZ. To test this hypothesis, we used a permutation approach to evaluate whether the 108 SZ GWAS risk loci indexed by 128 independent SNPs (r2 < 0.1) are significantly enriched in hotspots of OCRs of hiPSC-derived neurons (N-d30 and N-d41). We first calculated the number of SZ risk loci with either the index SNP or their proxy SNPs (r2 ≥ 0.8 with an index SNP; n = 3,507 SNPs for 125 non-X chromosome index SNPs; Table S4) that are within OCRs of iPSCs, N-d30, N-d41 (Table S2), and LCLs (Buenrostro et al., 2013). We then estimated the enrichment of SZ GWAS loci in OCRs by comparing them with 10,000 random sets of 125 index SNPs (matched for number of SNP proxies of each index SNP). We found a significant enrichment of SZ GWAS loci in OCRs of hiPSCs, N-d30, and N-d41 (empirical p < 0.05) but not LCLs, with the strongest enrichment (∼1.93-fold) in N-d41 (Figure 3A). The enrichment of SZ risk variants in neuronal OCRs suggests that analysis of open chromatin in neurons may help prioritize putatively functional noncoding risk variants for SZ and other brain disorders.
Figure 3. Enrichment and Prioritization of Putatively Functional SZ GWAS Risk Variants in Neuronal OCRs.
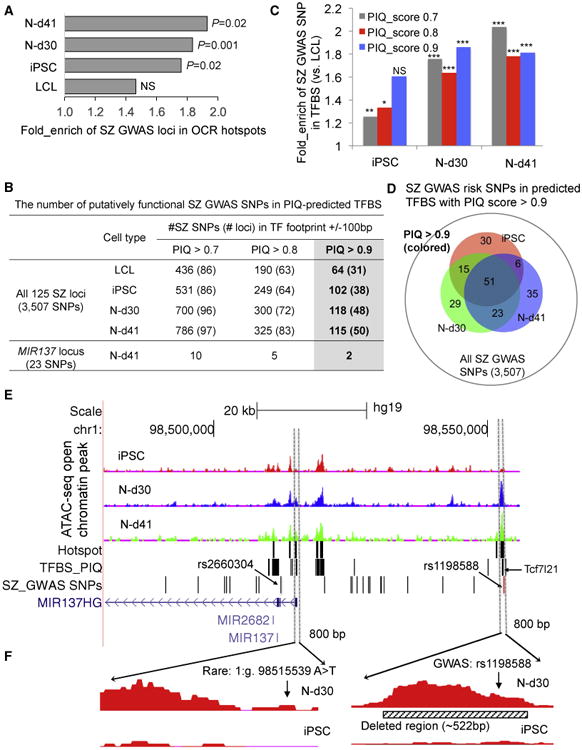
(A) Fold enrichment (over-representation) of SZ GWAS risk loci in OCR hotspots. The enrichment of the SZ risk loci was determined by comparison with 10,000 random sets of genomic loci each.
(B) Number of putatively functional SZ GWAS risk SNPs that are within the PIQ-inferred TFBSs. Listed are summary results for all 125 SZ GWAS loci with 3,507 risk SNPs.
(C) Enrichment of SZ GWAS risk SNPs in the PIQ-inferred TFBSs of OCRs in iPSC, N-d30, and N-d41.
(D) Venn diagram of the putatively functional SZ GWAS risk SNPs between cell types.
(E) Prioritization of putatively functional SZ GWAS SNPs at the MIR137 locus in neuronal OCRs. BedGraph tracks of ATAC-seq peak intensities in hiPSC, N-d30, and N-d41 (top) are displayed with custom tracks of OCR hotspots, PIQ-predicted TFBSs in N-d41, and SZGWAS risk SNPs (n = 23) in the University of California, Santa Cruz (UCSC) genome browser (hg19).
(F) The rare SZ risk variant 1:g.98515539A >T and the common GWAS risk SNP rs1198588 are in neuronal OCRs. Also shown is the deleted 522-bp OCR flanking rs1198588.
NS, not significant; *p < 0.05; **p < 0.01; ***p < 0.001 (Fisher's exact test). See also Tables S4, S5, and S6.
TF-Binding Footprints in Neuronal OCRs Help Prioritize Functional SZ GWAS Risk Variants
Because it is the accessibility of OCRs to TF binding that influences gene transcription (Degner et al., 2012; Thurman et al., 2012), we reasoned that physically occupied TFBSs (i.e., TF-binding footprints) in OCRs are more specific than a broader OCR in prioritizing putatively functional risk variants. We used a protein interaction quantification (PIQ) tool (Sherwood et al., 2014) to infer empirical TF-binding footprints from ATAC-seq data. We found that 1,356 of the 1,316 initially curated by PIQ and 45 non-overlapping chromatin immunoprecipitation sequencing (ChIP-seq) TFs from HOMER (Heinz et al., 2010) have more than one footprint in at least one cell type (PIQ purity score = 0.9, a confidence score), resulting in 2.1, 2.9, 2.2, and 2.1 million TFBSs for iPSCs, N-d30, N-d41, and LCLs, respectively (Table S5).
To prioritize the putatively functional SZ risk variants, we calculated the number of SZ GWAS risk index SNPs and their LD proxies (r2 ≥ 0.8) that fall within 100 bp of PIQ-predicted TFBS sequences, an interval where SNPs often affect TF occupancy (Reddy et al., 2012). We substantially narrowed down putatively functional SZ GWAS risk SNPs from the initial 3,507 SZ GWAS risk SNPs (Figure 3B; Table S6). With a PIQ score ≥ 0.9, the putatively functional SZ GWAS risk SNPs that fall within the inferred TFBS (±100 bp) of N-d41 were narrowed down to 115, representing 50 SZ risk loci. Overall, SZ GWAS risk SNPs are more enriched in PIQ-predicted TFBS of N-d30/41 cells than of iPSCs (Figure 3C), suggesting the pathophysiological relevance of studying N-d30/41. Although there was substantial overlap of putatively functional SZ variants between cell types, ∼30% of them were cell stage-specific (Figure 3D). At a PIQ score ≥0.9, 87 putatively functional SZ risk variants at 51 risk loci are located in TFBSs (± 100 bp) of N-d30 and/or N-d41 but not of iPSCs (Figure 3D; Table S6). These results show the utility of neuronal occupied TFBSs as a resource for functional follow-up of GWAS findings of SZ and other neurodevelopmental disorders.
Noncoding Risk Variants in Neuronal OCRs Affect MIR137 Expression at an SZ Risk Locus
The enrichment of SZ GWAS risk variants in neuronal OCRs and TFBSs suggests that the prioritized SZ risk variants within neural OCRs may affect adjacent gene expression. However, the functional effect of neural OCRs and common GWAS SNPs within them has not yet been evaluated in human neurons. To address this question, we focused on the MIR137 locus, one of the leading noncoding SZ GWAS risk loci. By intersecting the 23 equally associated SZ risk SNPs (Table S4) with occupied TFBSs in N-d41 or N-d30 OCRs, we narrowed down the putatively functional GWAS SNPs to rs1198588 and rs2660302, of which only rs1198588 is within a neuron-specific TFBS (for Tcf7l21) (Figures 3B and 3E; Table S6) ∼37 kb upstream of the MIR137HG TSS (Figures 3E and 3F). A known functional rare SZ risk variant (1:g.98515539A > T) (Duan et al., 2014) is also within a neuronal OCR proximal to the MIR137HG TSS (Figure 3F). We thus examined whether the prioritized SZ GWAS SNP rs1198588 has allelic effects consistent with the known functional rare variant 1:g.98515539A > T, using rs2660304 not in a neuron-specific OCR as a “negative” control (Figure 3E).
We hypothesized that examining the regulation of MIR137 expression upon genetic manipulation of OCRs, and their residing SZ risk variants, may shed light on the general mechanisms of cellular regulation by open chromatin. To ensure a genetic background on which a GWAS risk variant may exhibit detectable biological function, we carried out CRISPR/Cas9 editing (Ran et al., 2013) on an SZ patient iPSC line that carries the relatively penetrant rare risk variant 1:g.98515539A > T and is also homozygous for the GWAS SNP rs1198588 (SZ risk) (Figure 4A). We first “corrected” the rare risk allele (T), obtaining an isogenic hiPSC line homozygous for the non-risk allele (A/A) of 1:g.98515539A > T (denoted “Rare-corrected”) (Figure 4A). We then generated three isogenic lines to examine the functionality of rs1198588 (all with second independent CRISPR-edited clones), with rs2660304 as a negative control (Figure 4A): a line with both risk alleles of rs1198588 corrected to non-risk alleles (rs1198588-corrected; please note that the protospacer adjacent motif (PAM) sequence was mutated to avoid “recut” after allele editing; Figure 4B), a line heterozygous for the ∼522-bp deletion of the OCR flanking rs1198588 (i.e., with one risk allele deleted; denoted “rs1198588-OCpeak_del”; Figure 3F), and a line heterozygous for the rs2660304 risk allele correction (denoted “rs2660304-corrected”). All edited iPSC lines were confirmed to have the targeted allele edited (Figure 4B; Figures S3A-S3D) to be free of off-target editing at the top six predicted off-target sites (crispr.mit.edu; Table S7) and verified for pluripotency (Figure 4C; Figure S4).
Figure 4. Rare and Common SZ Risk Variants in Neuronal OCRs Affect MIR137 Expression.
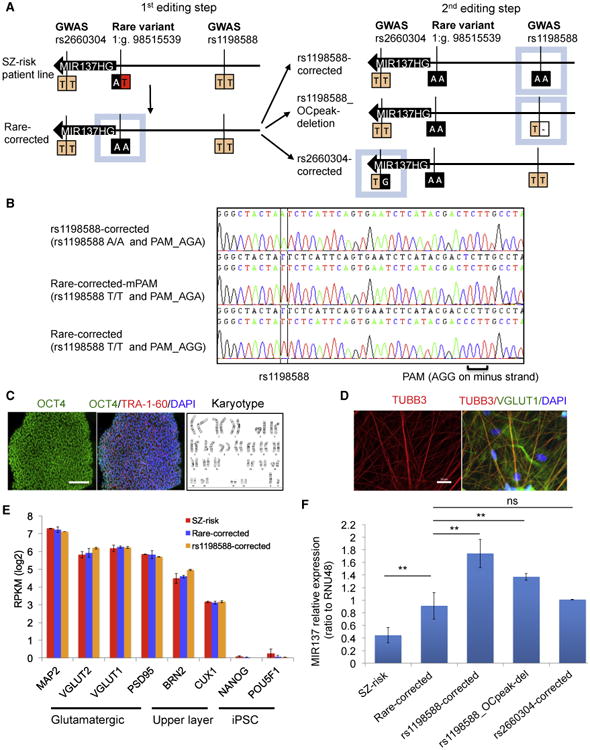
(A) Schematic of CRISPR/Cas9 editing of the common GWAS SNPs (orange, rs1198588 and rs2660304) and rare variant (red, 1:g.98515539A > T) at MIR137 locus. Risk alleles are depicted in orange or red and non-risk alleles in black. Isogenic iPSC lines were produced from an SZ patient line harboring all three risk alleles (SZ risk). rs2660304-corrected (TT → AA) served as a negative control because rs2660304 is not in a neuron-specific OCR peak (Figure 3F).
(B) Sanger sequencing confirmation of the risk allele correction (TT → AA) in rs1198588-corrected. The PAM sequence AGG (on the minus strand) was mutated to AGA to avoid the recuts by Cas9.
(C and D) Representative images of immunostaining and karyotyping of the isogenic iPSC lines (C) and NEUROG2-induced neurons (iNs) (TUBB3+ and VGLUT1+),
(D). Scale bar, 200 μm.
(E) iNs of the isogenic iPSC lines showed similar expression of MAP2, excitatory neuronal, and cortical upper layer markers (mean ± SD, n = 3 independent cultures).
(F) MIR137 expression in iN-d15 (mean ± SD, n = at least 3 independent cultures).
**p < 0.01 (two-sided Student's unpaired t test versus the Rare-corrected line). See also Figures S3–S6 and Table S7.
For downstream analysis of the functional effect of SZ risk variants, we elected to use the NEUROG2-induced neuronal method, which can rapidly generate a large quantity of excitatory induced neurons (iNs) of high purity (Patzke et al., 2016; Zhang et al., 2013; Figure S5A). We obtained excitatory iNs expressing TUBB3 and VGLUT1 within 3–4 weeks (Figure 4D; Figure S5A). The iNs showed similar expression of the transgene NEUROG2 (Figure S5B) and were largely excitatory neurons (VGLUT1+ and PSD95+) of upper-layer cortical identity (BRN2+ and CUX1+) with comparable cellular compositions between lines (Figure 4E; Figure S5C). We found that correcting the rare SZ risk allele T of 1:g.98515539A > T (SZ risk) to non-risk allele A (Rare-corrected) significantly increased the expression of MIR137 (Figure 4F; Figure S6A) but not the adjacent MIR2682 (Figure S6B). Consistent with the effect of the rare risk allele, the homozygous risk allele correction of the common rs1198588 (TT → AA: rs1198588-corrected) further increased MIR137 expression (Figure 4F), an effect that was not due to modifying the PAM sequence (Rare-corrected_mPAM) (Figure S6C). The heterozygous deletion of the open chromatin sequence flanking rs1198588 (rs1198588-OCpeak_del) showed an expression change that is expected for heterozygous rs1198588 (T/A) (Figure 4F). In contrast, the negative control rs2660304 (rs2660304-corrected) did not affect MIR137 expression (Figure 4F). The observed increase in MIR137 expression by SZ risk allele correction of both the rare variant and common rs1198588 was further confirmed in iNs of an independently CRISPR-edited hiPSC clone (second clone) for each variant (Figure S6C). Furthermore, the observed increase in expression of the mature MIR137 by SZ risk allele correction of both the rare variant and common GWAS SNP rs1198588 was consistent with the expression change of MIR137HS (host gene; i.e., at the pri-miRNA transcriptional level) (Figure S6D). Our results thus show that editing neural OCRs near MIR137 can affect MIR137 expression and that the SZ risk allele of the common GWAS SNP rs1198588 reduces MIR137 expression.
SZ Risk Variants Alter the Neuronal OCR of the MIR137 Promoter
To explore the molecular mechanism underlying the increased MIR137 expression by correcting SZ risk alleles, we examined whether editing both functional SNPs changed the chromatin accessibility at the MIR137 locus. We carried out ATAC-seq with iNs of the unedited line (SZ risk) and its isogenic lines with risk allele correction at 1:g.98515539A > T (Rare-corrected) and at rs1198588 (rs1198588-corrected) (Table S1; Figure 5A). Because the functional SNP prioritization was based on OCR profiles in neurons (N-d30 and N-d41) conventionally differentiated via neural stem cells (Figure 3E), whereas the functional assays were carried out in NEUROG2-induced iNs, we first examined whether the neuronal OCR profiles were comparable between the two different methods. A principal-component analysis (PCA) of the ATAC-seq read intensities showed that the global OCR profiles of iN-d15 were similar to that of N-d30 (Figure S6E). Although OCR peak patterns at some locations—e.g., MIR137 enhancer OCR (Figure S6F)—were slightly different between the two methods, they were overall very similar (Figures S6F and S6G), and such a minor difference in OCR pattern was not due to the local DNA sequences, as revealed by ATAC-seq. For both functional SNPs, we found that allelic editing did not change the global OCR profiles (Figure S6E); however, at the MIR137 locus, risk allele correction of 1:g.98515539A > T and rs1198588 altered the promoter/TSS OCRs flanking 1:g.98515539A >T (Figures 5A and 5B; for both clones). Further quantification of ATAC-seq reads in OCRs revealed that correcting the risk allele of 1:g.98515539A > T increased the OCR accessibility only upstream of MIR137HG TSS (∼500 bp) (Figure 5C). In contrast, risk allele correction of the common rs1198588 showed an ∼3-fold increase of the chromatin accessibility of the OCR (∼1 kb) flanking the promoter of MIR137HG (Figures 5B and 5C) without changing the local OCR flanking rs1198588 (Figure 5D). These results suggest that SZ risk alleles of both the rare and common SZ risk SNPs at the MIR137 locus reduced the chromatin openness of the promoter OCR, contributing to decreased MIR137 expression by SZ risk alleles.
Figure 5. Correcting SZ Risk Variants Alters Neuronal OCRs Flanking the MIR137 Promoter.

(A) Patterns of OCR ATAC-seq peaks at the MIR137 locus in iN-d15 of isogenic iPSC lines (two independent clones are shown for the Rare-corrected and rs1198588-corrected lines).
(B–D) The two 1-kb OCRs (between vertical dashed lines) flanking the rare (left) and the common (right) SZ risk variants, respectively, are examined in a zoomed view (B) and subject for quantification (C and D). Correcting both the rare variant and the common rs1198588 increased the peak area of the promoter OCR (C) but did not change the OCR flanking rs1198588 (D).
Data are presented as mean ± SEM of the OCR ATAC-seq reads. *p < 0.05 and **p < 0.01 are from two-sided Student's unpaired t test.
SZ-Risk Variants in Neuronal OCRs of MIR137 Affect Dendritic Complexity and Synapse Maturation
The functional effect of noncoding risk variants on the development of human neurons has not yet been examined. We therefore assayed the effects of the functional rare and common SZ risk variants near MIR137 on neurodevelopmental phenotypes relevant to psychiatric disorders in excitatory iNs. Alterations in neuronal dendrites are associated with a wide range of neuropsychiatric conditions (Kulkarni and Firestein, 2012). To evaluate the effects of each risk variant on dendritic complexity, we sparsely transfected iNs on day 28 (iN-d28) with GFP to unambiguously visualize their dendritic morphology (Figure 6A). We measured dendritic arbors using Sholl analysis. We also analyzed small dendritic protrusions (<15 μm long) to distinguish them from dendritic branches because dendrites carry both filopodia and spines that may receive synaptic input at early developmental stages (Portera-Cailliau et al., 2003). We first confirmed that there was no significant difference in dendritic morphology or protrusion density between iNs generated from two individual hiPSC clones of each line (Figures S7A–S7D). We found that dendrites from Rare-corrected iNs were significantly less branched than SZ risk iNs in Sholl analysis (Figure 6B). The Rare-corrected iNs showed an ∼18% decrease in total dendrite length (Figure 6C), indicating that the rare SZ risk allele is associated with increased neuronal complexity, although it has no effect on protrusion density (Figure 6D). For the common SNP rs1198588, we found that the risk allele correction significantly reduced branching of iNs (Figure 6E). The reduction in complexity was most pronounced at a distance of 80–140 μm from the soma (Figure 6E). The total dendritic length was reduced by ∼30% in rs1198588-corrected iNs, independently confirming the Sholl analysis data and demonstrating that the common SZ risk variant rs1198588 is also associated with increased dendritic complexity (Figure 6F). Like the rare variant, correction of rs1198588 had no effect on spine density (Figure 6G). Interestingly, a heterozygous deletion of the OCR flanking rs1198588 also reduced dendritic branching compared with the Rare-corrected iNs, further suggesting a critical role of rs1198588 at this locus (Figures S7E–S7G). These results indicate that both the common and the rare risk variants, located in neuronal OCRs of the MIR137 locus, have consistent effects on the dendritic development of human iNs.
Figure 6. Noncoding Schizophrenia Risk Variants Near MIR137 Alter Dendritic Complexity.
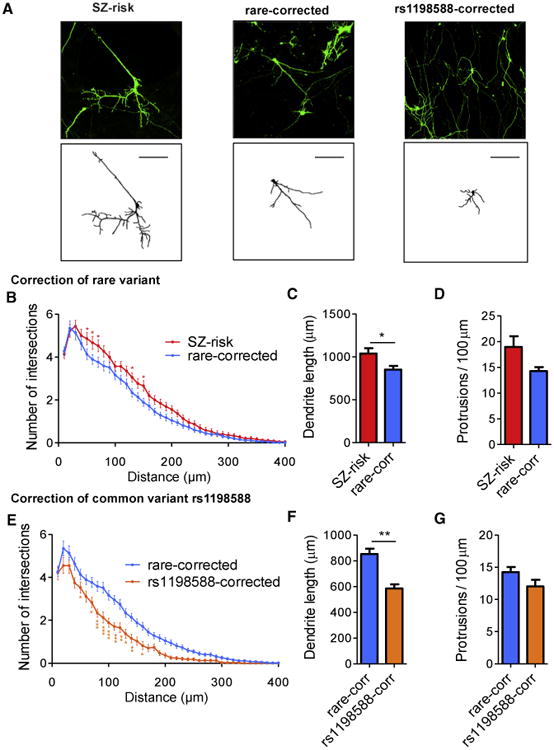
(A) Representative confocal images of GFP-transfected iN-d30 for SZ risk, Rare-corrected, and rs1198588-corrected lines (top) and their corresponding binary traces used for analysis of dendritic complexity (bottom). Scale bar, 100 μm.,
(B–D) Comparison of SZ risk (n = 70) and Rare-corrected neurons (n = 131).
(B) Sholl analysis of total dendritic branching shows a significant genotype-by-distance interaction (p = 0.009) on dendritic branching.
(C and D) Rare-corrected iNs have reduced total dendrite length (p = 0.004) but no difference in protrusion density (D) compared with SZ risk iNs.
(E–G) Comparison of Rare-corrected (n = 131) and rs1198588-corrected iNs (n = 38).
(E) Sholl analysis of total dendritic branching shows a significant genotype-by-distance interaction (p < 0.0001) on dendritic branching.
(F and G) rs1198588-corrected neurons have reduced total dendrite length (F, p = 0.001) but no difference in protrusion density (G) compared with Rare-corrected neurons.
All values represent mean ± SEM. Individual comparisons that were significant after multiple-test correction (for Sholl) or Student's t test are indicated: *p < 0.05, **p < 0.01, ***p < 0.001. See also Figure S7.
Glutamatergic synapses are the main excitatory synapses in the brain and have been implicated in the pathophysiology of psychiatric disorders (Volk et al., 2015). To determine whether the editing of SZ-relevant MIR137 variants can affect glutamatergic synapse development, we immunostained GFP-transfected iNs with PSD-95 (a postsynaptic scaffolding protein) and GluA1 (a subunit of the α-amino-3-hydroxy-5-methyl-4-isoxazolepropionic acid [AMPA]-type glutamate receptor) because both accumulate in mature glutamatergic synapses (Meyer et al., 2014). We found that both markers formed characteristic puncta on dendrites and in dendritic protrusions of human iNs (Figure 7A). We measured the total mean fluorescence intensity of GluA1 and PSD-95 in dendrites to assess the total expression level of each protein. We then quantified the density of protrusions containing either GluA1 (GluA1+), PSD-95 (PSD-95+), or both proteins co-localized (GluA1+/PSD-95+) along dendritic branches. We found no differences in total protein expression of GluA1 or PSD-95 after rare variant correction; however, Rare-corrected iNs had a trend of reduced levels of GluA1+ and PSD-95+ protrusions compared with SZ risk iNs (p = 0.081 and 0.051 for GluA1+ and PSD95+, respectively; Figures 7B and 7C). Similarly, for the common rs1198588, although correcting the risk allele had no effect on the total expression level of GluA1 or PSD-95, rs1198588-corrected iNs showed a marked decrease in GluA1+ (p = 0.027) and GluA1+/PSD-95+ (p = 0.038) protrusions but not PSD-95+ only protrusions (Figures 7D and 7E). Our analysis of synaptic proteins indicates that SZ risk variants at the MIR137 locus can affect the maturation of glutamatergic synapses and that protrusions containing the AMPA receptor subunit GluA1 may be particularly sensitive to alterations of MIR137. Together, these results suggest that noncoding SZ-risk variants in neuronal OCRs can alter dendritic complexity and glutamatergic synapse development in human iNs.
Figure 7. Schizophrenia Risk Variants in Open Chromatin Regions Near MIR137 Affect the Maturity of Dendritic Protrusions.
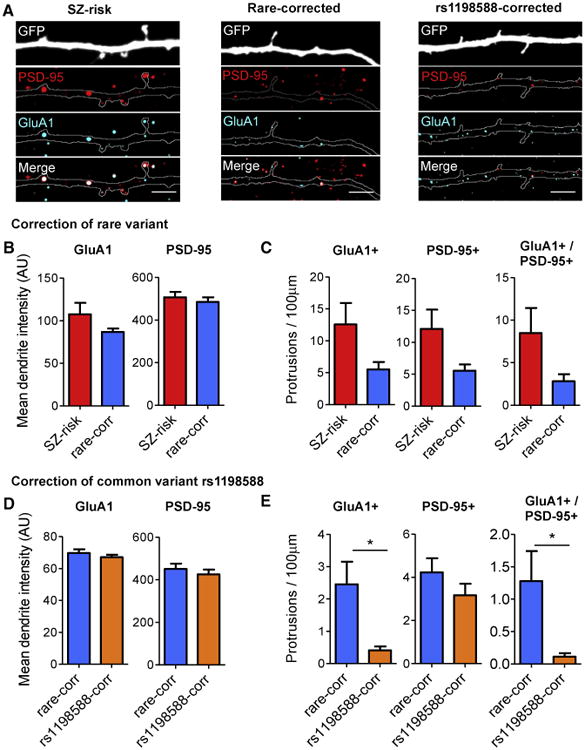
(A) Composite confocal images of dendrites from GFP-transfected induced neurons (iN-d30) immunostained for PSD-95 and GluA1 in SZ risk, Rare-corrected, and rs1198588-corrected lines. Shown are the images used for the protrusion density analysis.
(B and C) Comparison of SZ risk (n = 20) and Rare-corrected iNs (n = 20).
(D and E) Comparison of Rare-corrected (n = 37) and rs1198588-corrected iNs (n = 38).
(B and D) Abundance of GluA1 (left) and PSD-95 (right) in dendrites measured by mean fluorescence intensity.
(C and E) Density of protrusions containing GluA1 (left), PSD-95 (center), or GluA1 and PSD-95 (right) co-localized.
All values represent the mean ± SEM. Comparisons that were significant after Student's t test are indicated. *p < 0.05. See also Figure S7.
Discussion
The dynamic change in chromatin state during neuronal differentiation from hiPSCs and the neurodevelopmental effect of altering functional OCRs have not yet been examined. To this end, we carried out global OCR profiling by ATAC-seq during neuronal differentiation of hiPSCs and demonstrated that neural OCRs flanking TF-binding footprints can help prioritize putatively functional noncoding SZ GWAS risk variants. At an SZ risk locus spanning MIR137, we narrowed down the putatively functional GWAS risk variants to a single SNP, rs1198588, and, for the first time by using a patient-specific iPSC model, we have shown that precisely correcting the risk allele of a common SZ GWAS non-coding risk variant can alter neuronal OCR and, subsequently, affect gene expression and neurodevelopmental phenotypes. Our study shows that OCRs and noncoding disease risk variants within them likely affect key steps of neurodevelopment.
Neuronal OCR Profiles Help Prioritize Functional Noncoding SZ Risk Variants
Open chromatin profiling in a disease-relevant cellular model can facilitate the functional interpretation of noncoding GWAS risk variants for neuropsychiatric disorders. We have examined the dynamic changes of OCRs during hiPSC differentiation into relatively homogeneous excitatory neurons (Figures S2A–S2C). We found that neuronal OCRs and TFBSs are enriched for SZ GWAS risk variants and help to significantly narrow down the number of putatively functional GWAS risk variants. The identified OCRs cover 53%–66% reference sequence (Refseq) genes in iPSCs, N-d30, and N-d41 (n = 15,336, 18,038, and 14,550 genes, respectively; Table S2). Compared with OCRs, PIQ-inferred neuronal TFBSs showed higher enrichment of SZ GWAS risk variants (Figure 3C), suggesting that neuronal TFBSs are more specific or disease-relevant than OCRs for prioritizing the putatively functional noncoding SZ risk variants. With PIQ-inferred TFBSs, we substantially narrowed down the putatively functional SZ GWAS risk variants for 50–97 SZ loci (Figure 3B; Table S6). Because OCR profiles in hiPSC-derived excitatory neurons were found to be similar between different individuals and neuronal differentiation methods in our global OCR profiles (Figures S6E–S6G), although they are generated from a single subject, they are expected to be representative and a valuable resource for prioritizing putatively functional SZ risk variants.
Functional Effect of SZ Risk SNPs within the MIR137 OCR on Its Expression
The functional effect of OCRs and their associated risk variants are not well understood. Using hiPSC-derived neuronal cells of an SZ patient as a cellular model, we generated CRISPR-edited isogenic lines that differ only at the edited site and showed that neuronal OCRs of MIR137 and SZ risk SNPs within them altered MIR137 expression (Figure 4F). We confirmed that the known functional rare SZ risk variant 1:g.98515539A > T (Duan et al., 2014) within an OCR reduced MIR137 expression in iNs. More importantly, we have shown that the risk allele of a putatively functional SZ GWAS SNP rs1198588 with a neuronal OCR also reduced MIR137 expression. This is the first demonstration of the effect of a noncoding SZ GWAS risk variant on adjacent gene expression through directly “rescuing” the risk allele in human neurons of an SZ patient. The observed directional effect of the SZ risk allele on MIR137 expression is consistent with the reported association of the risk allele (i.e., major allele) of SZ GWAS SNP rs1198588 with lower MIR137 expression in postmortem brains (Guella et al., 2013) and in human fibroblast-derived neurons (Siegert et al., 2015). As revealed by our ATAC-seq experiment in iNs before and after risk allele editing (Figure 5), the functional SZ risk variants affect MIR137 expression likely through altering the MIR137 promoter OCR, although the involved TFs in the OCRs flanking the functional SZ risk variants remain to be empirically identified.
Neuronal OCRs and SZ Risk SNPs Affect Glutamatergic Neuronal Development
We found that editing neuronal OCRs and SZ risk variants within them had a significant effect on neurodevelopmental phenotypes like dendritic arborization and synaptic protein accumulation in dendritic protrusions. Both the rare risk variant and the common GWAS-implicated SNP in MIR137 OCRs were associated with an increased level of maturity of the dendritic arbor and protrusions, suggesting altered developmental trajectories. Importantly, the observed morphological alterations were closely correlated with MIR137 expression. The SZ risk iNs with both risk alleles, which also had the lowest MIR137 expression, showed the most mature neuronal phenotypes. Conversely, the rs1198588-corrected line, where both risk alleles had been corrected, had the highest MIR137 expression and displayed an underdeveloped morphology. Such correlation suggests that the phenotypic effects were most likely driven by MIR137 expression. MIR137 has more than 1,000 predicted target genes that are enriched for pathways related to synaptic function (Wright et al., 2013). For GRIA1, an empirically validated MIR137 target (Olde Loohuis et al., 2015), although we could not detect global changes of its protein between isogenic lines by immunofluorescence (Figures 7B and 7D), we observed decreased GluA1 in dendritic protrusions in the rs1198588-corrected line that had the highest expression of MIR137. The observed inverse correlation of GluA1+ dendritic protrusions and MIR137 expression is consistent with a model in which MIR137 may play a more local role in inhibiting synaptic protein production (Schratt et al., 2006; Siegel et al., 2009). Our result is also in agreement with previous studies in mouse neurons showing that MIR137 expression is negatively correlated with dendritic complexity (Edbauer et al., 2010; Smrt et al., 2010) and that reduced MIR137 expression causes premature maturation of α-amino-3-hydroxy-5-methyl-4-isoxazolepropionic acid receptor (AMPAR)-containing synapses (Olde Loohuis et al., 2015). At the mRNA level, except for GRIA1, we did not observe a negative correlation of MIR137 expression with any of the 8 synaptic genes predicted to be targeted by MIR137 (Figure S6D), including CPLX1, NSF, SYN3, and SYT1, that were shown to be MIR137 targets by reporter gene assay (Siegert et al., 2015). Although MIR137 may still regulate these synaptic genes at the protein level, we noted a reported lack of correlation between MIR137 expression and its predicted target genes in neuronal stem cells (NSCs) and neurons (Topol et al., 2016). Taken together, the observed phenotypic changes associated with SZ risk alleles at MIR137 may predict an increase in the neuronal receptive field, potentially altering the amount of synaptic input each neuron receives. This phenomenon would suggest that disease variants within neural OCRs could impair the cellular substrates of synaptic circuits that may alter the neurodevelopmental trajectory.
Implications for Neuropsychiatric Disorders
Like other complex disorders, most disease risk variants for neuropsychiatric disorders are in noncoding sequences for which functionality is normally difficult to interpret. Given the significant enrichment of SZ GWAS risk variants in neuronal OCRs flanking TFBSs (Figures 3A–3C) and the demonstrated functional effects of SZ risk variants in neuronal OCRs, our study provides a prototype for prioritizing and characterizing functional noncoding variants of SZ risk loci. Moreover, with more disease loci being identified under the framework of the Psychiatric Genomics Consortium (PGC) (Corvin and Sullivan, 2016), our global open chromatin profiles of iPSC-derived neurons may be a resource for inferring functional noncoding variants for other neuropsychiatric disorders. Compared with GWAS risk variants, the global OCR profiles may have limited implications for copy-number variants (CNVs) and de novo mutations because they are very rare and often with obvious functional effect; e.g., disrupting protein coding sequences (Marshall et al., 2017; Li et al., 2016). However, the neuronal OCR profiles would still be useful for interpreting CNVs and de novo mutations located in noncoding sequences. Like at the MIR137 locus, disease risk variants within OCRs could affect adjacent gene expression and, in turn, affect neurodevelopmental phenotypes.
We noted that the observed increase of dendritic complexity by SZ risk alleles seems inconsistent with cellular phenotypes of SZ postmortem brains (Konopaske et al., 2014). Although most postmortem SZ studies have reported reduced dendrite arborization and spine density, some studies have noted increased synapse density and dendritic MAP2 staining in specific brain regions (Cotter et al., 2000; Roberts et al., 2008). In addition, cultured pyramidal neurons from mice with the SZ-associated 16p11.2 duplication show increased dendritic branching, and knockdown of DISC1 (Disrupted In Schizophrenia 1) causes increases in dendritic development in the mouse hippocampus (Blizinsky et al., 2016; Duan et al., 2007). On the other hand, analysis of dendritic morphology in developing human neurons from SZ patients is still nascent (Seshadri et al., 2017). Interestingly, overexpression of miR-34a, a micro-RNA (miRNA) elevated in bipolar disorder, also increases dendrite complexity in developing human neurons (Bavamian et al., 2015). Thus, studying neurons from patients will likely yield new insights into disease progression and complement postmortem study by exploring the early stages of illness. Finally, it is noteworthy that our observed cellular phenotypes were confirmed in independently edited isogenic lines and are highly congruent with the reported neurodevelopmental effects of MIR137 in mice. In addition, both the common GWAS and rare SZ risk variant showed consistent effects on MIR137 expression, OCR, and neuronal phenotypes. Nonetheless, we acknowledge the limitation of our observation because it was assayed in iNs of a single SZ subject. Future replication in a larger sample is likely needed to firmly establish the relevance of the observed phenotypes to SZ.
In summary, we have provided insight into the epigenetic control of human neuronal differentiation and demonstrated the functional effect of OCRs at the MIR137 SZ risk locus in patient-derived iPSC-neurons, suggesting that neuronal OCRs and the noncoding disease variants within them may regulate key steps of neurodevelopment. Given that the number of patient samples used in our study is a major limitation, the link of the observed neuronal phenotype changes with SZ remains uncertain. Nonetheless, our study shows that neuronal OCR profiles can help prioritize and characterize functional SZ risk variants, providing a foundation for dissecting the molecular basis of SZ and other neuropsychiatric disorders.
Star★Methods
Contact for Reagent and Resource Sharing
Further information and requests for resources and reagents should be directed to and will be fulfilled by the Lead Contact, Jubao Duan (jduan@uchicago.edu)
Experimental Model and Subject Details
hiPSC lines and cell culture
The hiPSC line used in OCR mapping was derived from fibroblasts of a 27 year-old female who was hospitalized for drug abuse and schizoaffective disorder (GM01835; from Coriell) as previously described (Shi et al., 2014). The hiPSC line used in CRISPR/Cas9 editing for genetic perturbation at the MIR137 locus was derived at Rutgers University Cell and DNA Repository (RUCDR)-NIMH Stem Cell Center from cryopreserved lymphocytes (CPLs) of a 37 year-old male SZ patient (cell ID: 06C60621) from the MGS collection (Shi et al., 2009). The study subject is of European ancestry and was diagnosed with chronic SZ of 21 years duration, with an age at onset of 18 years old, but had no known family history of psychosis. His primary “criterion A” symptoms were delusions of reference, visual hallucinations, and deficit symptoms, and his course of illness was continuously positive (i.e., never in remission). He completed part of high school, was never married, did not work due to illness, and was rated as severely deteriorated functionally. His medical history was unremarkable, and he was a daily tobacco smoker. He carried additional psychiatric diagnoses of cannabis dependence and alcohol abuse. The hiPSC line was generated by using Sendai virus method to assure its being integration-free. We have selected the subject without large SZ-risk CNVs (Levinson et al., 2011) to avoid any confounding effect. The NorthShore University HealthSystem Institutional Review Board (IRB) approved the study.
hiPSCs were cultured using feeder-free method on geltrex (Thermofisher)-coated plate in mTeSR1 media (StemCell). Media were changed daily and cells were passaged as single cells every 4-6 days using accutase (Thermofisher) in mTeSR1 in the presence of 5 μM ROCK inhibitor (R&D Systems).
Method Details
hiPSC karyotyping and other characterizations
The unedited and edited hiPSC lines were all subjected to G-band Karyotyping (Figure S4), which was performed and interpreted by specialists at WiCell Cytogenetics Lab as a service. As part of quality control of hiPSC, we also examined: (1) positive immunofluorescence (IF) staining of pluripotent stem cell markers OCT4, TRA-1-60, NANOG, SSEA4 (Figure S1A and Figure S4), following the procedures in section “Immunocytochemistry”; (2) transcriptome profiling (using Illumina HT-12v4 array) followed by PluriTest assay (http://www.pluritest.org) to replace the time-consuming and costly teratoma assay to test for full pluripotency (Figures S1C and S1D). We have confirmed that the expressions of pluripotent markers (SOX2, OCT4, NANOG, and DNMT3B) are similar to that of the control hES (H7) (Figure S1D).
Genotyping was analyzed using Sanger sequencing. Genomic DNAs from iPSCs were isolated using DNeasy Blood & Tissue Kit (QIAGEN) following vendor's instructions. Primers were designed to amplify the region containing the targeted position using genomic DNAs as templates. PCR products were used in sequencing reaction with BigDye terminator v3.1 Cycle Sequencing Kit (Thermofisher) and then sequenced on 3730 DNA Analyzer (Applied Biosystems).
Cortical neuronal differentiation from hiPSCs
We have followed the protocol (Shi et al., 2012) with minor modifications to fit our hiPSCs growing in mTeSR. Specifically, we plated 5 wells of iPSCs (on a 6-well plate) onto one well of Geltrex (Thermofisher)-coated 12-well plate in mTeSR media, allowing cells to attach overnight and reaching ∼100% confluence 1 day after plating. For neural induction, we switched the cell culture media to neural induction media (NIM) containing 1 μM Dorsomorphin and 10 μM SB431542. After 10 days of neural induction when a homogeneous neuroepithelial layer was formed, we passaged the cells onto laminin-coated 35-mm dish and switched the cell culture media to Neural Maintenance Medium (NMM). Upon appearance of neural rosettes, we added 20 ng/ml of FGF2 for 2-4 days to promote the expansion of neural stem cells (NSCs). At about day 20 after neural induction, we passaged the cells for the first NSC expansion (1:3). After another round of NSC expansion at day 25, we passaged the NSC culture at ∼day 30 using Accutase at 50,000 cells per cm2 onto laminin-coated 35-mm dish (for collecting cells for ATAC-seq later) and laminin-coated coverslips (for immunofluorescence staining). We continued the neural differentiation for the plated cells in NMM until the specified days to collect the cells for ATAC-seq or RNA-seq.
Single neuron gene expression
Single neuron gene expression analysis was used to estimate cellular homogeneity of glutamatergic N-d41. The cytoplasm of single cells in N-d41 culture (regularly differentiated from hiPSC) was aspirated using patch pipettes (Figure S2B) and reverse transcribed with CellsDirect One-Step qRT-PCR Kit (Thermofisher). TaqMan qPCR assays from IDT and/or Thermofisher include: glutamatergic markers VGLUT1 and VGLUT2, excitatory marker PSD95, cortical identity marker BRN2, GABAergic marker VGAT, dopaminergic markers TH and PITX3, pan neuronal marker MAP2, and housekeeping gene GAPDH. Two VGLUT1 assays, one from IDT and one from ThermoFisher (formerly ABI), were used to detect different exons. We followed the standard single cell expression analysis protocol for Fluidigm Biomark Gene Expression 48.48 IFC. All the assays were in triplicates on two Fluidigm 48×48 expression arrays each including two positive controls (total RNAs from NEUROG2-induced glutamatergic neurons; iN-d15) and one negative control (water). Gene expression level was shown as heatmap of color-coded Ct (Figure S2C) using Fluidigm Real-time PCR Analysis software. A total of 77 neurons expressing both GAPDH and MAP2 were included in the final analysis. 37 out of 77 neurons (48%) were found to be glutamatergic (VGLUT1+ and/or VGLUT2+), and almost no TH+ or VGAT+ neurons were found. Although the percentage of glutamatergic neurons in single neuron expression analysis was lower than in IF staining (>80% VGLUT1+), the fact of almost no TH+ or VGAT+ neurons suggests that these neurons may be in a less mature stage en route to glutamatergic neurons. The lower percentage of glutamatergic neurons in single cell expression analysis could also be due to the limited sensitivity of TaqMan assay in single cells. Alternatively, some mRNA copies of VGLUT1/VGLUT2 may have been transported away from the soma that was picked up for expression analysis, which resulted in low or no detectable expression of VGLUT1/VGLUT2 in some neurons.
Sample preparation and ATAC-seq
For ATAC-seq, we harvested ∼50,000 cells by centrifugation at 500 g × 5 min at 4°C. We washed cells once with PBS buffer and resuspended the cell pellets in 50 μL of cold lysis buffer (10 mM Tris-HCl, pH7.4, 10 mM NaCl, 3 mM MgCl2, 0.1% IGEPAL CA-630). We collected cell pellets, discarded the supernatants, and immediately continued to transposition reaction in 50 μL transposition reaction mix. We incubated the transposition reaction at 37°C for 30 min, immediately followed by purification through a QIAGEN MinElute Kit. We stored the purified DNAs at −20°C until generating sequencing library.
The library was generated and sequenced at University of Minnesota Genomic Center. We have followed the protocol as previously described (Buenrostro et al., 2013) with minor modifications: (1) using the standard Nextera primer set for PCR amplification of the transposed DNA fragments, (2) monitoring qPCR reaction to determine the number of additional cycles for full PCR amplification, and (3) using Agilent High Sensitivity DNA chip for library size validation. Specifically, we thawed the transposed and purified DNAs and carried out an initial 5-cycle PCR (1 cycle: 72°C for 5 min; 1 cycle: 98°C for 30 s; then 5 cycles: 98°C for 10 s, 63°C for 30 s, 72°C for 1 min) in a 50 μL of reaction including NEBNext High Fidelity 2× Master mix and 5 μL of 25 μM Forward/Reverse ATAC-seq index, i.e., standard barcoded primers of Nextera kit (FC-121-1030), for each sample. We then used qPCR to determine the number of additional cycles of PCR amplification that were required, by using the cycle number that corresponds to 1/3 of the maximum fluorescent intensity (typically +5, +6, +7) shown on real-time PCR plots on ABI7900 (Applied Biosystems). After the reactions were subjected to additional PCR cycles, we purified each sample with SPRI beads and eluted the PCR products in 12 μL elution buffer. We checked the DNA library by picogreen quantification and the size of the fragments with an Agilent High Sensitivity DNA chip (the library should be sized between 200-700 bp). Libraries were diluted to 2 nM and pooled for downstream sequencing. For the initial OCR profiling, we pooled all the 6 libraries (2 for iPSC, 1 for N-d27, 1 for N-d33, and 2 for N-d41) and sequenced on a HiSeq 2500 using a PE2×50bp flow cell in a single sequencing lane. For the additional ATAC-seq on the unedited and edited iNs, we followed the same procedures as described above. We achieved > 120 million passing-filter reads for the lane and the average quality scores for all libraries are all above Q30 for both R1 and R2.
ATAC-seq reads processing and alignment
ATAC-seq raw reads were trimmed for adapters by Trimmomatic (Bolger et al., 2014) with the following parameters: ILLUMINACLIP: NexteraPE-PE.fa:2:30:7, SLIDINGWINDOW:3:18, MINLENGTH:26. The paired end reads were aligned to hg19 with Bowtie(Langmead et al., 2009) with the following options −m 1, -X 2000 and –chunkmbs 2000. We removed duplicate reads using Picard function “MarkDuplicates.” By using these parameters, we aimed to assure the fragments up to 2 kb were allowed to align (-X 2000) and to obtain uniquely mapped reads (−m1). To obtain the metrics of the insert size of PE reads, we used “CollectInsertSizeMetrics” command of picard tools. To maximize the number of reads that can be mapped to the genome, the unmapped reads from the paired end mapping were remapped as single ends with only the −m 1 flag. For some of the unmapped PE reads that partially overlap but can be merged by Trimmomatic, we also mapped the merged reads (i.e, stitched pairs) to hg19 with the −m 1 flag. The mapped reads from each process were summarized in Table S1. The combined aligned reads were used for hotspot analysis. For footprint analysis by Protein Interaction Quantification (PIQ) tool(Sherwood et al., 2014), we only used the mapped reads from PE read mapping (PIQ does not accept the mixed types of PE reads and single reads), which accounted for > 80% of the total mapped reads.
ATAC-seq peak-calling
We used Hotspot(John et al., 2011) to call open chromatin peaks for each ATAC-seq sample (2 for iPSC, 1 for N-d27, 1 for N-d33, and 2 for N-d41). The same peak-calling pipeline was also applied to the ENCODE fetal brain (FB) DNase-seq data (DNase hypersensitivesite; DHS) downloaded from ENCODE (GSM595922 and GSM595923 as replicates) and a previously reported ATAC-seq dataset of a lymphoblastoid cell line (LCL; GM12878; with two replicates) (Buenrostro et al., 2013). Hotspot analysis was run for each sample to identify regions of enriched sequence tags. We used the 50bp genome mappability file (hg19) downloaded from http://www.uwencode.org/proj/hotspot/. For defining a hotspot (peak) size, we have used a minimum window size of 100 bp and maximum window size of 300 bp. Hotspot calculates the enrichment of sequence tags along the genome in the defined small window relative to a local background model based on the binomial distribution and using the observed tags in a 50-kb surrounding window as a background, and the false discovery rate (FDR) of 5% was used as a cut-off for calling a peak (Buenrostro et al., 2013). The resulting hot-spots were merged if the overlap is > 75 bp. To obtain a unique list of peaks, the called hotspots in each sample were intersected between replicates, and we only kept the overlapping hotspots between replicates. The intersected hotspots were merged together if the overlap is more than 75 bp, giving a final list of unique peaks that can be compared between different samples and cell stages. We used BEDOPS v2.4.15 (Neph et al., 2012) to make a bedgraph (20 bp bins with 150 bp window) for visualizing open chromatin peaks in UCSC genome browser.
ATAC-seq tag intensity around TSS
The Refseq gene annotation (hg19) was downloaded from UCSC genome browser. The gene features were extracted into a database with Python package Gffutils. TSS features of all the Refseq genes were then extracted using pybedtools with ± 1 kb around TSS. Aligned reads of ATAC-seq data were imported into python package Metaseq and were binned in the ± 1 kb window and normalized by read counts (reads/million). We plotted the average of normalized read counts over the ± 1 kb window around all the TSS sites (Figure 2C).
SZ GWAS risk loci enrichment in OCRs
We used a permutation approach to evaluate whether the 108 SZ GWAS risk loci indexed by the 128 independent SNPs (r2 < 0.1 between) (only 125 non-sex chromosomal index SNPs were used) are enriched in hotspots of OCRs in hiPSCs and neurons (N-d30 and N-41). We first intersected the number of SZ risk loci that have either the index SNP or their SNP proxies (r2 ≥ 0.8 with an index SNP) (Table S4, N = 3,507 SNPs for a total of 125 non-sex chromosomal index SNPs) falling within a hotspot of OCRs in hiPSC, N-30, N-41 and LCL (Buenrostro et al., 2013) (recalled together with our own ATAC-seq data). We then compiled a random set of relatively independent tagging SNPs (r2 < 0.1; n = 7,478) and identified their SNP proxies (r2 ≥ 0.8 with a tagging SNP) from 1000 genome project. For the permutation, we randomly drew 10,000 sets of 125 tagging SNPs, matching the number of the SNP proxies for each index SNP, and for each set we intersected the number of tag SNPs (or their proxies) that fall within a hotspot of OCRs in hiPSC, N-30, N-41 and LCL. We estimated the enrichment of SZ GWAS loci in hotspots by compared to the mean of the number of random tag SNPs that that fall with hotspots of OCRs, and derived the empirical P-value for the enrichment as the percentage of times (or sets) when we observed a number of random tag SNPs that fall with a hotspot is more than the observed number of SZ GWAS index SNPs that fall with a hotspot in each cell type.
TF-binding footprint analysis by PIQ
Because multiple TFs may bind to the same functional noncoding sequence (Reddy et al., 2012), and also because of the limited scalability of ChIP-seq in assaying large number of TFs, we will infer the local TF occupancy footprint by PIQ(Sherwood et al., 2014) from ATAC-seq(Buenrostro et al., 2013) data. PIQ is a computational method that uses machine learning to identify the TF binding footprints at corresponding motifs from DNase-Seq experiments (or ATAC-seq) (Sherwood et al., 2014). PIQ prediction is highly concordant with ChIP-seq, with a median accuracy of 0.93, as measured by the area under the receiver operating characteristic curve (AUC; by comparing to > 300 ChIP-seq). We used the PIQ R package. We compiled a sets of motif in JASPAR formatted motif file to include more motifs from HOMER(Heinz et al., 2010), consisting of 1,316 TF motifs initially used by PIQ(Sherwood et al., 2014) and 45 non-overlapping ChIP-Seq TF motifs from HOMER. BAM files were used as input and reads of 2 replicates for each cell stage (hiPSC, iN-d30 and iN-d41) were combined to increase the sequencing depth. We also downloaded the published ATAC-seq data of a LCL (Buenrostro et al., 2013) (used as a control) and downsized the library to have a similar number of reads to hiPSC and iNs (Table S1). PIQ outputs a set of binding site calls and purity scores (corresponding to FDR).
SZ GWAS risk loci enrichment in TF footprints
We aimed to examine whether SZ-associated genetic variants are enriched in PIQ-inferred neuronal TF footprints. We compiled a list of SZ GWAS index SNPs (at 108 loci) and all their LD proxies (r2 ≥ 0.8; total n = 3,507) (Schizophrenia Working Group of the Psychiatric Genomics Consortium, 2014). We intersected PIQ-inferred TF footprints in each cell type/stage) (hiPSC, N-d30, N-d41, and LCL) with all 3,507 SZ GWAS SNPs. We used different PIQ purity score as a cut-off (0.7, 0.8, or 0.9) and restricted the intersecting sequence intervals to the footprints or 100 bp footprint-flanking sequences (±100bp). We summarized the total SNP numbers (including the SZ GWAS index SNP and their proxies) or the independent SZ risk loci (i.e., only the index SNPs) for each type of intervals in each cell type/stage (see Table S6). We estimated the enrichment of SZ GWAS SNPs in TF footprints or their flanking sequences (±100bp) by comparing the number of SNPs for hiPSC, N-d30, or N-d41 to that of LCL. Fisher's exact test was used to derive the significance of enrichment. Different cut-offs of PIQ score gave similar enrichment results, with PIQ score cut-off of 0.7 yielding most significant enrichment p values, likely due to the larger number of TF footprints and the intersected SZ GWAS SNPs.
CRISPR/Cas9 editing of hiPSCs
CRISPR guide RNA (gRNA) sequences were designed using online tool (http://crispr.mit.edu/), and we selected the gRNAs with highest score (specificity). The gRNAs were cloned into pSpCas9(BB)-2A-Puro vector (Addgene) for co-expression with Cas9 based on an established protocol (Ran et al., 2013). For transfection, we used FuGENE HD (Promega) at DNA/Reagent ratio of 1:3.5 to co-transfect CRISPRs (1.5 μg of Cas9-gRNA plasmid) and ssODNs (1.5 μg repair oligos) into iPSCs cultured on 6-well plate (3 × 10⁵ cells plated one day before transfection in mTeSR1 media with 5 μM ROCK inhibitor). We started puromycin (0.4 μg/ml) selection at 24 hr post transfection, and cut the puromycin to 0.2 μg/ml at 48 hr post transfection and withdrawn it after 72 hr of transfection. 10 days after transfection, resistant colonies were picked into 96-well plates and a small proportion of cells from each colony were used for DNA isolation using QuickExtract solution (Epicenter). The extracted DNAs were used for Sanger sequencing to verify the on-target and off-target editing. For checking off-target editing, primers were designed to amplify regions corresponding to the 6 top ranking predicted off-targets. Primers and oligos were synthesized at Integrated DNA Technologies (IDT).
Rapid neuron differentiation
iPSCs were dissociated into single cells by accutase and replated at 5 × 10⁵ cells per well on 6-well plate using mTeSR1 media with 5 μM ROCK inhibitor on Day (−1). On Day 0, cells were infected by 1 ml/well lentivirus cocktail containing 2.5 μl/ml NGN2 virus (Zhang et al., 2013) and 3.3 μl/ml rtTA virus (Zhang et al., 2013). The virus cocktail was prepared in mTeSR1 with 5 μM ROCK inhibitor. mTeSR1 media was switched to neurobasal media consisting of Neural Basal, B27, L-glutamine and 2 μg/ml doxycycline on Day 1. After a two-day puromycin selection at 1 μg/ml on Day 2 and Day 3, cells were dissociated into single cells by accutase at 37°C for 5 min on Day 5, and replated into neural culture media containing Neural Basal, L-glutamine, B27, 2 μg/ml doxycycline, 10 ng/ml BDNF, 10 ng/ml GDNF and 10 ng/ml NT3. For morphology analyses, cells were plated as a blob onto a rat astrocytes coated cover glass at 1 × 10⁵ cells per well; for RNA isolation and gene expression analysis, cells were plated onto laminin-coated 6-well plate at 1 × 10⁶ cells per well. After replating, cells were fed with neural culture media on Day 6, with half-volume of medium change every 3 days for continuous culturing. On Day 28, 1 μg GFP plasmid was transfected into neurons cultured on rat astrocytes using lipofectamine 2000 (Thermofisher) with DNA:reagent ratio 1:2 for 5 hr. Neurons were then fixed in 4% paraformaldehyde (PFA) containing 4% sucrose at room temperature for 15 min on Day 30.
Immunocytochemistry
For routine characterization of iPSCs and neurons, cells were fixed in 4% PFA (Sigma) for 15 min at room temperature. After 3 times of brief wash in PBS, cells were permeabilized with 1% Triton X-100 (Sigma) in PBS for 15 min at room temperature and blocked in 3% BSA and 0.1% Triton X-100 in PBS at 4°C overnight. Then the samples were incubated with primary antibodies at 4°C overnight, followed by 3 times of PBS wash. The samples were then incubated with secondary antibodies at room temperature for 1hr. After another 3 times of PBS wash, samples were incubated in 2.5 μg/ml DAPI (4′, 6-diamidino-2-phenylindole) at room temperature for 10 min and mounted on glass slides. We prepared antibodies in blocking solution. The images were taken by Nikon ECLIPSE TE2000-U microscope. Primary antibodies used and their dilutions for incubation were: SSEA-4 (Abcam, 1:100), Nanog (Abcam, 1:200), Oct 3/4 (Abcam, 1:200), TRA-1-60 (Abcam, 1:300), Tuj1 (TUBB3) (EMD Millipore, 1:200), Nestin (Abcam, 1:300), Pax6 (Covance, 1:300), Brn2 (Santa Cruz, 1:100), vGlut1 (Synaptic Systems, 1:1000), MAP2 (Abcam, 1:500). Secondary antibodies were 1:800 diluted (Alexa 488, Jackson ImmunoResearch).
For immunostaining of iN-d30 in dendritic and synaptic analyses, cells were fixed using 4% formaldehyde (Sigma) in 4% sucrose/PBS for 15 min at room temperature. Cells were permeabilized and blocked simultaneously in PBS containing 0.1% Triton and 5% normal goat serum (Jackson Immunoresearch) for 2 hr at 4°C followed by incubation with primary antibodies overnight at 4°C. Cells were washed three times in PBS and incubated with secondary antibodies at room temperature for 1 hr followed by another three washes in PBS. Coverslips with immunostained cells were briefly washed in distilled water and mounted onto microscope slides using Prolong anti-fade reagent (Life Technologies). Primary and secondary antibodies were diluted in PBS containing 5% normal goat serum. Neurons from the same differentiation experiment were fixed and stained at the same time with identical antibody dilutions. Primary antibodies: GFP (Abcam ab13970, 1:10,000), GluA1 (Millipore AB1504, 1:300), PSD-95 (NeuroMab clone K28/43 1:1000). Secondary antibodies: Alexa 488 donkey anti-chicken (1:1000), Alexa 568 donkey anti-mouse (1:1000), Alexa 647 donkey anti-rabbit (1:1000).
miRNA expression analysis by qPCR
Neurons were plated onto laminin-coated 6-well plate for gene expression analysis. Cells were harvested using accutase on days specified in each experiment. MirVana kit (Thermofisher) was used to isolate total RNAs that retain small RNAs. For qPCR, 10 ng RNA was used in reverse transcription (RT) reaction using TaqMan MicroRNA Reverse Transcription Kit (Applied Biosystems). qPCR (real-time PCR) was performed using TaqMan Universal PCR Master Mix (Applied Biosystems) on Roche LightCycler 480 (Roche). TaqMan mature microRNA assays (Applied Biosystems) were used in RT and qPCR. We used ΔΔCT (cycle threshold)-method for relative gene expression quantification, with RNU48 as endogenous small RNA control for expression normalization. The miRNA expression differences between different cell lines were estimated from three independent cultures by two-sided paired Student's t test.
Principal component analysis (PCA) of similarities between ATAC-seq samples
To estimate the similarity of global OCR profiles of iNs at day 15 after NGN2-induction and of the regularly differentiated neurons (N-d30 and N-d41 from subject GM01835), we performed PCA using princomp function in R package. The PCA also serves as a quality control metric to identify any outlier samples or replicates. ATAC-seq or DNase-seq read intensities of TSS-core promoters (n = 34,420; 500bp upstream of TSS and 100bp downstream of TSS as defined by HOMER) in each sample were used in PCA. The assayed samples include: (1) ATAC-seq data of five iN-d15 samples including the unedited SZ-risk line of a SZ patient carrying risk alleles of the rare risk variant 1:g. 98515539 (A/T) and the common GWAS risk variant rs1198588 (S1 = SZ-risk (Rare_AT/GWAS_TT)), and its isogenic CRISPR/Cas9-edited lines with different combinations of the risk allele “correction” at the two SNP sites (S2 = Rare_AA/GWAS_TT_Clone 1, S3 = Rare_AA/GWAS_TT_Clone 2, S4 = Rare_AA/GWAS_AA_Clone 1 and S5 = Rare_AA/GWAS_AA_Clone 2); (2) ATAC-seq data of iPSC and the conventionally differentiated neurons, N-d31 and N-41, each including two replicates; and (3) DNase-Seq data of fetal brain samples (fb1 and fb2). Through PCA, the variance of high dimensional ATAC-seq data of all the samples were transformed into 13 PCs. The first two PCs explain ∼92% of the variations between samples and were plotted to cluster the assayed samples (Figure S6E). Replicates of the same cell type or tissue are always more similar to each other, suggesting good ATAC-seq reproducibility. The global ATAC-seq profiles of NGN2-induced iN-d15 (samples S1-5) were clustered together and appeared to be more similar to N-d30 than to N-d41. ATAC-seq profiles of N-d41 and fetal brains are more similar to each other (based on PC1; please note PC2 only explains 4% of the variance). It was not surprising that N-d41 and fb are clustered between iPSC and N-d30 (and iN-d15), because N-d30 has gained most OCRs some of which were either turned off or with reduced accessibility in N-d41 (Figure 1E).
RNA-seq and data processing
We carried out RNA-seq for iPSC, N-d30 and N-d41 during cortical neuron differentiation as well as rapidly induced neurons of CRISPR/Cas9 edited isogenic lines. Total RNAs isolated by using MirVana kit (Thermofisher) were used in RNA-seq. RNA integrity number (RIN) were all > 8. The sequencing library was prepared with TruSeq stranded RNA library preparation reagents. RNA-seq was carried out at the University of Minnesota Genomics Center (UMGC) on an Illumina HiSeq 2500 using v4 chemistry. Average quality score is above the Q score cutoff of 30 for all libraries. The total number of reads were 31-35 millions of single 50-bp reads/sample for the cells used for ATAC-seq (2 iPSC, 2 N-d30, and 1 N-d41), and 29∼36 millions of single 50-bp reads/sample for the rapidly induced neurons (at day15 of neural induction) of CRISPR/Cas9 edited isogenic lines (SZ-risk, Rare-corrected or rs1198588-corrected). We aligned the 50-bp single reads to the human reference gene map (Gencode v18) using the mapping tool Tophat v2.0.5 (Trapnell et al., 2012), allowing for 2 mismatches. We counted the raw reads by using the HTseq-count script (http://www-huber.embl.de/users/anders/HTSeq/doc/overview.html) and calculated gene level expression as RPKM based on the exon model of the longest transcript of a gene (Gencode v18). We then quantile-normalized gene level RPKMs to account for batch / run bias. We did not perform a genome-wide expression analysis, and only some specific genes were examined for their expression in specified analyses.
Dendritic complexity analysis
To quantify dendritic complexity, GFP-transfected neurons were imaged on a Nikon C2+ confocal microscope with NIS-Elements software. Ten to thirty neurons from multiple coverslips (at least three independent differentiation experiments) were imaged for each isogenic line: SZ-risk (n = 70), Rare-corrected (n = 131), rs1198588-corrected (n = 38), rs1198588_OCpeak-deletion (n = 46). Individual clones from CRISPR editing were compared and the data from each clone was pooled after ensuring they were not statistically different (Figures S7A-S7D; Rare-corrected clone 1, n = 20; Rare-corrected clone 2, n = 20; rs1198588-corrected clone 1, n = 20; rs1198588-corrected clone 2, n = 18). Neurons were only imaged if a visible axon and at least one defined primary dendrite could be identified. Following acquisition, dendrites were traced and images binarized in ImageJ (National Institutes of Health, Bethesda, MD). For each image, the axon was identified and eliminated from quantification. Sholl analysis was performed using the ‘Sholl analysis’ plugin for ImageJ. The center of the soma was defined manually and concentric circles spaced 10 μm apart were used to quantify dendritic complexity in all cells. Binarized traces created in ImageJ were then imported into NeuroStudio (http://research.mssm.edu/cnic/tools-ns.html) for analysis of total dendrite length. Neuronal morphology was reconstructed semi-automatically in 2D and edited manually to define the soma, branch points and end points (tips). Reconstructions (.swc files) were imported into L-measure (http://cng.gmu.edu:8080/Lm/) to quantify total dendrite length. All analyses were performed blind to genotypes.
Puncta and protrusion density analysis
Images of GFP-transfected and immunostained neurons were acquired using a × 63 oil immersion objective lens on a Nikon C2+ confocal microscope with NIS-Elements software. Each channel was acquired sequentially to prevent fluorescence bleed-through with 2× line averaging for each channel and 1.5× digital zoom. All images were acquired using identical settings for each channel to allow comparison between groups. For the images presented in Figure 7, each channel was adjusted for brightness and contrast and then merged to create the final composite images. Images were otherwise unaltered. Individual clones from CRISPR editing were compared and the data from each clone was pooled after ensuring they were not statistically different. Dendrites were imaged on multiple z-planes to capture full dendritic branches and maximum intensity projections of z stacks created in ImageJ were used for downstream analyses. Five to ten neurons from multiple coverslips (at least two differentiation experiments) were imaged for each isogenic line. Analysis of the rare and common MIR137 variants were performed independently. For analysis of the rare variant: SZ-risk (n = 20), Rare-corrected (n = 20). For analysis of the common variant rs1198588: Rare-corrected (n = 37), rs1198588-corrected (n = 38). Puncta were analyzed using the ‘Analyze Particle’ function in ImageJ. Regions of interest (ROI) on the dendrite (∼100 μm) were selected using the GFP-filled cell as an outline. A set threshold was defined for each experiment and applied identically to all conditions so that only puncta above diffuse background staining were considered in the analysis. The area and intensity of each puncta was recorded and mean values were calculated for each cell. For protrusion density analysis a region of dendrite (∼100 μm) was selected and all protrusion < 15 μm were manually counted and recorded. Protrusions containing synaptic puncta (PSD-95, GluA1 or both overlapping) were identified manually after a set threshold was applied to each channel. All analyses were performed blind to genotype.
Quantification and Statistical Analysis
General
The statistical tests and parameters including the definitions and exact values of n can be found in the Method Details, and are also reported in the corresponding Figure Legends. Result were considered as significant if p < 0.05. All data are reported as mean ± SEM except Figures 4E and 4F reported as mean ± SD.
Statistics in neuronal phenotype analyses
For sholl analysis, a two-way repeated-measures ANOVA was performed to detect an effect of genotype-distance interaction. A post hoc Bonferroni correction was then applied to the analysis to correct for multiple testing and determine the significance of each data point at each distance interval. For all other neuronal phenotype analyses, an unpaired Student's t test (for parametric data) or a Mann-Whitney test (for non-parametric data) was used. Datasets were tested for normality using D'Agostino and Pearson omnibus normality test. All data was analyzed in Graphpad version 5.03. All analyses were performed blind to genotypes.
Data Software and Availability
Data Resources
The accession number for the full ATAC-seq datasets reported in this paper is GEO: GSE70823.
Supplementary Material
Key Resources Table.
| REAGENT or RESOURCE | SOURCE | IDENTIFIER |
|---|---|---|
| Antibodies | ||
| OCT4 (1:200) | Abcam | Cat# ab19857 RRID:AB_445175 |
| TRA-1-60 (1:300) | Abcam | Cat# ab16288 RRID:AB_778563 |
| NANOG (1:200) | Abcam | Cat# ab21624 RRID:AB_446437 |
| SSEA4 (1:100) | Abcam | Cat# ab16287 RRID:AB_778073 |
| Tuj1 (1:200) | EMD Millipore | Cat# MAB1637 RRID:AB_2210524 |
| Nestin (1:300) | Abcam | Cat# ab22035 RRID:AB_446723 |
| Pax6 (1:300) | Biolegend | Cat# 901301 RRID:AB_2565003 |
| Brn2 (1:100) | Santa Cruz | Cat# sc-6029 RRID:AB_2167385 |
| vGlut1 (1:1000) | Synaptic Systems | Cat# 135 311 RRID:AB_887880 |
| MAP2 (1:500) | Abcam | Cat# ab11267 RRID:AB_297885 |
| Alexa 488 donkey anti-rabbit (1:800) | Jackson ImmunoResearch | Cat# 711-545-152 RRID:AB_2313584 |
| GFP (1:10,000) | Abcam | Cat# ab13970 RRID:AB_300798 |
| GluA1 (1:300) | Millipore | Cat# AB1504 RRID:AB_2113602 |
| PSD-95 (1:1000) | NeuroMab | Cat# 75-028 RRID:AB_2307331 |
| Alexa 488 goat anti-chicken (1:1000) | ThermoFisher | Cat# A11039 RRID:AB_142924 |
| Alexa 568 goat anti-mouse (1:1000) | ThermoFisher | Cat# A11031 RRID:AB_144696 |
| Alexa 647 goat anti-rabbit (1:1000) | ThermoFisher | Cat# A21245 RRID:AB_141775 |
| Bacterial and Virus Strains | ||
| NGN2 virus | (Zhang et al., 2013) | From Dr. Zhiping Pang |
| rtTA virus | (Zhang et al., 2013) | From Dr. Zhiping Pang |
| Biological Samples | ||
| Rat astrocytes | ThermoFisher | Cat# N7745100 |
| Chemicals, Peptides, and Recombinant Proteins | ||
| mTeSR1 media | STEMCELL | Cat# 85850 |
| Dorsomorphin | R&D Systems | Cat# 3093 |
| SB431542 | R&D Systems | Cat# 1614 |
| Geltrex | Thermofisher | Cat# A15696-01 |
| FGF2 | PeproTech | Cat# 100-18B |
| Laminin | Sigma | Cat# L2020 |
| FuGENE HD | Promega | Cat# E2311 |
| Accutase | Thermofisher | Cat# A11105-01 |
| ROCK inhibitor | R&D Systems | Cat# 1254 |
| Doxycycline | Sigma | Cat# D3072 |
| Puromycin | Thermofisher | Cat# A1113803 |
| BDNF | PeproTech | Cat# 450-02 |
| GDNF | PeproTech | Cat# 450-10 |
| NT3 | PeproTech | Cat# 450-03 |
| Lipofectamine 2000 | Thermofisher | Cat#11668019 |
| Critical Commercial Assays | ||
| TaqMan MicroRNA Reverse Transcription Kit | Applied Biosystems | Cat# 4366596 |
| DNeasy Blood & Tissue Kit | QIAGEN | Cat# 69504 |
| BigDye terminator v3.1 Cycle Sequencing Kit | Thermofisher | Cat# 4337454 |
| CellsDirect One-Step qRT-PCR Kit | Thermofisher | Cat# 11753100 |
| TaqMan qPCR assay: VGLUT1 | IDT | ID# Hs.PT.58.3958424 |
| TaqMan qPCR assay: VGLUT2 | IDT | ID# Hs.PT.58.45712063 |
| TaqMan qPCR assay: PSD95 | IDT | ID# Hs.PT.58.2102147 |
| TaqMan qPCR assay: BRN2 | IDT | ID# Hs.PT.58.27612813.g |
| TaqMan qPCR assay: VGAT | IDT | ID# Hs.PT.58.4211177 |
| TaqMan qPCR assay: TH | IDT | ID# Hs.PT.58.40438538 |
| TaqMan qPCR assay: PITX3 | IDT | ID# Hs.PT.58.25871319 |
| TaqMan qPCR assay: MAP2 | Thermofisher | Cat#4331182 ID# Hs00258900_m1 |
| TaqMan qPCR assay: GAPDH | Thermofisher | Cat# 4331182 ID# Hs03929097_g1 |
| Fluidigm 48×48 expression arrays | Fluidigm | BMK-M-48.48 |
| MinElute Kit | QIAGEN | Cat# 28004 |
| QuickExtract solution | Epicenter | Cat# QE09050 |
| MirVana kit | Thermofisher | Cat# AM1560 |
| NEBNext High-Fidelity 2× PCR Master Mix | NEB | Cat# M0541L |
| Deposited Data | ||
| Raw data files for ATAC-seq | NCBI Gene Expression Omnibus | GEO: GSE70823 |
| Experimental Models: Cell Lines | ||
| SZ iPSC line (for open chromatin mapping) | Coriell | Cat# GM01835, RRID:CVCL_D873 |
| SZ iPSC line (for MIR137 editing) | RUCDR | ID: 06C60621 |
| Oligonucleotides | ||
| See Table S7 | N/A | N/A |
| Recombinant DNA | ||
| pSpCas9 (BB)-2A-Puro | Addgene | Plasmid #48139 |
| Software and Algorithms | ||
| Fluidigm Real-time PCR Analysis software | Fluidigm | https://www.fluidigm.com/software |
| HTseq-count script | (Anders and Huber, 2010) | www-huber.embl.de/users/anders/HTSeq/doc/overview.html |
| Trimmomatic | (Bolger et al., 2014) | N/A |
| Bowtie | (Langmead et al., 2009) | N/A |
| Picard Tools | N/A | http://broadinstitute.github.io/picard/ |
| Protein Interaction Quantification (PIQ) | (Sherwood et al., 2014) | N/A |
| Hotspot | (John et al., 2011) | N/A |
| BEDOPS v2.4.15 | (Neph et al., 2012) | N/A |
| Tophat v2.0.5 | (Trapnell et al., 2012) | N/A |
| ImageJ | NIH | https://imagej.net/Fiji/Downloads |
| NeuroStudio | CNIC | http://research.mssm.edu/cnic/tools-ns.html |
| L-measure | N/A | http://cng.gmu.edu:8080/Lm/ |
| PluriTest assay | (Müller et al., 2011) | http://www.pluritest.org |
Highlights.
Open chromatin undergoes dynamic change during hiPSC neuronal differentiation
Neuronal open chromatin prioritizes a subset of noncoding psychiatric risk variants
Schizophrenia risk SNPs alter promoter open chromatin and expression of MIR137
CRISPR editing of schizophrenia risk SNP in MIR137 OCR affects neurodevelopment
Acknowledgments
This work was supported by R21MH102685 and R01MH106575 (to J.D.), R01MH097216 (to P.P.), a Swiss National Science Foundation early postdoctoral mobility fellowship (to M.P.F.), and NIH grant F31NS084551 (to H.M.). Research in the Pang Laboratory was supported in part by the Robert Wood Johnson Foundation.
Footnotes
Supplemental Information: Supplemental Information includes seven figures and seven tables and can be found with this article online at http://dx.doi.org/10.1016/j.stem.2017.07.008.
Author Contributions: M.P.F. performed dendritic and synaptic analyses with the help of L.E.D. H.Z. carried out hiPSC culture, genome editing, neuronal differentiation, and gene expression experiments. W.M. analyzed open chromatin profiles. H.M. and Z.X. prepared the virus and performed the single-neuron expression analysis. C.L. performed ATAC-seq. J.S. helped with statistical analyses. Z.P.P., W.J.G., and C.A.C. guided neuronal differentiation, ATAC-seq, and genome editing, respectively. A.R.S. checked the clinical phenotypes. M.P.F, H.Z., W.M., A.R.S., Z.P.P., P.V.G, P.P., and J.D. wrote the manuscript. P.V.G. advised on study design. P.P. supervised dendritic analyses. J.D. conceived the study and supervised the work at NorthShore. All authors read and approved the manuscript.
References
- Anders S, Huber W. Differential expression analysis for sequence count data. Genome Biol. 2010;11:R106. doi: 10.1186/gb-2010-11-10-r106. [DOI] [PMC free article] [PubMed] [Google Scholar]
- Ang YS, Rivas RN, Ribeiro AJ, Srivas R, Rivera J, Stone NR, Pratt K, Mohamed TM, Fu JD, Spencer CI, et al. Disease Model of GATA4 Mutation Reveals Transcription Factor Cooperativity in Human Cardiogenesis. Cell. 2016;167:1734–1749.e22. doi: 10.1016/j.cell.2016.11.033. [DOI] [PMC free article] [PubMed] [Google Scholar]
- Bavamian S, Mellios N, Lalonde J, Fass DM, Wang J, Sheridan SD, Madison JM, Zhou F, Rueckert EH, Barker D, et al. Dysregulation of miR-34a links neuronal development to genetic risk factors for bipolar disorder. Mol Psychiatry. 2015;20:573–584. doi: 10.1038/mp.2014.176. [DOI] [PMC free article] [PubMed] [Google Scholar]
- Blizinsky KD, Diaz-Castro B, Forrest MP, Schürmann B, Bach AP, Martin-de-Saavedra MD, Wang L, Csernansky JG, Duan J, Penzes P. Reversal of dendritic phenotypes in 16p11.2 microduplication mouse model neurons by pharmacological targeting of a network hub. Proc Natl Acad Sci USA. 2016;113:8520–8525. doi: 10.1073/pnas.1607014113. [DOI] [PMC free article] [PubMed] [Google Scholar]
- Bolger AM, Lohse M, Usadel B. Trimmomatic: a flexible trimmer for Illumina sequence data. Bioinformatics. 2014;30:2114–2120. doi: 10.1093/bioinformatics/btu170. [DOI] [PMC free article] [PubMed] [Google Scholar]
- Brennand KJ, Simone A, Jou J, Gelboin-Burkhart C, Tran N, Sangar S, Li Y, Mu Y, Chen G, Yu D, et al. Modelling schizophrenia using human induced pluripotent stem cells. Nature. 2011;473:221–225. doi: 10.1038/nature09915. [DOI] [PMC free article] [PubMed] [Google Scholar]
- Brennand K, Savas JN, Kim Y, Tran N, Simone A, Hashimoto-Torii K, Beaumont KG, Kim HJ, Topol A, Ladran I, et al. Phenotypic differences in hiPSC NPCs derived from patients with schizophrenia. Mol Psychiatry. 2015;20:361–368. doi: 10.1038/mp.2014.22. [DOI] [PMC free article] [PubMed] [Google Scholar]
- Buenrostro JD, Giresi PG, Zaba LC, Chang HY, Greenleaf WJ. Transposition of native chromatin for fast and sensitive epigenomic profiling of open chromatin, DNA-binding proteins and nucleosome position. Nat Methods. 2013;10:1213–1218. doi: 10.1038/nmeth.2688. [DOI] [PMC free article] [PubMed] [Google Scholar]
- Schizophrenia Working Group of the Psychiatric Genomics Consortium. Biological insights from 108 schizophrenia-associated genetic loci. Nature. 2014;511:421–427. doi: 10.1038/nature13595. [DOI] [PMC free article] [PubMed] [Google Scholar]
- Corvin A, Sullivan PF. What Next in Schizophrenia Genetics for the Psychiatric Genomics Consortium? Schizophr Bull. 2016;42:538–541. doi: 10.1093/schbul/sbw014. [DOI] [PMC free article] [PubMed] [Google Scholar]
- Cotter D, Wilson S, Roberts E, Kerwin R, Everall IP. Increased dendritic MAP2 expression in the hippocampus in schizophrenia. Schizophr Res. 2000;41:313–323. doi: 10.1016/s0920-9964(99)00068-7. [DOI] [PubMed] [Google Scholar]
- Degner JF, Pai AA, Pique-Regi R, Veyrieras JB, Gaffney DJ, Pickrell JK, De Leon S, Michelini K, Lewellen N, Crawford GE, et al. DNase I sensitivity QTLs are a major determinant of human expression variation. Nature. 2012;482:390–394. doi: 10.1038/nature10808. [DOI] [PMC free article] [PubMed] [Google Scholar]
- Duan X, Chang JH, Ge S, Faulkner RL, Kim JY, Kitabatake Y, Liu XB, Yang CH, Jordan JD, Ma DK, et al. Disrupted-In-Schizophrenia 1 regulates integration of newly generated neurons in the adult brain. Cell. 2007;130:1146–1158. doi: 10.1016/j.cell.2007.07.010. [DOI] [PMC free article] [PubMed] [Google Scholar]
- Duan J, Shi J, Fiorentino A, Leites C, Chen X, Moy W, Chen J, Alexandrov BS, Usheva A, He D, et al. Molecular Genetics of Schizophrenia collaboration; Genomic Psychiatric Cohort consortium. A rare functional noncoding variant at the GWAS-implicated MIR137/MIR2682 locus might confer risk to schizophrenia and bipolar disorder. Am J Hum Genet. 2014;95:744–753. doi: 10.1016/j.ajhg.2014.11.001. [DOI] [PMC free article] [PubMed] [Google Scholar]
- Dunham I, Kundaje A, Aldred SF, Collins PJ, Davis CA, Doyle F, Epstein CB, Frietze S, Harrow J, Kaul R, et al. ENCODE Project Consortium. An integrated encyclopedia of DNA elements in the human genome. Nature. 2012;489:57–74. doi: 10.1038/nature11247. [DOI] [PMC free article] [PubMed] [Google Scholar]
- Edbauer D, Neilson JR, Foster KA, Wang CF, Seeburg DP, Batterton MN, Tada T, Dolan BM, Sharp PA, Sheng M. Regulation of synaptic structure and function by FMRP-associated microRNAs miR-125b and miR-132. Neuron. 2010;65:373–384. doi: 10.1016/j.neuron.2010.01.005. [DOI] [PMC free article] [PubMed] [Google Scholar]
- Grubert F, Zaugg JB, Kasowski M, Ursu O, Spacek DV, Martin AR, Greenside P, Srivas R, Phanstiel DH, Pekowska A, et al. Genetic Control of Chromatin States in Humans Involves Local and Distal Chromosomal Interactions. Cell. 2015;162:1051–1065. doi: 10.1016/j.cell.2015.07.048. [DOI] [PMC free article] [PubMed] [Google Scholar]
- Guella I, Sequeira A, Rollins B, Morgan L, Torri F, van Erp TG, Myers RM, Barchas JD, Schatzberg AF, Watson SJ, et al. Analysis of miR-137 expression and rs1625579 in dorsolateral prefrontal cortex. J Psychiatr Res. 2013;47:1215–1221. doi: 10.1016/j.jpsychires.2013.05.021. [DOI] [PMC free article] [PubMed] [Google Scholar]
- Handel AE, Gallone G, Cader MZ, Ponting CP. Most brain disease-associated and eQTL haplotypes are not located within transcription factor DNase-seq footprints in brain. Hum Mol Genet. 2017;26:79–89. doi: 10.1093/hmg/ddw369. [DOI] [PMC free article] [PubMed] [Google Scholar]
- Heinz S, Benner C, Spann N, Bertolino E, Lin YC, Laslo P, Cheng JX, Murre C, Singh H, Glass CK. Simple combinations of lineage-determining transcription factors prime cis-regulatory elements required for macrophage and B cell identities. Mol Cell. 2010;38:576–589. doi: 10.1016/j.molcel.2010.05.004. [DOI] [PMC free article] [PubMed] [Google Scholar]
- John S, Sabo PJ, Thurman RE, Sung MH, Biddie SC, Johnson TA, Hager GL, Stamatoyannopoulos JA. Chromatin accessibility pre-determines glucocorticoid receptor binding patterns. Nat Genet. 2011;43:264–268. doi: 10.1038/ng.759. [DOI] [PMC free article] [PubMed] [Google Scholar]
- Konopaske GT, Lange N, Coyle JT, Benes FM. Prefrontal cortical dendritic spine pathology in schizophrenia and bipolar disorder. JAMA Psychiatry. 2014;71:1323–1331. doi: 10.1001/jamapsychiatry.2014.1582. [DOI] [PMC free article] [PubMed] [Google Scholar]
- Kulkarni VA, Firestein BL. The dendritic tree and brain disorders. Mol Cell Neurosci. 2012;50:10–20. doi: 10.1016/j.mcn.2012.03.005. [DOI] [PubMed] [Google Scholar]
- Langmead B, Trapnell C, Pop M, Salzberg SL. Ultrafast and memory-efficient alignment of short DNA sequences to the human genome. Genome Biol. 2009;10:R25. doi: 10.1186/gb-2009-10-3-r25. [DOI] [PMC free article] [PubMed] [Google Scholar]
- Lara-Astiaso D, Weiner A, Lorenzo-Vivas E, Zaretsky I, Jaitin DA, David E, Keren-Shaul H, Mildner A, Winter D, Jung S, et al. Immunogenetics. Chromatin state dynamics during blood formation. Science. 2014;345:943–949. doi: 10.1126/science.1256271. [DOI] [PMC free article] [PubMed] [Google Scholar]
- Lee D, Gorkin DU, Baker M, Strober BJ, Asoni AL, McCallion AS, Beer MA. A method to predict the impact of regulatory variants from DNA sequence. Nat Genet. 2015;47:955–961. doi: 10.1038/ng.3331. [DOI] [PMC free article] [PubMed] [Google Scholar]
- Levinson DF, Duan J, Oh S, Wang K, Sanders AR, Shi J, Zhang N, Mowry BJ, Olincy A, Amin F, et al. Copy number variants in schizophrenia: confirmation of five previous findings and new evidence for 3q29 microdeletions and VIPR2 duplications. Am J Psychiatry. 2011;168:302–316. doi: 10.1176/appi.ajp.2010.10060876. [DOI] [PMC free article] [PubMed] [Google Scholar]
- Li J, Cai T, Jiang Y, Chen H, He X, Chen C, Li X, Shao Q, Ran X, Li Z, et al. Genes with de novo mutations are shared by four neuro-psychiatric disorders discovered from NPdenovo database. Mol Psychiatry. 2016;21:290–297. doi: 10.1038/mp.2015.40. [DOI] [PMC free article] [PubMed] [Google Scholar]
- Lipska BK, Deep-Soboslay A, Weickert CS, Hyde TM, Martin CE, Herman MM, Kleinman JE. Critical factors in gene expression in postmortem human brain: Focus on studies in schizophrenia. Biol Psychiatry. 2006;60:650–658. doi: 10.1016/j.biopsych.2006.06.019. [DOI] [PubMed] [Google Scholar]
- Marshall CR, Howrigan DP, Merico D, Thiruvahindrapuram B, Wu W, Greer DS, Antaki D, Shetty A, Holmans PA, Pinto D, et al. Contribution of copy number variants to schizophrenia from a genome-wide study of 41,321 subjects. Nat Genet. 2017;49:27–35. doi: 10.1038/ng.3725. [DOI] [PMC free article] [PubMed] [Google Scholar]
- Meyer D, Bonhoeffer T, Scheuss V. Balance and stability of synaptic structures during synaptic plasticity. Neuron. 2014;82:430–443. doi: 10.1016/j.neuron.2014.02.031. [DOI] [PubMed] [Google Scholar]
- Müller FJ, Schuldt BM, Williams R, Mason D, Altun G, Papapetrou EP, Danner S, Goldmann JE, Herbst A, Schmidt NO, et al. A bio-informatic assay for pluripotency in human cells. Nat Methods. 2011;8:315–317. doi: 10.1038/nmeth.1580. [DOI] [PMC free article] [PubMed] [Google Scholar]
- Neph S, Kuehn MS, Reynolds AP, Haugen E, Thurman RE, Johnson AK, Rynes E, Maurano MT, Vierstra J, Thomas S, et al. BEDOPS: high-performance genomic feature operations. Bioinformatics. 2012;28:1919–1920. doi: 10.1093/bioinformatics/bts277. [DOI] [PMC free article] [PubMed] [Google Scholar]
- Olde Loohuis NF, Ba W, Stoerchel PH, Kos A, Jager A, Schratt G, Martens GJ, van Bokhoven H, Nadif Kasri N, Aschrafi A. MicroRNA-137 Controls AMPA-Receptor-Mediated Transmission and mGluR-Dependent LTD. Cell Rep. 2015;11:1876–1884. doi: 10.1016/j.celrep.2015.05.040. [DOI] [PubMed] [Google Scholar]
- Panchision DM. Concise Review: Progress and Challenges in Using Human Stem Cells for Biological and Therapeutics Discovery: Neuropsychiatric Disorders. Stem Cells. 2016;34:523–536. doi: 10.1002/stem.2295. [DOI] [PMC free article] [PubMed] [Google Scholar]
- Paşca AM, Sloan SA, Clarke LE, Tian Y, Makinson CD, Huber N, Kim CH, Park JY, O'Rourke NA, Nguyen KD, et al. Functional cortical neurons and astrocytes from human pluripotent stem cells in 3D culture. Nat Methods. 2015;12:671–678. doi: 10.1038/nmeth.3415. [DOI] [PMC free article] [PubMed] [Google Scholar]
- Patzke C, Acuna C, Giam LR, Wernig M, Südhof TC. Conditional deletion of L1CAM in human neurons impairs both axonal and dendritic arborization and action potential generation. J Exp Med. 2016;213:499–515. doi: 10.1084/jem.20150951. [DOI] [PMC free article] [PubMed] [Google Scholar]
- Paul DS, Soranzo N, Beck S. Functional interpretation of non-coding sequence variation: concepts and challenges. BioEssays. 2014;36:191–199. doi: 10.1002/bies.201300126. [DOI] [PMC free article] [PubMed] [Google Scholar]
- Portera-Cailliau C, Pan DT, Yuste R. Activity-regulated dynamic behavior of early dendritic protrusions: evidence for different types of dendritic filopodia. J Neurosci. 2003;23:7129–7142. doi: 10.1523/JNEUROSCI.23-18-07129.2003. [DOI] [PMC free article] [PubMed] [Google Scholar]
- Ran FA, Hsu PD, Wright J, Agarwala V, Scott DA, Zhang F. Genome engineering using the CRISPR-Cas9 system. Nat Protoc. 2013;8:2281–2308. doi: 10.1038/nprot.2013.143. [DOI] [PMC free article] [PubMed] [Google Scholar]
- Reddy TE, Gertz J, Pauli F, Kucera KS, Varley KE, Newberry KM, Marinov GK, Mortazavi A, Williams BA, Song L, et al. Effects of sequence variation on differential allelic transcription factor occupancy and gene expression. Genome Res. 2012;22:860–869. doi: 10.1101/gr.131201.111. [DOI] [PMC free article] [PubMed] [Google Scholar]
- Rigamonti A, Repetti GG, Sun C, Price FD, Reny DC, Rapino F, Weisinger K, Benkler C, Peterson QP, Davidow LS, et al. Large-Scale Production of Mature Neurons from Human Pluripotent Stem Cells in a Three-Dimensional Suspension Culture System. Stem Cell Reports. 2016;6:993–1008. doi: 10.1016/j.stemcr.2016.05.010. [DOI] [PMC free article] [PubMed] [Google Scholar]
- Roberts RC, Roche JK, Conley RR. Differential synaptic changes in the striatum of subjects with undifferentiated versus paranoid schizophrenia. Synapse. 2008;62:616–627. doi: 10.1002/syn.20534. [DOI] [PubMed] [Google Scholar]
- Schratt GM, Tuebing F, Nigh EA, Kane CG, Sabatini ME, Kiebler M, Greenberg ME. A brain-specific microRNA regulates dendritic spine development. Nature. 2006;439:283–289. doi: 10.1038/nature04367. [DOI] [PubMed] [Google Scholar]
- Seshadri M, Banerjee D, Viswanath B, Ramakrishnan K, Purushottam M, Venkatasubramanian G, Jain S. Cellular models to study schizophrenia: A systematic review. Asian J Psychiatr. 2017;25:46–53. doi: 10.1016/j.ajp.2016.10.015. [DOI] [PubMed] [Google Scholar]
- Sherwood RI, Hashimoto T, O'Donnell CW, Lewis S, Barkal AA, van Hoff JP, Karun V, Jaakkola T, Gifford DK. Discovery of directional and nondirectional pioneer transcription factors by modeling DNase profile magnitude and shape. Nat Biotechnol. 2014;32:171–178. doi: 10.1038/nbt.2798. [DOI] [PMC free article] [PubMed] [Google Scholar]
- Shi J, Levinson DF, Duan J, Sanders AR, Zheng Y, Pe'er I, Dudbridge F, Holmans PA, Whittemore AS, Mowry BJ, et al. Common variants on chromosome 6p22.1 are associated with schizophrenia. Nature. 2009;460:753–757. doi: 10.1038/nature08192. [DOI] [PMC free article] [PubMed] [Google Scholar]
- Shi Y, Kirwan P, Smith J, Robinson HP, Livesey FJ. Human cerebral cortex development from pluripotent stem cells to functional excitatory synapses. Nat Neurosci. 2012;15:477–486. S1. doi: 10.1038/nn.3041. [DOI] [PMC free article] [PubMed] [Google Scholar]
- Shi S, Leites C, He D, Schwartz D, Moy W, Shi J, Duan J. MicroRNA-9 and microRNA-326 regulate human dopamine D2 receptor expression, and the microRNA-mediated expression regulation is altered by a genetic variant. J Biol Chem. 2014;289:13434–13444. doi: 10.1074/jbc.M113.535203. [DOI] [PMC free article] [PubMed] [Google Scholar]
- Siegel G, Obernosterer G, Fiore R, Oehmen M, Bicker S, Christensen M, Khudayberdiev S, Leuschner PF, Busch CJ, Kane C, et al. A functional screen implicates microRNA-138-dependent regulation of the depalmitoylation enzyme APT1 in dendritic spine morphogenesis. Nat Cell Biol. 2009;11:705–716. doi: 10.1038/ncb1876. [DOI] [PMC free article] [PubMed] [Google Scholar]
- Siegert S, Seo J, Kwon EJ, Rudenko A, Cho S, Wang W, Flood Z, Martorell AJ, Ericsson M, Mungenast AE, Tsai LH. The schizophrenia risk gene product miR-137 alters presynaptic plasticity. Nat Neurosci. 2015;18:1008–1016. doi: 10.1038/nn.4023. [DOI] [PMC free article] [PubMed] [Google Scholar]
- Smrt RD, Szulwach KE, Pfeiffer RL, Li X, Guo W, Pathania M, Teng ZQ, Luo Y, Peng J, Bordey A, et al. MicroRNA miR-137 regulates neuronal maturation by targeting ubiquitin ligase mind bomb-1. Stem Cells. 2010;28:1060–1070. doi: 10.1002/stem.431. [DOI] [PMC free article] [PubMed] [Google Scholar]
- Thurman RE, Rynes E, Humbert R, Vierstra J, Maurano MT, Haugen E, Sheffield NC, Stergachis AB, Wang H, Vernot B, et al. The accessible chromatin landscape of the human genome. Nature. 2012;489:75–82. doi: 10.1038/nature11232. [DOI] [PMC free article] [PubMed] [Google Scholar]
- Topol A, Zhu S, Hartley BJ, English J, Hauberg ME, Tran N, Rittenhouse CA, Simone A, Ruderfer DM, Johnson J, et al. Dysregulation of miRNA-9 in a Subset of Schizophrenia Patient-Derived Neural Progenitor Cells. Cell Rep. 2016;15:1024–1036. doi: 10.1016/j.celrep.2016.03.090. [DOI] [PMC free article] [PubMed] [Google Scholar]
- Trapnell C, Roberts A, Goff L, Pertea G, Kim D, Kelley DR, Pimentel H, Salzberg SL, Rinn JL, Pachter L. Differential gene and transcript expression analysis of RNA-seq experiments with TopHat and Cufflinks. Nat Protoc. 2012;7:562–578. doi: 10.1038/nprot.2012.016. [DOI] [PMC free article] [PubMed] [Google Scholar]
- Volk L, Chiu SL, Sharma K, Huganir RL. Glutamate synapses in human cognitive disorders. Annu Rev Neurosci. 2015;38:127–149. doi: 10.1146/annurev-neuro-071714-033821. [DOI] [PubMed] [Google Scholar]
- Welter D, MacArthur J, Morales J, Burdett T, Hall P, Junkins H, Klemm A, Flicek P, Manolio T, Hindorff L, Parkinson H. The NHGRI GWAS Catalog, a curated resource of SNP-trait associations. Nucleic Acids Res. 2014;42:D1001–D1006. doi: 10.1093/nar/gkt1229. [DOI] [PMC free article] [PubMed] [Google Scholar]
- Wen Z, Christian KM, Song H, Ming GL. Modeling psychiatric disorders with patient-derived iPSCs. Curr Opin Neurobiol. 2016;36:118–127. doi: 10.1016/j.conb.2015.11.003. [DOI] [PMC free article] [PubMed] [Google Scholar]
- Wright C, Turner JA, Calhoun VD, Perrone-Bizzozero N. Potential Impact of miR-137 and Its Targets in Schizophrenia. Front Genet. 2013;4:58. doi: 10.3389/fgene.2013.00058. [DOI] [PMC free article] [PubMed] [Google Scholar]
- Zhang Y, Pak C, Han Y, Ahlenius H, Zhang Z, Chanda S, Marro S, Patzke C, Acuna C, Covy J, et al. Rapid single-step induction of functional neurons from human pluripotent stem cells. Neuron. 2013;78:785–798. doi: 10.1016/j.neuron.2013.05.029. [DOI] [PMC free article] [PubMed] [Google Scholar]
Associated Data
This section collects any data citations, data availability statements, or supplementary materials included in this article.