Abstract
RATIONALE
High throughput screening of biofluids is essential in monitoring concentration of a variety of drugs to determine their efficacy and toxicity. Organosiloxane polymers prepared by sol-gel chemistry as sample supports and electrospray-ionization emitters in a single material and as an alternative to paper substrates, is described in this study.
METHODS
Hydrophobic drugs and hydrophilic streptomycin were analyzed by polymer-spray MS with an LTQ-Orbitrap mass spectrometer. Drug samples in urine (1–2 μL) were deposited on an OSX polymer, allowed to dry, then electrosprayed from the polymer tip into the mass spectrometer without sample pretreatment. The OSX polymers, whose polarity and porosity can be controlled, were prepared by sol-gel chemistry where methyl-substituted alkoxysilanes were hydrolyzed in the presence of a pore template and an acid catalyst.
RESULTS
Five nanograms each of 7 narcotic drugs were detected in <1 min (RSD of response <1% for each drug). Calibration curves of cocaine and streptomycin in urine was used to establish the performance of the polymer. For sample 1 (n=2), the mean recovery for cocaine was 81% with paper and 90% with polymer. Streptomycin is detected with polymer, not with paper; for samples 1 and 2 (n=3), mean recovery was 97% and 95%, respectively.
CONCLUSIONS
Organosiloxane polymers achieve better sensitivity analysis than paper, allowing for more accurate quantitation of both hydrophobic and hydrophilic drug compounds. The ability to tailor the polymer polarity and porosity allows for the synthesis of a wide range of polymers, and thus opens many possibilities for further development and applications.
Improving the management of a variety of diseases caused by pathogenic organisms relies on the correct dosage of antibiotic drugs for a patient. Measuring the concentration of antibiotics administered to a patient as part of the dosing regimen is often done by repeated measurements of the drug concentration over time to determine the therapeutic range to sustain drug efficacy, avoid drug-related toxicity, and decrease multiple-drug resistance. Streptomycin, the most widely used aminoglycoside antibiotic used to treat infections in humans, is a highly polar (hydrophilic) compound with narrow therapeutic index (20 – 30 μg/mL) and toxicity (50 μg/mL), which may be severe or irreversible.[1] Between 29% and 89% of the administered dose is excreted unchanged in the urine within 24 h.[2] Streptomycin is also used as a growth promoter in food-producing animals with the potential to develop streptomycin-resistant pathogens.[3] The detection and quantitation of streptomycin in biofluids often requires the use of hydrophilic interaction chromatography (HILIC), an alternative form of high-performance liquid chromatography (HPLC) where uncharged polar compounds are separated on polar stationary phases coupled with mass spectrometry[4] or matrix-assisted laser desorption/ionization time-of-flight mass spectrometry (MALDI-TOF MS).[5] However, these analytical methods suffer from increased time of analysis because of sample pretreatment and labor-intensive chromatographic procedures. Rapid analytical methods based on mass spectrometry for high-throughput analyses would provide important information on proper dosing of these drugs during antibiotic therapy and their detection in commercial food products.
Electrospray ionization mass spectrometry (ESI-MS) has been shown to be an invaluable tool in the analysis of chemical compounds in a variety of different matrices, including biological fluids. In conventional ESI, a small-diameter capillary is used to generate the electrospray that results in the formation of analyte ions. However, one of the drawbacks of using a capillary is the danger of clogging. Over the past two decades, improvements to sampling and ionization have been made, including the development of ambient ionization techniques and electrospray ionization (ESI) on solid substrates, such as metals and paper.[6] These improvements have led the way for the development of paper-spray mass spectrometry, which is an appealing form of ambient ionization mass spectrometry because only a small volume of analyte, typically some biofluid, is deposited on the surface of the paper support, allowed to dry, and then electrosprayed from the tip of the paper into a mass spectrometer.[7–10] This technique, which requires no pneumatic assistance to transport analytes to the mass spectrometer inlet, can be beneficial for use in on-site therapeutic drug monitoring in biofluids and in monitoring the quality of food products and can allow for high-throughput analyses. Open-surface sampling avoids the clogging problem of capillaries and allows for more choices of sampling support materials, such as a synthetic polymer.
An important feature of sampling materials for ambient ionization mass spectrometry is their polarity. Hydrophobic materials such as polymethylmethacrylate and polytetrafluoroethylene have been shown to have enhanced signal intensity and stability over less hydrophobic materials used in desorption ionization techniques.[11,12] Paper coated with a variety of different compounds have also been shown to have enhanced performance as sample supports in paper-spray mass spectrometry.[13–22] We have found that hydrophobic polymer sample supports allow for the detection of hydrophilic drugs, such as streptomycin, that are not easily detected, if at all, using paper-spray mass spectrometry.
We describe here a modification of paper-spray mass spectrometry in which the paper support is replaced by a suitable organic-inorganic hybrid organosiloxane (OSX) polymer whose porosity and chemical composition can be carefully controlled by use of a sol-gel process,[23] allowing for facile modification of the polymer surface (e.g., control of the surface hydrophobicity). The sol-gel process offers a simple, easy, and inexpensive route to make these OSX polymers. OSX polymers are used for the first time as a sampling support and an ESI emitter in a single material for the detection and quantitation of hydrophobic narcotics (logP ~0.9 to 2.3, where logP is the partition coefficient of the concentration of the compound in octanol to water),[24] and for the detection and quantitation of streptomycin (logP -6.4),[24] a hydrophilic antibiotic drug, which is not detectable using paper-spray mass spectrometry.
Experimental
Chemicals
Methyltrimethoxysilane (MTMS), streptomycin, dihydrostreptomycin, lidocaine, narcotic drugs and their deuterated analogs were purchased from Sigma-Aldrich (St. Louis, MO) and used without further purification. Narcotic drugs were purchased as 1 mg/mL in methanol or acetonitrile: amephetamine, methamphetamine, 3,4-methylenedioxy-amphetamine (MDA), 3,4-methylenedioxymethamphetamine (MDMA), 3,4-methylenedioxyethylamphetamine (MDEA), morphine, and cocaine. All solvents (MS-grade) and hydrochloric acid were purchased from Thermo Fisher Scientific (Waltham, MA).
Preparation of organosiloxane (OSX) polymer
OSX polymer was prepared by stirring 2.5 mL methyltrimethoxysilane (MTMS) with 0.72 mL water, 0.18 mL toluene, and 0.035 mL concentrated HCl for 15 min at room temperature. The reaction solution was cast into the wells of a 24-well polystyrene multiculture plate at various volumes, ranging from 0.75 mL to 1.5 mL, then aged and cured at room temperature for 21 h. The polymers were cut into triangles using conventional scissors. The polymer product was cleaned of any unreacted starting materials by immersion in acetonitrile for 2 h followed by immersion in water for approximately 18 h. The polymer triangles were dried under ambient conditions before use.
Sample preparation
Each drug stock solution was prepared by dissolving the drug in water. Drug-spiked urine samples were prepared by directly adding the appropriate volume of drug stock solution into urine.
Calibration curves
Standard samples of streptomycin were prepared in urine. Linear regression analysis was carried out on known added concentrations of streptomycin against the peak intensity of streptomycin to dihydrostreptomycin (internal standard). Standard samples of cocaine in urine was prepared in a similar manner, and linear regression analysis was carried out using isotope-labeled cocaine-d3 as the internal standard. The regression coefficient (R2), slope, and intercept, and equation of the resulting standard curves were determined. Calibration curves for streptomycin in urine for polymer spray, and cocaine in urine for both paper and polymer spray are presented in Supporting Information.
Polymer-Spray Mass Spectrometry
Scheme 1 is a diagram of the polymer-spray set-up. Sample volumes of 1 to 2 μL were loaded near the tip of a polymer or paper triangle. The sample droplet was dried under ambient conditions for 1 h. The tip of the polymer triangle was placed ~10 mm from the mass spectrometer inlet. All polymer materials used in the experiments were prepared by casting 1 mL of reaction volume into molds. High voltage (5 kV) was applied by connecting the back end of the triangle to the mass spectrometer’s HV power supply via a flat stainless steel alligator clip. For paper-spray experiments, Whatman Filter Paper Grade 1 (Fisher Scientific, Waltham, MA) was used and the same process used for polymer spray was used for paper spray. The spray solvent was a 1:1 (v/v) or 9:1 (v/v) combination of methanol and water with 0.1% by volume of formic acid.
Scheme 1.
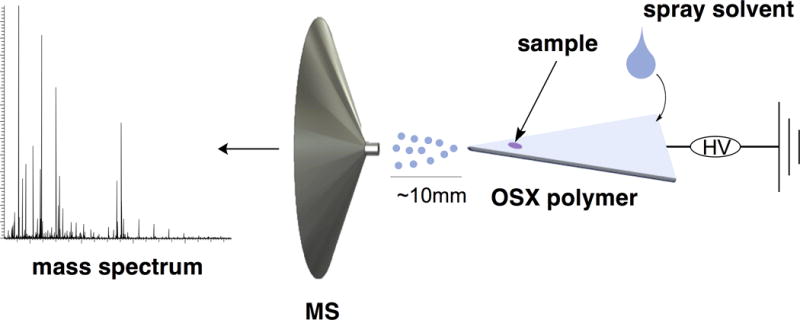
Schematic diagram of polymer-spray mass spectrometry.
Mass spectrometry was performed with an LTQ-Orbitrap XL (Thermo Fisher Scientific, Waltham, MA). Mass spectra were acquired across m/z 100 – 500 for narcotic drugs and m/z 200 – 640 for streptomycin. The capillary temperature was set to 275 °C, and the spray voltage was 5 kV. All mass spectra were acquired in positive-ion mode.
Tandem mass spectrometry (MS/MS) of streptomycin was performed on the molecular ion m/z 582.27 ([M+H]+) for structural confirmation through collision-induced dissociation (CID) with helium as the collision gas in the CID cell. The normalized collision energies were set to between 15% and 30% in the CID.
Results and Discussion
OSX polymer
A methyl-substituted alkoxysilane reagent was specifically chosen to prepare the OSX polymers because the presence of methyl groups in the polymer network produced a mechanically robust polymer that avoids shrinkage and cracking during the ambient evaporation of solvent from the polymer pores. Nakanishi et al. reported on the role that methyl groups in a sol-gel polymer play in creating a “spring back” effect unlike with polymers made with tetraalkoxysilanes that are commonly observed to crack during ambient drying.[25] Toluene served as a pore template and as a solvent to control phase separation of the polymer precursors during the hydrolysis and condensation steps of the sol-gel process. Other pore templates, such as polyethylene glycol and CTAC, used in the preparation of OSX polymers were strongly imbedded in the polymer network and could not be completely removed during the cleanup procedure. These templates strongly interfered with the mass spectrometric detection of the drug compounds and therefore they were avoided as pore templates. The hydrophobic OSX polymer used in these experiments had a water contact angle of ~95°. A drop of pure methanol deposited on the surface spread across the polymer. Because of the hydrophobic nature of the OSX polymer, spreading of an aqueous solution is minimized as compared to paper, which is hydrophilic. Figure 1 shows a comparison of the spreading of a 1-μL droplet of methylene blue in water deposited on the surface of filter paper and OSX polymer. The methylene blue-water droplet is absorbed by the filter paper, resulting in uniform distribution of the dye at the top and the back sides of the filter paper. But a similar volume appears as a small droplet on the OSX top surface, maintaining a higher surface tension in response to the hydrophobic surface of the polymer, and thereby concentrating the sample to a smaller surface area than on filter paper. Methylene blue is not observed on the back side of the OSX polymer, indicating that the dye did not penetrate through the polymer.
Figure 1.
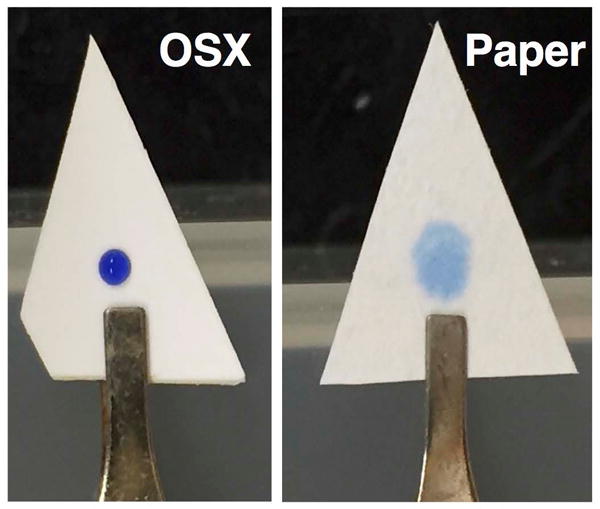
Photos of 1-μL droplet of methylene blue in water on an OSX polymer (left) and filter paper (right) taken just after deposition of the droplets.
The thickness of the polymer increased with increasing volume of reaction solution used in casting of the polymer in the molds (Table 1). However, the thickness of the polymer did not appear to affect the performance of the polymer, although more care was needed to align the thicker polymers to the inlet of the mass spectrometer.
Table 1.
Average thicknesses of OSX polymers as a function of volume of reaction solution casted.
| Sample support | Volume (mL) | Avg thickness (mm) |
|---|---|---|
| OSX | 0.75 | 0.2 (n = 1) |
| OSX | 1.0 | 0.42 ± 0.06 (n = 9) |
| OSX | 1.25 | 0.58 ± 0.07 (n = 5) |
| Paper | — | 0.1± 0.02 (n = 3) |
The polymers were characterized by scanning electron microscopy (SEM). In Figure 2A, the surface topography of the polymer is comprised of circular divots of diameters up to 10 μm. Unlike porous filter paper having an average pore size diameter of 11 μm, the exterior of the OSX polymer appears to have little macroscopic porosity. The polymer network, however, contains a range of pores with diameters up to 10 μm as seen in Figure 2B. The connectivity of the pores is unknown as it could not be determined from the SEM images. Nitrogen adsorption porosimetry measurements of OSX polymers could not provide surface area or pore volume information, indicating that the pores are very tiny and not interconnected.
Figure 2.
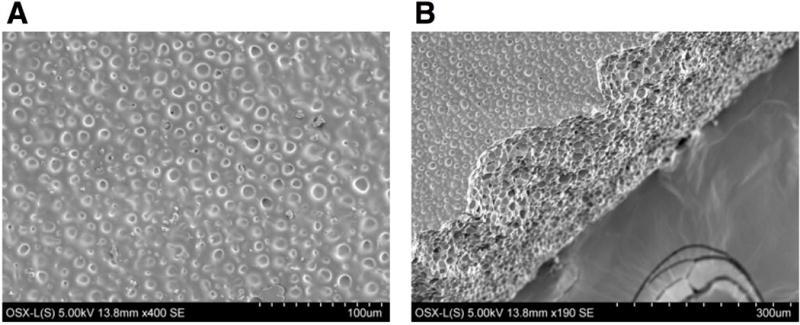
Scanning electron micrograph of OSX polymer, showing (A) the surface topography and (B) the pores within the polymer network.
Signal was produced only when the polymer was wetted with the spray solvent and voltage was applied to the polymer. A 20-μL volume of aqueous methanol spray solvent remained stationary on an OSX polymer surface in the absence of an applied spray voltage (Figure 3A). When a 5-kV voltage was applied to the wetted OSX polymer, a stable spray mist was observed from the tip of the polymer triangle as recorded by an optical camera (Figure 3B) similar to what has been observed in droplet spray ionization using a glass microscope coverslip where the spray solvent elutes along the top surface of the glass.[26] When compared to paper under the same spray conditions, the OSX polymer exhibited significantly increased signal stability. Figure 4 shows the signal of an OSX polymer lasting about 6.5 min as compared to paper where the signal decreased around 0.3 min.
Figure 3.
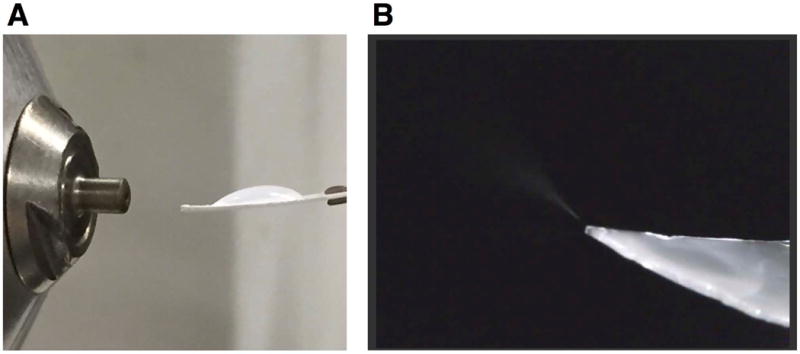
(A) OSX polymer with 20 μL of 1:1 (v/v) methanol:water spray solvent deposited on its surface and aligned in front of the inlet of the mass spectrometer without any applied spray voltage. (B) A spray mist from an OSX polymer with 20 μL of a 9:1 (v/v) methanol:water spray solvent on the polymer surface with an applied voltage of 5 kV.
Figure 4.
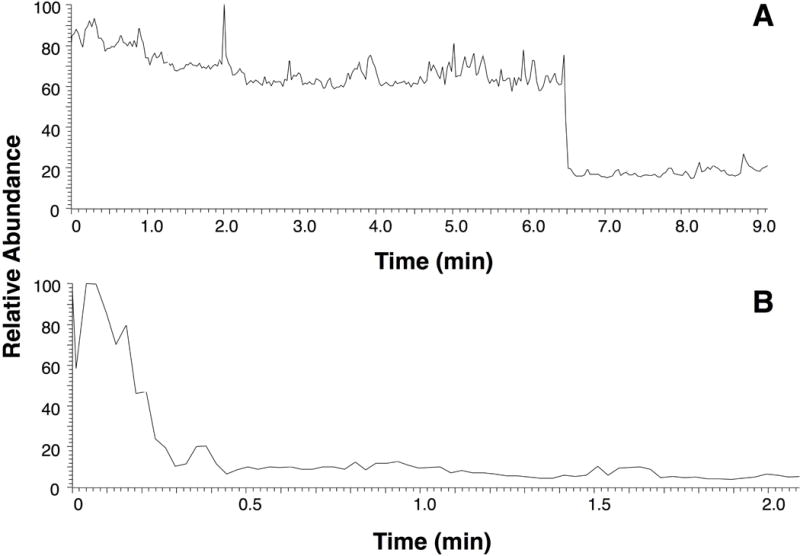
TIC showing signal stability using 20 μL spray solvent, 1:1 (v/v) methanol:water with 0.1% (v/v) formic acid for (A) OSX polymer and (B) paper. Spray voltage: 5 kV.
OSX Polymer-spray of hydrophobic narcotic drugs
Figure 5 demonstrates the utility of polymer-spray MS for the detection of seven narcotic drugs (1 – 7) and their deuterated analogs (a – g) in urine, which is achieved in less than 1 minute for 5 ng loading of each drug and deuterated drug. The repeatability of polymer spray for each narcotic drug using a hydrophobic OSX polymer triangle for each run is shown in Table 2. The response of each drug is measured as the peak intensity ratio of a drug to its deuterated analog. The RSD of response for each drug is less than 1%.
Figure 5.
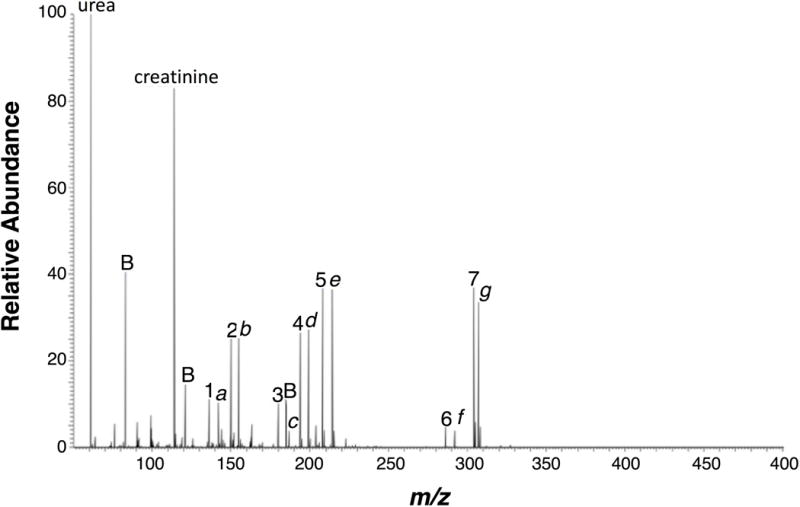
Mass spectrum of narcotic drugs (1–7) and their deuterated analogs (a–g) in urine detected by polymer spray. 9:1 (v/v) methanol:water spray solvent; 5 kV spray voltage; 1 μL sample loading. Drug compounds: 1 = amphetamine, 2 = methamphetamine, 3 = MDA, 4 = MDMA, 5 = MDEA, 6 =morphine, 7 = cocaine, a = amphetamine-d6, b = metamphetamine-d5, c = MDA-d5, d = MDMA-d5, e = MDEA-d6, f = morphine-d6, and g = cocaine-d3; Background peaks are marked by B.
Table 2.
Response (peak intensity ratio of drug:deuterated drug) for seven narcotic drugs using an OSX polymer for each run (n = 8) electrosprayed at 5 kV with 9:1 (v/v) methanol:water spray solvent with 1-μL sample loading of 5000 ng/mL concentration of each drug in urine.
| Drug | Avg Response | RSD, % |
|---|---|---|
| Amphetamine | 0.907 | 0.027 |
| Methamphetamine | 1.05 | 0.02 |
| MDA | 1.08 | 0.01 |
| MDMA | 1.14 | 0.16 |
| MDEA | 1.23 | 0.01 |
| Morphine | 1.17 | 0.23 |
| Cocaine | 0.971 | 0.006 |
Two different samples of cocaine in urine were analyzed and quantified using paper and polymer spray MS. The calibration curves obtained for both paper and polymer spray covered a linearity range of 0.033 μg/mL to 33 μg/mL of cocaine in urine. The standard curves demonstrated regression correlation coefficients (R2) of 0.999 for both paper and polymer. Analyses of cocaine in samples 1 and 2 are shown in Table 3. The analysis sensitivity of cocaine with the OSX polymer was approximately 10% better than that for paper as observed in quantitation experiments and the peak intensities higher by a factor of 2 compared to paper spray. Mean recoveries of 90.2% (RSD 10.9%) and 81.0% (RSD 6.8%) were obtained for sample 1 by polymer- and paper-spray, respectively. The calculated concentrations for cocaine in sample 2 by polymer- and paper-spray were higher in both cases, but the %RSD values were 2.7% and 29%, respectively. The favorable elution of the drugs from the OSX polymer surface, and therefore the higher analysis sensitivity of polymer spray for the quantitation of cocaine in urine may be attributed to (1) the localization of the cocaine sample to a smaller area of the polymer surface thereby concentrating the sample as compared to paper where absorption of the sample results in spreading across a wider area as seen in Figure 1 for methylene blue in water and (2) analytes may be “trapped” within the entangled cellulose fibers that comprise the highly porous paper substrate, preventing all the analytes to be sprayed into the mass spectrometer. When paper was coated with silica, improvements in the detection of pesticides in milk by paper-spray MS were reported.[14]
Table 3.
Quantitation of two samples of cocaine in urine by paper- and polymer-spray MS electropsrayed at 5 kV with 9:1 (v/v) methanol:water spray solvent.
| Substrate | Sample 1 (n = 2) μg/mL |
Sample 2 (n = 3) μg/mL |
|---|---|---|
| Paper | 13.2 ± 0.9 | 4.16 ± 1.22 |
| OSX Polymer | 14.7 ± 1.6 | 4.07 ± 0.11 |
| Actual concentration | 16.3 | 3.67 |
Qualitative analysis of streptomycin by OSX polymer spray
Hydrophobic drug compounds, such as the narcotics drugs described above, have positive logP values and are detected by both paper- and polymer-spray MS. In contrast, hydrophilic ones, such as streptomycin, have negative logP values. Streptomycin’s logP value is -6.4.[24] Unlike the narcotics, the hydrophilic streptomycin is not detected using paper-spray MS, but is detected by polymer-spray MS under the same conditions. With cellulose being a polysaccharide, its surface is dense with hydroxyl groups. It is believed that the polar groups of streptomycin interact strongly with the hydroxyl groups of the cellulose fibers, limiting their elution from the paper during the electrospray process. The hydrophobic methyl-containing OSX polymer may contain less hydroxyl groups, making for weaker affinity of streptomycin to the polymer surface, which may contribute to the more favorable elution efficiency of streptomycin in polymer-spray MS. Figure 6 shows the total-ion current (TIC) and mass spectra of 1000 μg/mL streptomycin deposited at a volume of 2 μL (2 μg loading). As seen in Figure 6, streptomycin peaks are observed when spray voltage of 5 kV is applied to OSX polymer wetted with 20 μL of 1:1 (v/v) methanol:water spray solvent: the singly and doubly charged ions, [M+2H]2+ (m/z 291.63) and [M+H]+ (m/z 582.27), arise from protonation and the singly and doubly charged ions are from the hydrated form of the aldehyde group [M+H2O+H]+ (m/z 600.28) and [M+H2O+2H]2+ (m/z 300.64), respectively.[27] The methanol adduct, [M+MeOH+H]+ (m/z 614.29) is also observed.
Figure 6.
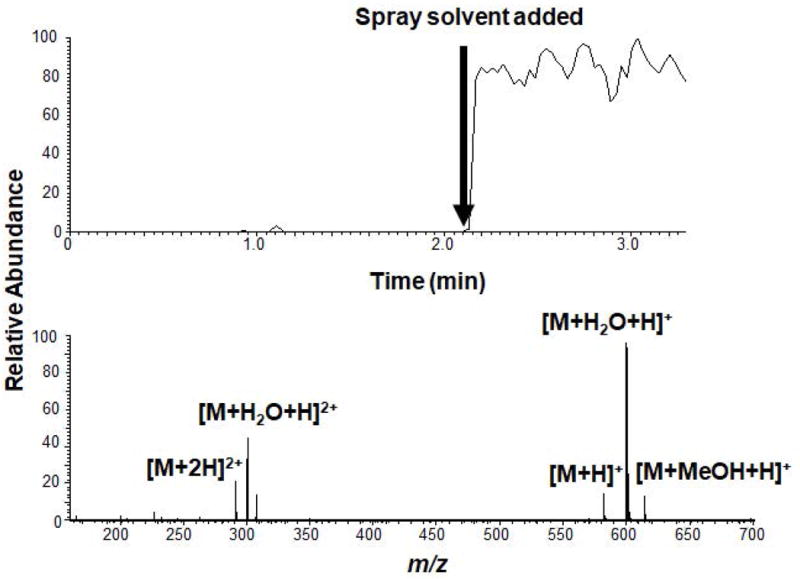
TIC and mass spectrum of a streptomycin (1000 μg/mL) in water deposited on OSX polymer. Spray solvent: 1:1 (v/v) methanol:water with 0.1% (v/v) formic acid. Spray voltage: 5 kV. Sample loading: 2 μL.
Figure 7 shows full mass spectra obtained by depositing 1 or 2 μL of a sample mixture of streptomycin (50 μg/mL) and the hydrophobic drug lidocaine (50 μg/mL, logP 2.44)[23] for comparison onto paper (Figure 7A) and OSX polymer (Figure 7B, C) and applying 5 kV spray voltage and 20 μL 1:1 (v/v) methanol:water spray solvent. In Figure 7A, the [M+H]+ peak at m/z 235.2 for lidocaine is observed, but no peaks can be attributed to streptomycin at a low sample loading of 50 ng. When the drug sample is electrosprayed using the OSX polymer, however, the streptomycin peaks are easily distinguished at sample loadings of 100 ng (Figure 7B) and 50 ng (Figure 7C): [M+H]2+ (peak 2), [M+H2O+H]2+ (peak 3), [M+H]+ (peak 4), [M+H2O+H]+ (peak 5), and [M+MeOH+H]+ (peak 6). The paper-spray mass spectrum (Figure 7A) shows many background ions that arise from the untreated filter paper, unlike what is observed in polymer-spray (Figures 7B and 7C), but it is possible to remove many of these interferences by a cleaning procedure.[28]
Figure 7.
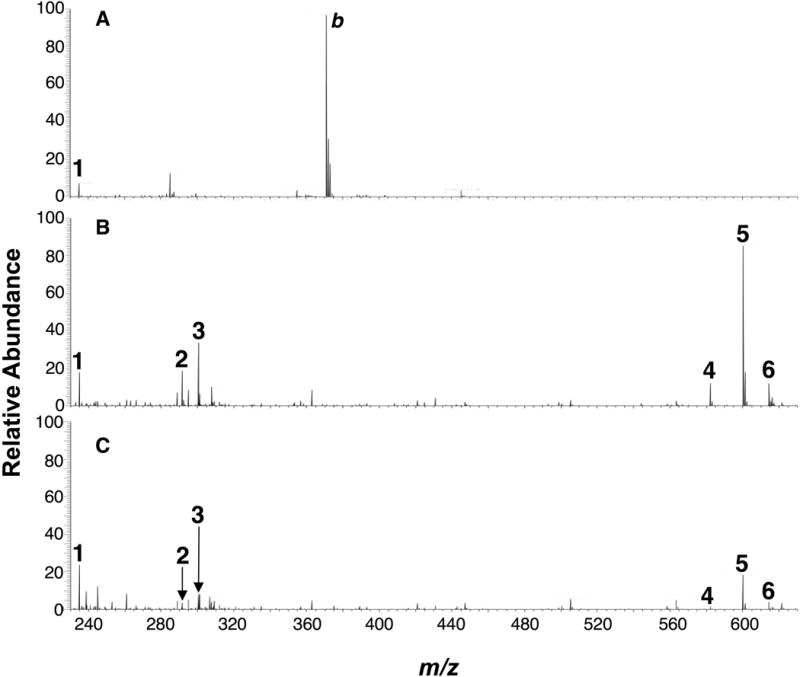
Mass spectra of a mixture of lidocaine (50 μg/mL) and streptomycin (50 μg/mL) in water deposited on (A) paper, 1 μL loading, (B) OSX polymer, 2 μL loading, and (C) OSX polymer, 1 μL loading. Lidocaine 1 [M+H]+. Streptomycin: 2 [M+H]2+, 3 [M+H2O+H]2+, 4 [M+H]+, 5 [M+H2O+H]+, 6 [M+MeOH+H]+. Background, b. Spray solvent: 1:1 (v/v) methanol:water with 0.1% (v/v) formic acid. Spray voltage: 5 kV.
The [M+H]+ (m/z 582.27) was chosen as the precursor ion for tandem mass spectrometry of streptomycin. The fragmentation of the precursor ion to form stable product ions at different collision energies is shown in Figure 8. Ring cleavage occurs at the glycosidic oxygen. The observed product ions are similar to what has been reported using liquid chromatography-tandem mass spectrometry.[27]
Figure 8.
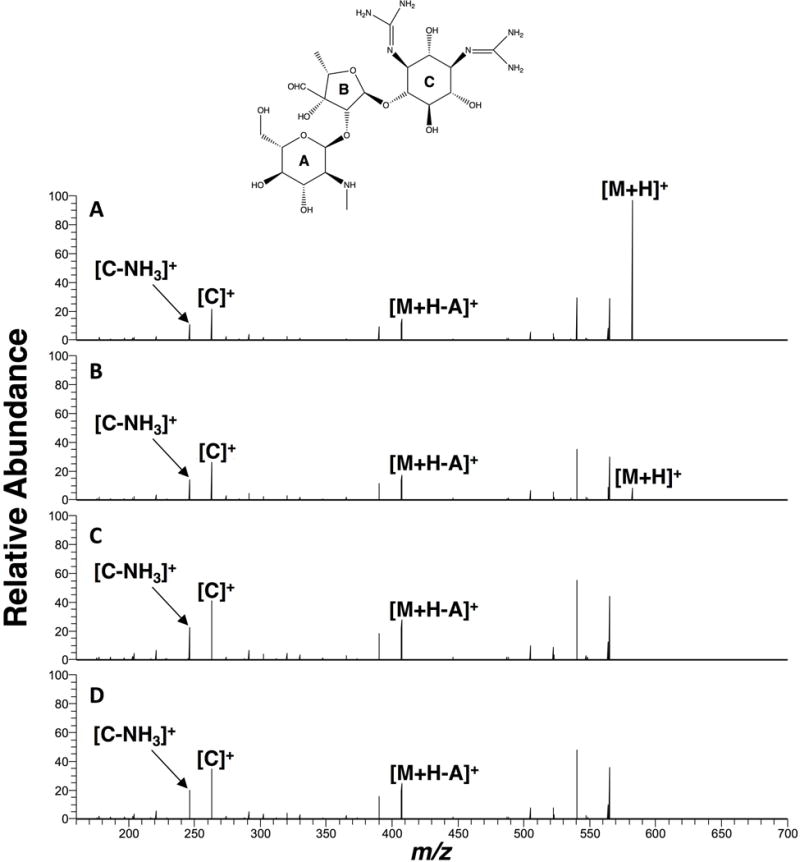
Tandem mass spectra of streptomycin (50 μg/mL) in water at normalized collision energies: (A) 15%, (B) 17%, (C) 25%, and (D) 30%. Spray solvent: 1:1 (v/v) methanol:water with 0.1% (v/v) formic acid. Spray voltage: 5 kV.
Quantitative analysis of streptomycin by OSX polymer-spray
Quantitative analysis of streptomycin in urine by polymer-spray MS was achieved using the peak intensity ratio of the [M+H]+ (m/z 582.27) to that of the corresponding [M+H]+ peak (m/z 584.29) of dihydrostreptomycin added as an internal standard. The amount of streptomycin in urine was quantified by preparing solutions spiked with streptomycin at different concentrations. The calibration curve was linear over a range of 20 μg/mL to 500 μg/mL of streptomycin in urine. The regression correlation coefficient (R2) was 0.998. The analysis of streptomycin in three urine samples is shown in Table 4. Mean recovery of streptomycin from samples 1(n=3) and 2 (n=3) were 97.5% (RSD 12.6%) and 95% (RSD 5.3%), respectively. The mean recovery from sample 3 (n=3, RSD 5.1%) was determined to be 20% higher than the actual concentration, which is the lowest concentration of the 3 samples. Of the administered dose of streptomycin for treatment of urinary tract infections, 60% to 80% of the dose is excreted in the urine within the first four hours so for a dose of 2 to 4 g/mL 25 to 5,000 μg/mL in urine can be detected.[28] A concentration of 50 μg/mL is considered to be toxic.[1]
Table 4.
Quantitation of streptomycin (m/z 582) in urine, using OSX polymer. Spray solvent: 1:1 (v/v) methanol water with 0.1% (v/v) formic acid. Spray voltage: 5 kV. Sample loading: 1 μL. Dihydrostreptomycin as internal standard (m/z 584).
| Substrate | Sample 1 (n=3) μg/mL |
Sample 2 (n=3) μg/mL |
Sample 3 (n=3) μg/mL |
|---|---|---|---|
| OSX | 39.0 ± 4.9 | 28.5 ± 1.5 | 31.3 ± 1.6 |
| Actual concentration | 40 | 30 | 25 |
Conclusions
We have shown that an organosiloxane polymer is effective as a sample substrate and ESI emitter in the analysis of drug samples without pretreatment by electrospray mass spectrometry. When compared to paper, organosiloxane polymer substrates allow for mass spectra of a hydrophilic drug at low concentrations not detectable with paper-spray MS. Organosiloxane polymers achieve better sensitivity analysis, allowing for more accurate quantitation of both hydrophobic and hydrophilic drug compounds. The ability to tailor the polymer polarity and porosity allows for the synthesis of a wide range of polymers, and thus opens many possibilities for further development and applications.
Supplementary Material
Acknowledgments
We thank A.C. Mody for help with the MS measurements. This project was supported by the National Institutes of Health STTR award no. 1R41 GM113337-01and National Institutes of Health award no. R01 MH112188.
References
- 1.Mitic SS, Miletic GZ, Kostic DA, Rasic ID. A spectrophotometric study of streptomycin effect on the clinical urea determination. Chin J Chem. 2011;29:135–142. [Google Scholar]
- 2.Streptomycin. Drugs.com website. https://www.drugs.com/pro/streptomycin.html. Accessed June 28, 2017.
- 3.Brown K, Zaytsoff SJM, Uwiera RRE, Inglis GD. Antimicrobial growth promoters modulate host response in mice with a defined intestinal microbiota. Scientific Reports. 2016;6:1–13. doi: 10.1038/srep38377. [DOI] [PMC free article] [PubMed] [Google Scholar]
- 4.Buszewski B, Noga S. Hydrophilic interaction liquid chromatography (HILIC) – a powerful separation technique. Anal Bioanal Chem. 2012;402(1):231–247. doi: 10.1007/s00216-011-5308-5. [DOI] [PMC free article] [PubMed] [Google Scholar]
- 5.Notari S, Mancone C, Sergi M, Gullotta F, Bevilacqua N, Tempestilli M, Urso R, Lauria FN, Pucillo LP, Tripodi M, Ascenzi P. Determination of antituberculosis drug concentration in human plasma by MALDI-TOF/TOF. Life. 2010;62(5):387–393. doi: 10.1002/iub.321. [DOI] [PubMed] [Google Scholar]
- 6.So PK, Hu B, Yao ZP. Electrospray ionization on solid substrates. Mass Spec (Tokyo) 2014;3:S0028. doi: 10.5702/massspectrometry.S0028. [DOI] [PMC free article] [PubMed] [Google Scholar]
- 7.Wang H, Liu J, Cooks RG, Ouyang Z. Paper spray for direct analysis of complex mixtures using mass spectrometry. Angew Chem Inter Ed. 2010;49:877–880. doi: 10.1002/anie.200906314. [DOI] [PubMed] [Google Scholar]
- 8.Liu J, Wang H, Manicke NE, Lin JM, Cooks RG, Ouyang Z. Development, characterization, and application of paper spray ionization. Anal Chem. 2010;82(6):2463–2471. doi: 10.1021/ac902854g. [DOI] [PubMed] [Google Scholar]
- 9.Shen L, Zhang J, Yang Q, Manick NE, Ouyang Z. High throughput paper spray mass spectrometry analysis. Clinica Chem Acta. 2013;420:28–33. doi: 10.1016/j.cca.2012.10.025. [DOI] [PubMed] [Google Scholar]
- 10.Manicke NE, Bills BJ, Zhang C. Analysis of biofluids by paper spray MS: advances and challenges. Bioanalysis. 2016;8(6):589–606. doi: 10.4155/bio-2015-0018. [DOI] [PubMed] [Google Scholar]
- 11.Chipuk JE, Gelb MH, Brodbelt JS. Surface-enhanced transmission mode desorption electrospray ionization: increasing the specificity of ambient ionization mass spectrometric analysis. Anal Chem. 2010;81(1):16–18. doi: 10.1021/ac902101e. [DOI] [PMC free article] [PubMed] [Google Scholar]
- 12.Pasilis SP, Kertesz V, Van Berkel GJ. Surface scanning analysis of planar arrays of analytes with desorption electrospray ionization-mass spectrometry. Anal Chem. 2007;79(15):5956–5962. doi: 10.1021/ac070527v. [DOI] [PubMed] [Google Scholar]
- 13.Maher S, Jjunju FPM, Damon DE, Gorton H, Maher YS, Syed SU, Heeren RMA, Young IS, Taylor S, Badu-Tawiah AK. Direct analysis and quantification of metaldehyde in water using reactive paper spray mass spectrometry. Scientific Reports. 2016;6:35643. doi: 10.1038/srep35643. [DOI] [PMC free article] [PubMed] [Google Scholar]
- 14.Wang Q, Zheng Y, Zhang Z, Han X, Wang T, Zhang Z. A silica coated paper substrate: development and its application in paper spray mass spectrometry for rapid analysis of pesticides in milk. Analyst. 2015;140:8048–8056. doi: 10.1039/c5an01823d. [DOI] [PubMed] [Google Scholar]
- 16.Ren Y, Wang H, Liu J, Zhang Z, McLuckey MN, Ouyang Z. Analysis of biological samples using paper spray mass spectrometry: an investigation of impacts by the substrates, solvents and elution methods. Chromatographia. 2013;76(19–20):1339–1346. doi: 10.1007/s10337-013-2458-y. [DOI] [PMC free article] [PubMed] [Google Scholar]
- 17.Damon DE, Maher YS, Yin M, Jjunju FPM, Young IS, Taylor S, Maher S, Badu-Tawaih AK. 2D wax-printed paper substrates with extended solvent supply capabilities allow enhanced ion signal in paper spray ionization. Analyst. 2016;14:3866–3873. doi: 10.1039/c6an00168h. [DOI] [PubMed] [Google Scholar]
- 18.Han F, Yang Y, Ouyang J, Na N. Direct analysis of in-gel proteins by carbon nanotubes-modified paper spray ambient mass spectrometry. Analyst. 2015;140:710–715. doi: 10.1039/c4an01688b. [DOI] [PubMed] [Google Scholar]
- 19.Narayanan R, Sarkar D, Cooks RG, Pradeep T. Molecular ionization from carbon nanotube paper. Angew Chem Int Ed. 2014;53:5936–5940. doi: 10.1002/anie.201311053. [DOI] [PubMed] [Google Scholar]
- 20.Zheng Y, Zhang X, Yang H, Liu X, Zhang X, Wang Q, Zhang Z. Facile preparation of paper substrates coated with different materials and their applications in paper spray mass spectrometry. Anal Methods. 2015;7:5381–5386. [Google Scholar]
- 21.Zhang Z, Xu W, Manicke NE, Cooks RG, Ouyang Z. Silica coated paper substrate for paper-spray analysis of therapeutic drugs in dried blood spots. Anal Chem. 2012;17:931–938. doi: 10.1021/ac202058w. [DOI] [PMC free article] [PubMed] [Google Scholar]
- 22.Damon DE, Davis KM, Moreira CR, Capone P, Cruttenden R, Badu-Tawiah AK. Direct biofluid analysis using hydrophobic paper spray mass spectrometry. Anal Chem. 2016;88(3):1878–1884. doi: 10.1021/acs.analchem.5b04278. [DOI] [PubMed] [Google Scholar]
- 23.Danks AE, Hall SR, Schnepp Z. The evolution of ‘sol-gel’ chemistry as a technique for materials synthesis. Mater Horiz. 2016;3:91–112. [Google Scholar]
- 24.Drugbank Version 5.0 website. https://www.drugbank.ca. Accessed June 28, 2017.
- 25.Hayase G, Kanamore K, Fukuchi M, Kaji H, Nakanishi K. Facile synthesis of marshmallow-like macroporous gels usable under harsh conditions for the separation of oil and water. Angew Chem Int Ed. 2013;52:1986–1989. doi: 10.1002/anie.201207969. [DOI] [PubMed] [Google Scholar]
- 26.Jiang J, Zhang H, Li M, Dulay MT, Ingram AJ, Li N, You N, Zare RN. Droplet spray ionization from a glass microscope slide: real-time monitoring of ethylene polymerization. Anal Chem. 2015;87:8057–8062. doi: 10.1021/acs.analchem.5b02390. [DOI] [PubMed] [Google Scholar]
- 27.Alechaga E, Moyano E, Galceran MT. Simultaneous analysis of kasugamycin and streptomycin in vegetables by liquid chromatography-tandem mass spectrometry. Anal Methods. 2015;7:3600–3607. [Google Scholar]
- 28.Su Y, Wang H, Liu J, Wei P, Cooks RG, Zheng O. Quantitative paper spray mass spectrometry analysis of drugs of abuse. Analyst. 2013;138(16):4443–4447. doi: 10.1039/c3an00934c. [DOI] [PMC free article] [PubMed] [Google Scholar]
- 28.Hewitt WL. Treatment of urinary tract infections with streptomycin. The Am J Med. 1947;2(5):474–484. doi: 10.1016/0002-9343(47)90093-4. [DOI] [PubMed] [Google Scholar]
Associated Data
This section collects any data citations, data availability statements, or supplementary materials included in this article.


