

SUMMARY
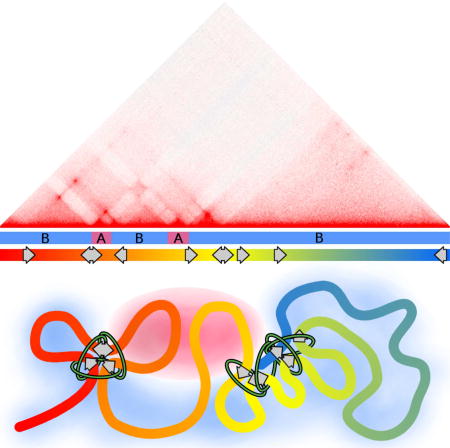
TADs, CTCF loop domains, and A/B compartments have been identified as important structural and functional components of 3D chromatin organization, yet the relationship between these features is not well understood. Using high-resolution Hi-C and HiChIP we show that Drosophila chromatin is organized into domains we term compartmental domains that correspond precisely with A/B compartments at high resolution. We find that transcriptional state is a major predictor of Hi-C contact maps in several eukaryotes tested, including C. elegans and A. thaliana. Architectural proteins insulate compartmental domains by reducing interaction frequencies between neighboring regions in Drosophila, but CTCF loops do not play a distinct role in this organism. In mammals, compartmental domains exist alongside CTCF loop domains to form topological domains. The results suggest that compartmental domains are responsible for domain structure in all eukaryotes, with CTCF playing an important role in domain formation in mammals.
Keywords: CTCF, TAD, compartment, Hi-C, epigenetics, transcription, insulator, loop
Graphical abstract
INTRODUCTION
The development of Hi-C has enabled the examination of the 3D chromatin conformation of an entire genome. The first Hi-C analyses of mammalian genomes provided low resolution (ca. 1 Mb) contact maps revealing a plaid pattern of interactions representing active A and inactive B compartments (Lieberman-Aiden et al., 2009). Subsequent higher resolution Hi-C experiments (ca. 50 kb) identified topologically associating domains (TADs), which are contiguous segments of the genome that preferentially interact whithin themselves over neighboring regions (reviewed in Rowley and Corces, 2016). TADs in mammals have an average size between 200 kb and 1 Mb and were originally described as related to, but independent of, compartments (Dixon et al., 2012). Using high resolution (ca. 1 kb) data, Lieberman Aiden and collaborators defined contact domains smaller in size than TADs (Rao et al., 2014). Borders of a subset of these smaller contact domains were found to interact preferentially over the rest of the domain creating a “peak” or more intense spot in the Hi-C contact map (Rao et al., 2014). These Hi-C peaks correlate with the presence of the architectural protein CTCF, suggesting that many of these contact domains are CTCF loops (Rao et al., 2014). Strikingly, the orientation of the CTCF motif appears to determine the direction in which CTCF sites will form loops, with convergently oriented CTCF motifs highly enriched at the anchors of CTCF loops (Guo et al., 2015; Rao et al., 2014). Contact domain boundaries often correspond to CTCF loop anchors, but some do not, suggesting that principles other than CTCF-mediated interactions may also govern the establishment of contact domains (Rao et al., 2014).
TADs have also been identified in Drosophila, but the low resolution of Hi-C data in early studies has limited the precision with which these domains can be mapped and identified (Hou et al., 2012; Sexton et al., 2012). Broadly, TAD borders defined at 10 kb resolution were reported to be enriched in clusters of architectural protein binding sites (APBSs) (reviewed in Rowley and Corces, 2016). APBSs are often associated with promoters of highly expressed genes, suggesting a possible relationship between transcription and TAD border formation (Hou et al., 2012; Van Bortle et al., 2014). Several studies have found that boundaries/inter-TAD regions correlate with active chromatin (El-Sharnouby et al., 2017; Hug et al., 2017; Ulianov et al., 2016). However, whether active regions exhibit their own structure or are simply boundaries between TADs is a matter of debate due to the low resolution of currently available Hi-C datasets. Patterns of 3D chromatin organization identified in mammals and Drosophila have been found to be applicable to other model organisms. Contact domains of varying size have been found in S. pombe, S. cerevisiae, C. elegans, and A. thaliana (reviewed in Rowley and Corces, 2016). These organisms have no known CTCF homologs yet they can form distinct domains reminiscent of those seen in humans. The mechanisms responsible for the establishment of contact domains in these organisms are not known, and it is unclear whether conserved processes are involved in the formation of domains of different sizes and strengths across the evolutionary tree.
High resolution (ca. 250 bp) Here we show that high resolution (ca. 250 bp) Hi-C data in D. melanogaster suggest the existence of domains, which we term compartmental domains, smaller in size than the TADs defined originally. Distinct from mammals, we find no evidence of looping mediated by CTCF or other architectural proteins between borders of these domains. Using HiChIP and ChIA-PET for histone modifications and RNA Polymerase II (RNAPII), we find that domains are a direct result of the establishment of A/B compartments defined by the chromatin state of their interior rather than by a border element. This principle also applies to other eukaryotic organisms. Furthermore, we show that mammalian chromosome organization is established via a combination of compartmental domains and point-to-point CTCF interactions, leading to the formation of distinct but often overlapping domains. We conclude that compartmental domains represent the primary mechanism underlying 3D chromatin organization in eukaryotes but that architectural proteins, especially CTCF, are responsible for additional point-to-point interactions that establish the complex 3D architecture of the mammalian nucleus.
RESULTS
Compartmental Domains Are the Main Feature of Drosophila Chromatin Organization
Studies of Drosophila 3D chromatin organization have identified TADs that are smaller than typical mammalian TADs (Sexton et al., 2012). To gain further insights into the principles controlling the establishment of 3D chromatin organization in D. melanogaster, we combined Hi-C datasets acquired in Kc167 cells to obtain nearly a billion uniquely mapped reads (Cubeñas-Potts et al., 2016). In comparison to the ultra-high resolution Hi-C dataset in humans (Rao et al., 2014), this is equivalent to 12-fold higher contacts at short distances (<10kb) (Figure S1A). The high resolution Hi-C map exhibits a clear checkerboard pattern reminiscent of A/B compartments originally found in humans at 1 Mb resolution (Lieberman-Aiden et al., 2009), but is evident in Drosophila in 10 kb resolution Pearson correlation maps (Figure 1A). To classify these compartments we used a principal component analysis (eigenvector decomposition) of the Pearson correlation matrix (Lieberman-Aiden et al., 2009) at 10 kb resolution (Figure 1A, right panel). In mammals, A (active) compartments have high levels of transcriptional activity, chromatin accessibility, and active histone modifications. To test if this is also the case in Drosophila, we performed Fast-ATAC-seq (Corces et al., 2016) and examined GRO-seq data. We find that A compartments have higher transcription and chromatin accessibility than B compartments (Figure 1B, S1BC). Next, we performed ChIP-seq for seven different histone modifications/variants, including H3K36me3, H4K16ac, H4K20me1, H3K9me3, ubiquitinated H2B (H2Bub), H3.3, and H2A.Z. We also examined previously published ChIP-seq data for H3K27ac, H3K27me3, H3K4me1, H3K4me3, and H3K9me2. We found that the eigenvector closely follows the switch between active and inactive histone modifications (Figure 1B). We tested the relative levels of histone modifications across the compartments and found that the two compartments generally partition active from inactive chromatin (Figure 1C, S1D) which is similar to the partitioning of A and B compartments observed in mammals (Lieberman-Aiden et al., 2009).
Figure 1. Drosophila has Fine-Scale Compartments.

A. Left: Normalized Hi-C map of Kc167 cells at 10 kb resolution. Right: Pearson Correlation matrix of Hi-C. The eigenvector and H3K27ac and H3K27me3 ChIP-seq are above the Hi-C plot.
B. ChIP-seq for 12 different histone modifications, ATAC-seq, and GRO-seq compared to the Hi-C eigenvector. A slice of the distance normalized Hi-C matrix (observed/expected) is shown corresponding to Chr3R:12.5 Mb – 15.5 Mb (horizontal) and Chr3R:12.5 Mb-13.5 Mb (vertical).
C. Active and inactive chromatin correspond to A and B compartments. Average histone modification profiles over A and B compartments. Color coding of ChIP-seq for histone modifications/variants is indicated.
D. Compartmental interactions defined by HiChIP. Contact map showing differential contacts for H3K27ac vs H3K27me3 HiChIP visualized by Juicebox.
See also Figures S1 and Table S1–S2.
Upon examination of compartments in Drosophila, we noticed several locations with visibly evident compartment switches in the Hi-C heatmap that are unidentified by the standard algorithm (Figure S1E), and thus sought an alternate method to better characterize these fine-scale compartments. Since H3K27ac and H3K27me3 show the most pronounced distinction between A and B compartments (Figure 1C, S1F), we performed HiChIP (Mumbach et al., 2016) using antibodies for these two histone modifications (Table S1–S2). We chose these histone modifications not only because of their close correspondence to A and B compartments, but because of their prevalence in the Drosophila genome, such that nearly every 1 kb bin has either H3K27ac or H3K27me3 (Figure 1B, S1G). H3K27me3 is absent at H3K27ac peaks, is highly enriched at Pc-repressed loci, and shows an intermediate level of enrichment in the rest of the genome (Figure 1B), a feature that has also been reported by others (El-Sharnouby et al., 2017). We found that HiChIP for H3K27ac or H3K27me3 effectively enriched for A or B compartments respectively (Figure 1D, S1H). We next classified compartments at 10 kb resolution using the ratio of interactions from H3K27ac HiChIP versus H3K27me3 HiChIP datasets, and found that the result closely matches the Hi-C eigenvector obtained from principal component analysis. However, the compartment calls obtained using HiChIP data allow the discovery of small compartments that were previously undetected by the Hi-C eigenvector (Figure S1E). Because we found that either H3K27ac or H3K27me3 occupy most of the genome, we then tested how well the HiChIP contact maps recapitulate the full Hi-C data. We combined reads obtained from H3K27ac and from H3K27me3 HiChIP into a single contact map and found a 98.9% correlation with Hi-C data (Figure S1IJ). Altogether this indicates that HiChIP for these two histone modifications, when combined, can recapitulate Hi-C data, but when used separately can accurately capture compartmental interactions.
Compartments were originally identified in humans at 1 Mb resolution (Lieberman-Aiden et al., 2009) which has led to the notion that compartments are structures encompassing large swaths of the genome. In Drosophila, however, we have identified small compartments at 10 kb resolution, indicating that compartments are actually fine-scale features of chromatin organization. We further tested the scalability of compartments by calling compartments at 1 kb resolution. This provided an overall good correspondence between calls at 1 kb and 10 kb resolution, although 1 kb resolution calls afford better identification of some small compartments (Figure S1K). This indicates that compartments represent small, discrete, and scalable interactions that occur between loci with correlated chromatin and transcriptional activity states. We will refer to these domains as compartmental domains in the rest of the manuscript.
Drosophila Domain Organization is not a Result of CTCF Looping
High resolution Hi-C contact maps in mammals have shown the presence of strong point-to-point interactions, manifested as bright spots in Hi-C heatmaps, that correspond to CTCF loops at contact domain corners (Rao et al., 2014) (Figure 2A). High resolution Hi-C contact maps in Drosophila also show the presence of what appear to be similar spots that seem to correspond to interactions between borders of domains (Figure 2B). However, we find that the signal corresponding to these interactions is not punctate; instead, it extends beyond the corners of individual domains (blue arrowheads in Figure 2B left; see also the magnified view in the right panel). This signal in fact corresponds to compartmental interactions between small flanking domains (Figure 2B right). Detection of these domains requires very high resolution Hi-C maps, explaining why previous studies have misidentified these domains as TAD borders and their interactions as loops formed by interactions between boundaries of TADs. Visualization of these domains in Drosophila also requires heatmaps at a smaller genomic scale than in humans due to their differences in size (Figure 2AB). Similar to CTCF loops found in human cells, we also found 458 interaction peaks in Drosophila enriched in various architectural proteins, but unlike in humans, we did not see an enrichment of CTCF at the anchors of these loops (Cubeñas-Potts et al., 2016; Rao et al., 2014). Importantly, these interaction peaks do not occur at domain corners (Figure S2A). Altogether, these data indicate that domains in Drosophila are likely not the result of the establishment of point-to-point interactions by CTCF or other architectural proteins.
Figure 2. Compartments Explain Domain Organization in Drosophila.

A. Contact domains in human cells show enriched interaction signal between borders (arrowheads). Normalized Hi-C map of GM12878 cells at 5 kb resolution.
B. Contact domains in Drosophila do not show enriched interaction signal between borders (arrowheads). Normalized Hi-C map of Kc167 cells at 5 kb resolution (left) and 500 bp resolution (right). The A/B compartmental interactions computed by H3K27ac vs H3K27me3 HiChIP are shown above. Lines indicate borders.
C. Human CTCF motif orientation has a directional bias, while Drosophila does not. Total interactions as log2 ratio of right/left reads for each distance on right (red) or left (blue) oriented bound CTCF motifs in GM12878 cells (top) or Kc167 cells (bottom).
D. HiChIP for phosphorylated RNAPIISer2 captures active compartments. Raw HiChIP signal for phosphorylated RNAPIISer2 (red) overlaying Hi-C signal (blue). Gene annotations, GRO-seq, H3K27ac, and H3K27me3 ChIP-seq are shown below. 1 kb HiChIP indicates H3K27ac/H3K27me3 HiChIP compartmental interaction preference.
E. Individual genes can form mini-domains. RNAPII ChIA-PET signal in 1 kb bins (top right). Hi-C signal in 1 kb bins (bottom left). GRO-seq and gene annotations are shown above.
F. Distance normalized Hi-C signal at 1 kb resolution is plotted between distinct transcription start sites (TSSs) within the same compartment. Height and color (blue to red) correspond to the relative median observed/expected Hi-C signal. Nodes indicate 1 kb windows from −5 kb to +5 kb surrounding the TSS. Expression level defined by no GRO-seq signal (No Expression) and quartiles of GRO-seq signal. p-value < .05 for each center point (Wilcoxon test compared to no GRO-seq).
G. Transcriptional states correspond to Hi-C domains. Transcriptional state domains identified by GRO-seq (black triangles) overlaying Kc167 Hi-C at 1 kb resolution. GRO seq and gene annotations are shown below. 1 kb HiChIP indicates compartmental interaction preference.
See also Figure S2–S3 and Table S3.
In human cells, interaction peaks at some domain corners occur between convergently oriented CTCF sites (Rao et al., 2014). We thus examined Drosophila Hi-C data to determine whether the orientation of the CTCF binding motif influences contact domain structure without the need for strongly stabilized boundary associated CTCF loops. We found that only 28% of domains have CTCF within 3 kb of each border. Of those that have CTCF, there is no evidence for motif orientation preference, in contrast to CTCF borders in human cells (Figure S2B). Additionally, the relationship between human CTCF motif orientation and the interaction preference can be visualized at bound CTCF motifs where Hi-C interactions preferentially occur in the same direction as the motif orientation. In humans, right facing CTCF sites preferentially interact with other genomic sequences to the right along a chromosome (Figure 2C red) and left facing CTCF sites interact to the left (Figure 2C blue). We performed this same analysis in Drosophila to test if interactions at CTCF bound motifs follow the same rule. In contrast to humans, Drosophila CTCF sites show no directional preference when interacting with other sites along the chromosome (Figure 2C bottom). Overall, this indicates that Drosophila domains can form without stabilized point-to-point border interactions between CTCF sites, and that Drosophila’s CTCF differs fundamentally in its function from the human homolog.
Gene Mini-Domains Underlie Drosophila Chromatin Organization
Sequences located between large domains appear to be small active domains (Figure 2B and S1E). To explore this further, we examined published TAD calls and found that small domains have been consistently misclassified by previous studies due to the low resolution of the Hi-C maps available. For example, TAD calls at low resolution in Drosophila frequently labeled small domains as TAD borders (Hou et al., 2012; Sexton et al., 2012) (Figure S2C). Other attempts at domain calling at low resolution labeled many of these domains as inter-TAD regions (Ulianov et al., 2016). More recently, TAD borders identified in nuclear cycle 14 staged embryos correlated with RNAPII (Hug et al., 2017) correspond in fact to small domains and RNAPII is not present at borders between TADs but it is present throughout every active compartmental domain (Figure S2DE). Thus, we find that borders are not defined by transcriptionally active regions/RNAPII binding as was previously suggested (Hug et al., 2017; Ulianov et al., 2016), but rather by the segregation between active and inactive regions that form compartmental domains, suggesting that this is the prevalent mechanism of domain formation in Drosophila (Figure S2F). We therefore refer to these domain structures along the diagonal as compartmental domains as described above because they coincide with the A/B compartments defined by Principal Component Analysis.
Small transcriptionally active domains interact to the exclusion of the larger silent or intergenic regions of the genome in a compartmental manner. We tested whether these interactions are associated directly with transcriptional elongation by performing HiChIP with an antibody for RNA Polymerase II phosphorylated on serine 2 (RNAPIISer2ph) (Table S3). We found that the small active compartments found by Hi-C are highly enriched in RNAPIISer2ph HiChIP signal (Figure 2D, S3AB). Closer examination of these data indicates the presence of even smaller domains comprised of individual genes (Figure S3C top right). Because an enrichment of interactions is seen within the gene body we call these structures gene mini domains. To further confirm these findings, we also performed ChIA-PET for RNAPII and found similar gene mini-domains (Figure 2E top right, S3D–F). Hi-C also shows the presence of domains that coincide precisely with a single actively transcribed gene (Figure 2E, S3C–E; see panels below the diagonal). Because we found that active compartments are composed of RNAPII interactions in gene mini-domains, we propose that interactions within and between A compartmental domains are composed of gene-to-gene interactions. We took genes at each expression level (no expression and lowest to highest quartiles of GRO-seq signal) and found that gene-to-gene interactions in A compartments correlate with expression (Figure 2F). These observations suggest that active compartmental domains are created in a hierarchical manner by gene mini-domains and gene-to-gene interactions.
The correlation between transcription, compartmental interactions, and domain formation suggests that transcriptional activity may be a good measure of domain structure in Drosophila. To test this, we used a hidden Markov model (HMM) to classify the genome into active and inactive states based on GRO-seq levels. We find that borders between domains observed using Hi-C form precisely at transcription switches (Figure S3G). We overlaid the GRO-seq transcriptional states on the Hi-C contact map and find a precise correlation with Hi-C contact domains at 1 kb resolution (Figure 2G). This indicates that domains are not formed by some feature of borders, but by the segregation between transcriptional states of neighboring domains. Domains identified by this method are similar in size to compartmental domains identified by high resolution Hi-C (Figure S3H). The small size of domains in Drosophila would cause them to appear as one or two bins along the diagonal in the 20 kb resolution matrix that was originally used to identify TADs, which may account for the inaccurate border identification mentioned above. Altogether these data indicate that transcriptional or chromatin state plays a prominent role in 3D chromatin organization at the gene level in D. melanogaster. Additionally, compartments are not multi-megabase features of chromatin organization, but are composed of gene-to-gene interactions. Perhaps most surprisingly, compartments and domains do not represent separate features of 3D chromatin organization in Drosophila, as is generally thought to be the case in mammals. Rather, the formation of compartments is responsible for the establishment of all domains in the Drosophila genome.
RNAPII Occupancy Inside Domains Affects Drosophila Chromatin Organization
Since transcriptional state and domain organization are highly correlated, we tested whether inhibition of transcription affects formation of compartmental domains. Triptolide inhibits transcription initiation and heat shock results in widespread repression of transcription in Drosophila (Li et al., 2015). Hi-C heatmaps at 10 kb resolution from triptolide-treated cells display decreased signal inside compartmental domains (Figure 3AB). The decrease in domain architecture appears more pronounced in cells subjected to heat shock than triptolide treatment, although both result in transcription silencing of most or all genes (Figure 3AB). We therefore examined the levels of RNAPII after each treatment and found that heat shock results in a more pronounced decrease of RNAPII levels than triptolide treatment, consistent with its more substantial effect on compartmental domain interactions (Figure S4AB). Active domains showed a greater decrease in interaction frequency than inactive domains (Figure 3C). Triptolide treatment also results in an increase in A-B and B-B contacts, but a decrease in A-A contacts, especially at triptolide sensitive domains (Figure 3F). When the activity state of A domains decreases to more closely resemble the activity of B domains, segregation and domain structure of both A and B compartments is reduced. We then examined active domains with a >= 2 fold change in RNAPII ChIP-seq signal across the domain, which we term triptolide sensitive domains. Upon treatment, these domains showed a greater decrease in Hi-C signal than other active domains (Figure 3DE), suggesting that RNAPII level is an important factor influencing domain architecture.
Figure 3. RNAPII Depletion Alters Drosophila Chromatin Organization.

A. Heat shock decreases domain formation. Hi-C heatmap of log2 ratio of heat shocked to control cells (CTL). Gene annotations, control and heat shocked RNAPII ChIP-seq signal are shown above. 1 kb HiChIP indicates compartmental interaction preference.
B. Inhibition of transcription decreases domain formation. Hi-C heatmap of log2 ratio of triptolide treated (TRP) to control cells (CTL). Gene annotations, control and triptiolide treated RNAPII ChIP-seq signal are shown above. 1 kb HiChIP indicates compartmental interaction preference.
C. Inhibiting transcription decreases contacts in A compartmental domains. Hi-C median metaplot comparing contacts in A and B domains in triptolide treated (TRP) vs control cells (CTL).
D. Hi-C median metaplot A compartmental domains with large decreases in RNAPII after triptolide treatment; i.e. triptolide sensitive domains (TSDs).
E. Decreases in intra-domain contacts in A and B compartments and in triptolide sensitive domains (TSD) after triptolide treatment. Boxes depict median and interquartile range.
F. Ratio of inter-compartmental contact counts in triptolide (TRP) vs control (CTL) treated cells. Boxes depict median and interquartile range.
G. Ratio of RNAPII ChIP-seq or ATAC-seq signal in triptolide sensitive domains (TSDs) or other A compartmental domains (nonTSDs). Boxes depict median and interquartile range.
See also Figure S4.
Treatment of Drosophila embryos during the zygotic genome activation stage with triptolide has been recently shown to affect the structure of domains observed by Hi-C (Hug et al., 2017). We compared the extent of reduction in domain structure observed in nc14 embryos with our data in Kc167 cells. Kc167 cells were treated with 10 µM triptolide for 3 hr while nc8-nc14 embryos were treated with 1.8 µM triptolide for roughly 1.5 hr (Hug et al., 2017; Li et al., 2015). We find that nc14 embryos display a smaller decrease in domain structure than Kc167 cells under these conditions (Figure S4CD). We then examined results from RNAPII ChIP-seq experiments performed in each of the two conditions and found that the extended triptolide treatment in Kc167 cells had a greater effect on RNAPII binding than in nc14 embryos (Figure S4EF). The 3 hr treatment with 10 µM triptolide of Kc167 cells resulted in at least a two-fold change in about 69% of RNAPII peaks, while treatment with 1.8 µM triptolide of nc14 embryos affected only about 29% of RNAPII peaks. Therefore, the greater decrease in domain structure observed in Kc167 cells correlates with a larger reduction in RNAPII occupancy, supporting the conclusion that transcription or RNAPII and/or its associated factors are important for the establishment of compartmental domains in Drosophila. The effect of triptolide treatment on chromatin organization correlates with its effect on RNAPII occupancy, although it is possible that triptolide treatment alters more than just RNAPII. To test whether triptolide affects transcription factor occupancy at non-promoter sites, we performed ATAC-seq in triptolide-treated cells and examined non-TSS (± 100 bp) associated subnucleosomal size fragments. We did not see loss of ATAC-seq signal in triptolide sensitive domains (Figure 3G, S4G). This implicates RNAPII and associated proteins, rather than factors binding at distal regulatory sequences, as having a prominent role in domain organization.
Architectural Proteins Act as Insulators in Domain Segregation
It was previously reported that TAD boundaries defined with low resolution Hi-C data were enriched in active chromatin and APBSs (Hou et al., 2012; Sexton et al., 2012; Van Bortle et al., 2014). This conclusion may be influenced by the imprecise TAD boundary calls obtained using low resolution Hi-C data. To further examine the role of architectural proteins in chromatin organization, we performed HiChIP for CP190. HiChIP for this protein resembles that of RNAPIISer2ph, with most interactions occurring in active compartmental domains (Figure 4A, S3IJ). Architectural protein occupancy is closely correlated with transcription (Figure S3K), making it difficult to interpret the significance of this observation. In order to distinguish the relative roles of APBS occupancy and transcriptional state we examined APBSs ranked either by architectural protein occupancy or by transcriptional activity, and used the directionality index as an indicator of border formation (Dixon et al., 2012). APBS occupancy and transcriptional activity both correlate with negative to positive Hi-C directionality switches indicative of domain borders (Figure 4B). We next grouped APBSs by their presence near highly or lowly transcribed genes and examined Hi-C directionality. We find that highly transcribed genes have negative to positive changes in Hi-C directionality (i.e. domain borders) regardless of APBS occupancy levels (Figure 4C). Conversely, APBSs distant from active gene promoters do not show a distinct change in Hi-C directionality, even when at high occupancy (Figure 4D). To more directly test domain border organization at APBSs, we plotted the median Hi-C signal around high occupancy APBSs that are distant from transcribed regions. The results suggest that APBSs by themselves do not form strong domain borders when compared to compartmental interactions (Figure S3L). However, this does not preclude the possibility that APBSs play a role in conjunction with transcription.
Figure 4. Architectural Proteins Insulate Gene-to-Gene Interactions.

A. HiChIP for CP190 captures active compartments. HiChIP signal for CP190 (red) overlaying Hi-C signal (blue). Gene annotations, GRO-seq, H3K27ac, and H3K27me3 ChIP-seq are shown below. 1 kb HiChIP indicates compartmental interaction preference.
B. Heatmaps of Hi-C directionality anchored and ordered by APBS occupancy (left) or GRO-seq signal (right) show switches in directionality (blue to red).
C. Heatmap of APBSs within 250 bp of a highly expressed TSS ordered by APBS occupancy. Low occupancy sites (<= 3 proteins bound) are indicated for comparison with Figure 4B.
D. Heatmap of APBSs at least 20 kb away from a highly expressed gene ordered by APBS occupancy. High occupancy sites (>= 5 proteins bound) are indicated for comparison with Figure 4B.
E. Distance normalized Hi-C signal at 1 kb resolution is plotted between distinct transcription start sites (TSSs) from the top two GRO-seq quartiles. Low, mid, and high APBSs are defined as the maximum APBS cluster site between genes divided into those containing below 5, 5–8, and above 8 architectural proteins, respectively. Height and color (blue to red) correspond to the relative median observed/expected Hi-C signal. Vertices indicate 1 kb windows from −5 kb to +5 kb surrounding the TSS. p-value < .05 for center point of low APBS compared to high APBS (Wilcoxon text).
F. Neighboring genes are insulated by APBSs. Hi-C metaplot of highly expressed neighboring genes separated by low and high occupancy APBSs. See also Figure S3 and Table S3.
Although non-TSS associated APBSs do not show a pronounced correlation with compartmental domain border formation (Figure 4D), these proteins are known to insulate enhancer-promoter interactions in transgenic assays (Van Bortle and Corces, 2013). To test the effect of APBSs on interactions between genes, we categorized highly expressed genes located in A compartmental domains (Figure 2F far right) by the number of architectural proteins separating pairs of genes. We found that highly expressed genes interact less frequently with each other if they are separated by high occupancy APBSs (Figure 4E). We also examined the effect of APBS occupancy at immediately neighboring active genes. We found that gene neighbors separated by more architectural proteins have lower interaction frequencies between them (Figure 4F). Finally, we tested the effects of APBS occupancy on interactions between A compartmental domains and find that distance matched A-A compartmental interactions separated by high occupancy APBSs are lower than those separated by low occupancy APBSs (Figure S3M). These observations suggest that transcription can explain much of chromatin organization based on the clustering of active transcriptional states, but that APBSs, commensurate to the number of proteins present, modulate these interactions.
Gene Expression and the Establishment of Contact Domains in other Eukaryotes
Due to the strong link between transcriptional state and domain organization observed in Drosophila, we asked whether we could simulate Hi-C contact domains using transcriptional activity data without any information from 3D chromatin architecture. The simulation creates a pseudo-Hi-C interaction map where the interaction frequency in each bin of the matrix is generated using one-dimensional genomic data (i.e. GRO-seq) to test the ability of one dimensional features to recapitulate the real Hi-C data (see STAR Methods). Using GRO-seq, we set the simulated interaction frequency between any two 5 kb segments proportional to the correlation between the activity scores of the two segments. The result is a simulated interaction map that uses only GRO-seq data to predict Hi-C data (Figure 5A bottom right). We found that contact maps simulated by GRO-seq alone could capture domains and compartments with high accuracy (Figure 5A). Our simulation assumed that all active genes at the same distance will interact with the same frequency. However, results described above suggest that APBSs can exert an insulation effect between highly expressed genes and active compartments (Figure 4). We thus asked whether insulation by architectural proteins could explain some features of Hi-C contact maps that transcriptional state alone cannot. To simulate this, the interaction frequency between each pair of genomic segments is decreased slightly for each architectural protein ChIP-seq peak bound between them. Simulations using APBS insulation alone recreate the large domains though miss the separation of small active domains into A compartments (Figure 5B). We then created a third simulation that combines both the principle of transcriptional state segregation and an interaction decay by APBS insulation. When these two components are combined, we see remarkable recapitulation of actual Hi-C data at 1 kb and 5 kb resolutions (Figure 5C, S5A–C). We find that GRO-seq based simulations correlate well with actual Hi-C maps, though APBS occupancy combined with GRO-seq improved the accuracy (Figure 5D). Indeed the majority of contact bin interactions in the simulation are within 2-fold of the actual Hi-C data at a range of distances (Figure S5D). The accuracy of the GRO-seq plus APBS simulation at high resolution suggests that transcriptional state in combination with ABPS insulation may explain the compartmental domain structures observed by Hi-C. We next asked how this principle contributes to coarser resolution structures, such as previously identified TADs. When the high-resolution simulation is viewed at 25 kb resolution, it recapitulates previously identified TADs, suggesting that TADs are composed of compartmental domains that are binned together and viewed at a coarser resolution (Figure 5E).
Figure 5. Transcriptional States Explain 3D Chromatin Interactions throughout Eukarya.

A. Transcription based simulated contact maps predict Hi-C structures. Contact heatmaps at 5 kb resolution using actual Hi-C data (left) and simulated data based on GRO-seq signal only (right). Repetitive/non-mappable regions are shaded grey. Shown below are APBS occupancy counts, GRO-seq, and gene annotations.
B. APBS-based simulated contact maps do not fully explain Hi-C heatmaps. Contact heatmaps at 5 kb resolution using actual Hi-C data (left) and simulated data based on APBS occupancy only (right). Repetitive/non-mappable regions are shaded grey. Shown below are APBS occupancy counts, GRO-seq, gene annotations.
C. GRO-seq and APBS-based simulated contact maps recapitulate domains and compartments in Drosophila melanogaster. Contact heatmaps at 5 kb resolution using actual Hi-C data (left) and simulated data based on GRO-seq and APBS occupancy (right). Repetitive/non-mappable regions are shaded grey. Shown below are APBS occupancy counts, GRO-seq, and gene annotations.
D. Spearman correlation of 5 kb bins of actual Hi-C with simulated Hi-C incorporating APBS occupancy, GRO-seq signal, or both.
E. Simulated contacts recapitulate small and large structures. Actual Hi-C (bottom) compared to simulated data (top). TADs are shown in black.
F. Drosophila expression varies sharply throughout the genome. Log2 RNA-seq profile of a 1 Mb region in Drosophila melanogaster.
G. Arabidopsis expression is linearly constant throughout the genome. Log2 RNA-seq profile of a 1 Mb region in Arabidopsis thaliana.
H. Arabidopsis expression profile contributes to lack of visible domain architecture. Contact heatmaps at 10 kb resolution using actual Hi-C data (left) and simulated data based on RNA-seq data (right). RNA-seq and gene annotations are shown below.
I–L. Large inactive regions form domain structures throughout Eukarya. Contact heatmaps at 10 kb resolution using actual Hi-C data (left) and simulated data based on RNA-seq data (right). RNA-seq and gene annotations are shown below. Sections of the genome with large inactive regions were selected for A. thaliana (I), P. falciparum (J), N. crassa (K), and C. elegans (L).
See also Figure S5.
The high correlation between the experimental results and the computer simulations suggests that segregation of domains based on transcriptional state can explain a large part of chromatin organization in Drosophila. We then postulated that the genomes of other organisms may be organized by these same fundamental principles. According to our hypothesis, domain sizes may vary between organisms depending on the lengths of contiguous active and inactive genomic regions. This may explain why large topological domains are not easily observed in gene dense organisms (Rowley and Corces, 2016). For example, Arabidopsis thaliana has a genome size similar to that of Drosophila melanogaster, but the two differ drastically in gene content and gene activity profiles. To compare the distribution of transcriptional states between Arabidopsis and Drosophila, we plotted transcription levels along a 1 Mb region and saw the existence of large non-transcribed regions in Drosophila (Figure 5F) but constant transcription levels in Arabidopsis (Figure 5G). In agreement, Arabidopsis Hi-C interaction maps do not show large contact domains at most locations in the genome, a result predicted by our computer simulation (Figure 5H). However, when we specifically search for large inactive genomic regions, we then observe large domains that align well with blocks of silenced regions separated by small transcribed regions (Figure 5I actual). These compartmental domains are captured by the computer simulation (Figure 5I simulated, S5E) indicating that transcriptional states play a critical role in domain formation in Arabidopsis, and this principle represents an evolutionarily conserved mechanism controlling 3D chromatin organization.
To further test the correlation between 3D genome organization and gene expression throughout eukaryotes, we examined Hi-C contacts from the protist P. falciparum, the fungus N. crassa, and the animal C. elegans. We searched for large regions with different transcriptional states and found that, in each case, contact domain boundaries appear at transcriptionally inactive-active switches, a feature that is recapitulated in the computer simulation (Figures 5J–L, S5F–H). We propose that the differences seen in contact domain sizes between eukaryotic organisms are not due to different principles governing chromatin architecture, but are primarily a result of the size of contiguous active and silenced regions, in combination with the resolution of the Hi-C experiments performed. Furthermore, our ability to simulate Hi-C data at such high resolution based solely on transcription information indicates that transcription is a major contributor to 3D chromatin architecture in many eukaryotes.
Compartmental Domains are Small Structures Underlying TADs in Humans Cells
Results described above suggest that compartments are small fine-scale structures in Drosophila and, therefore, we hypothesized that compartments may be also fine-scale structures in human cells. To test this hypothesis, we examined Hi-C data in GM12878 cells for evidence of fine-scale compartmentalization. Hi-C data viewed at 1 Mb resolution depicts large compartments as previously identified (Figure S6A left). We compared this to the 100 kb compartments of Rao et al. 2014 and found that 1 Mb compartments are composed of smaller, alternating A and B compartments. The A/B identity of the 1 Mb compartments merely reflects the proportion of smaller A and B compartments that constitute them (Figure S6A right). This suggests that compartments defined at 1 Mb resolution are the result of coarse binning of interaction maps.
Due to the importance of resolution in proper identification of compartments, we asked whether 100 kb compartments could be resolved into even smaller compartments and whether compartmental domains exist in human cells as they do in Drosophila. Figure 6A shows a typical example of fine-scale compartmental interactions in GM12878 cells. The central active region (black arrowhead) does not interact with neighboring silenced sequences, even within the same CTCF loop (black circle), but interacts preferentially with other nearby active regions, even when located outside of the CTCF loop (green arrowhead). This fine-scale compartmentalization can be better appreciated in the local Pearson correlation matrix (Figure 6A right), but it is not detected by compartment calls at resolutions as low as 100 kb (Figure 6A). We therefore sought to call fine-scale compartments in human cells by refining compartment calls at 5 kb resolution. Because compartments were already identified at 100 kb resolution in GM12878 cells (Rao et al., 2014), in lieu of using unsupervised learning methods, we classified 5 kb bins as A or B by their propensity to interact with other A or B regions. First we tested this method of compartment refinement utilizing Drosophila data and found that the A-B index matches well with the eigenvector and 1 kb HiChIP compartments (Figure S6B). Next we used the A–B index to refine compartment calls in human GM12878 cells to detect fine-scale compartments as shown in Figure 6A. Comparison with GRO-seq data suggests that these 5 kb-resolution compartments correlate with the transcriptional state of genes, similar to what we saw in Drosophila (Figure 6A, S6C) and what is generally known about compartments (Lieberman-Aiden et al., 2009). These results support the idea that compartments in human cells are fine-scale structures rather than large Mb-sized regions.
Figure 6. Compartments are Fine-scale Structures in Human Cells.

A. Compartment identification using an A-B index obtained at 5 kb and previously reported compartments at 100 kb, showing identification of smaller A (green) and B (purple) compartments. Gene annotations are shown above and to the left. Left: Hi-C map at 5 kb resolution. Circle indicates a CTCF loop, black arrow indicates a distinct compartment switch within a CTCF loop, green arrow indicates inter-A compartment interactions. Right: Pearson correlation map showing A and B associations.
B. Compartmentalization subdivides low-resolution TADs. Black squares denote TAD calls at 40 kb(Moore et al., 2015). Blue square denotes area depicted to the right at higher resolution.
C. High resolution TAD calls identify small domains. Black squares denote high resolution TAD calls. Circles denote CTCF loops.
D. Compartments create domains in humans. Boundary score at compartmental switches more than 50 kb from a CTCF loop anchor. The median profile is shown above.
See also Figure S6.
Since we find compartmental domains in human cells, we then explored the relationship between these domains and previously identified TADs (Moore et al., 2015). We examined these TAD calls and found that they identify low resolution domains (Figure S6D). When we examine these structures at different intensity scales we find underlying subdomains (Figure 6B, S6D). We noticed that these often correspond to compartment switches inside TADs (Figure 6B), suggesting that compartmental domains can occur at scales smaller than TADs in mammalian cells. This also indicates that TADs called at low-resolution are composed of compartmental domains (compare Figure 6C and S6D). We examined the prevalence of compartment switches occurring within TADs and find that ~71% of TADs contain more than one compartmental switch (Figure S6E).
TADs have been predominately identified at 40 kb resolution in human cells (Dixon et al., 2012; Moore et al., 2015) and they do not appear to correspond to the compartmental domains seen at higher resolution (Figure 6B). To further explore this issue, we called TADs in GM12878 cells utilizing the directionality index (Dixon et al., 2012) and the 1 kb resolution contact map (Rao et al., 2014). These TAD calls better define the underlying domain structures (Figure 6C). We noted that CTCF loops often coincide with compartmental switches (Figure 6C) and questioned whether CTCF or the underlying compartmental switch determines the formation of boundaries between domains. To test this, we selected CTCF loop anchors located at least 50 kb away from a compartmental domain switch and examined the boundary score around these sites. We found that these CTCF loops still form boundaries (Figure S6F). Interestingly, not all domains show the presence of a loop at the domain corner and correspond instead with the compartmental pattern (Figure 6C). To confirm the existence of compartmental domains in the human genome, we examined compartmental switches that were at least 50 kb away from a CTCF loop anchor. These compartmental switches correspond well with the formation of domain boundaries without the need of a CTCF loop (Figure 6D). We then determined the proportion of TAD borders that can be explained by compartments, CTCF loops, or both. We found that CTCF loops can explain many TADs, but a large portion of borders occur at compartmental switches (Figure S6G). Additionally, as we noted above (Figure 6C) many TAD borders correspond to both a compartmental switch and a CTCF loop anchor, suggesting a correlation between the two (Figure S6G). It should be noted that we found 1,939 TAD borders (23%) that do not correspond to CTCF loop anchors or to compartmental switches and it is unclear which features contribute to the formation of these borders. Altogether these observations suggest that TADs defined based on a directionality index are composed of CTCF loops and/or fine-scale compartments. While CTCF is an important player in controlling 3D chromatin organization in mammalian cells, compartmentalization by transcriptional states likely plays a similarly important role.
CTCF and Compartments Organize Chromatin into Domains in Human Cells
Results described above suggest that compartmental domains often represent structures smaller than traditionally defined TADs in human cells and in other eukaryotes. This indicates a conserved principle of chromatin organization by the segregation of active and inactive transcription. To further understand the relationship between transcription and known features of 3D chromatin organization such as CTCF loops, we classified the genome into transcriptionally active and inactive segments by their GRO-seq signal using a hidden Markov model in GM12878 cells. We find that transcriptionally active regions form domains with a structure distinct from that of CTCF loops i.e. lack of an intense signal spot at the corner of the domain (Rao et al., 2014), which is similar to that of domains found in Drosophila (Figures 7A and 2B). As an example, Figure 7B shows a region of chromosome 5 containing a domain formed by multiple interactions among transcribed regions. In addition, a CTCF loop is formed between two CTCF sites present inside and outside of this domain (Figure 7B circle). The borders of this domain do not correspond to CTCF motifs in convergent orientation, but instead correspond to switches in transcriptional activity (Figure 7B GRO-seq). Therefore, since some contact domains can be explained by transcription rather than by the formation of loops between CTCF sites, we hypothesized that these domains should be sensitive to changes in transcription. We tested this hypothesis by finding regions with differential transcription between cell types. In one example, transcription of the PBX1 gene occurs in IMR90, K562, NHEK, and HeLa cells and each has a corresponding domain structure separating this site from the neighboring inactive regions (Figure 7C). IMR90 appears to have the strongest expression and correspondingly shows the strongest compartmental domain pattern. Additionally, transcription is lost in GM12878 cells, which correlates with a loss of the compartmental domain (Figure 7C). In a second example, transcription occurs in GM12878 and a compartmental domain is formed, while both the domain and transcription are lost in the other cell types (Figure S7A). We tested the validity of these observations genome-wide by taking the median distance normalized interaction signal around regions that are transcribed in IMR90 but not in GM12878 cells. We found that differentially transcribed regions show distinct differential contact domains between the two cell types (Figure 7D top). We also tested regions transcribed in GM12878 but not in IMR90 and found that differentially transcribed regions in GM12878 form contact domains structures that are not present in IMR90 (Figures 7D bottom).
Figure 7. Transcriptional States and CTCF Loops Contribute to Formation of Domains in Human Cells.

A. Transcriptionally active regions form domains distinct from CTCF loops. Scaled meta plot of Hi-C interactions at transcriptionally active regions (left) compared to CTCF loops (right).
B. Hi-C heatmap of GM12878 cells at 5 kb resolution. A region where transcriptional activity matches border formation better than CTCF looping (circle) is shown. Blue line indicates CTCF loop anchor. Gene annotations, CTCF forward (red) and reverse (blue) motif orientation, and GRO-seq are shown below.
C. Hi-C heatmap comparing GM12878, IMR90, K562, NHEK, and HeLa cells. Tracks comparing GRO-seq/RNA-seq and CTCF occupancy in each cell line are shown below. Red rectangle indicates differentially expressed region.
D. Transcriptional activity corresponds to domain formation. Scaled meta-plots of distance normalized (observed/expected) Hi-C contacts surrounding transcriptionally active regions in IMR90 that are transcriptionally inactive in GM12878 (top) or vice versa (bottom). Metaplot of GRO-seq signal in GM12878 (green) and IMR90 (pink) for differentially called regions is shown on the left.
E. Transcriptional activity and CTCF looping explains chromatin architecture. Actual Hi-C contact map for a region of chromosome 4. Gene annotations, GRO-seq, and CTCF ChIP-seq signal tracks are shown below. Arrows indicate lines of interactions at CTCF anchors.
F. CTCF looping alone cannot explain chromatin organization. Simulation created using CTCF-loop information only.
G. Transcription alone cannot explain chromatin organization. Simulation created using GRO-seq signal correlation as the probability of two sites interacting.
H. Transcription and CTCF both contribute to chromatin organization. Simulation created using CTCF-loop information as well as GRO-seq signal as a measurement of transcriptional activity. Contacts are a feature of CTCF loops and the correlation in GRO seq between loci.
See also Figure S7.
The finding that compartmental domains are distinct from CTCF loops predicts that long stretches of the genome that lack transcription, such as gene deserts, should display only CTCF loops. We examined Hi-C data from GM12878 cells and found that gene deserts contain CTCF loops and their corresponding loop domains. However, domain segregation in gene deserts does not appear as strong as in neighboring regions that have both CTCF loops and compartmental domains (Figure 7E and S7B).
Motivated by the apparent applicability of the fine-scale compartmentalization model to the human genome we then examined whether chromatin contact maps obtained from Hi-C experiments could be predicted using computer simulations as in other eukaryotes. Figure 7E shows an example of the Hi-C contact map in a region containing CTCF loops, predicted transcriptional domains, and evident compartmental interactions. First we recreated features of CTCF loops by creating a simulated Hi-C interaction map where the intensity of the CTCF loop is used to create the Hi-C peak, line of interactions from CTCF anchors, and the enriched interactions comprising the underlying domain (see STAR Methods). This map reproduced some small domains well, but could not account for interactions larger than the CTCF loops themselves (Figure 7F). Next, we modeled Hi-C contacts based solely on the correlation of GRO-seq signal, as we previously did for Drosophila and other eukaryotes. Simulations using only transcription information produce compartmental domains that match many fine-scale compartments and domain-like structures observed in Hi-C heatmaps, but miss CTCF loop domains. This is particularly evident in large inactive regions of the genome (Figure 7G). We then combined CTCF and transcription based simulations to produce a map in which both CTCF and transcription contributed independently to contact signals. The accuracy of the resulting map indicates that both transcription and CTCF looping are important components of chromatin architecture in human cells (Figure 7H). Overall, these results suggest that the fine scale compartmentalization principle underlying Drosophila contact domain formation is also operational in human cell nuclei, but that CTCF loops and their resulting domains are not conserved features between the two organisms. Changes in transcriptional state can explain the establishment of compartments and compartmental domains, whereas CTCF-mediated loops account for the rest of the contact domains observed in human cells. Therefore, transcriptional activity is a major predictor of chromatin organization throughout Eukarya, with CTCF playing a prominent role in mammals.
DISCUSSION
Results presented here suggest that compartments and contact domains not mediated by CTCF loops are structurally and functionally equivalent, and arise from the segregation of the genome into active and silent regions. These compartmental domains likely represent a basic and ancient form of 3D chromatin organization in eukaryotes. In this model of nuclear architecture, actively transcribed genes form mini-domains that interact more frequently with other active genes. Clusters of active genes without large transcriptionally silent spaces between them form larger, multi-gene domains. Domains of similar transcriptional activity interact to form the characteristic plaid pattern of compartments. Thus, the compartmentalization of the genome by transcriptional state is responsible for the formation of both long-range compartments and local compartmental domains. This appears to be the main mechanisms of 3D organization for organisms that lack architectural proteins such as CTCF. Drosophila lacks motif-oriented CTCF looping, which is likely key to its function in mammals, and compartmental domains explain most visible chromatin organization observed by Hi-C. In humans, these compartmental domains exist alongside CTCF loops to constitute structures previously defined as TADs. In Drosophila, a large effort has gone into identifying components of TAD borders. A major problem with this approach is that the results depend on an often-inaccurate border identification due to the low resolution of the Hi-C data employed in the analyses, and ignores features within the domain. This has led to the conclusion that TAD borders are enriched for architectural proteins, active chromatin, or transcription/RNAPII (Hou et al., 2012; Hug et al., 2017; Sexton et al., 2012; Ulianov et al., 2016; Van Bortle et al., 2014). Results presented here suggest that regions where these features are enriched represent small domains rather than domain borders.
Our results appear to conflict with current thinking suggesting that TADs are invariant between mammalian cell types (Dixon et al., 2012). However, the degree of variability in TAD calls between cell lines, for example 54% conservation between mESCs and brain cortex in mouse and 65% between hESC and IMR90 cells in humans (Dixon et al., 2012), is in line with differences in transcription and CTCF distribution among different cell types. The essential contribution of transcriptional state to the 3D architecture of the genome is also supported by observations suggesting that TAD organization is altered during the heat shock response (Li et al., 2015). Our results show that alteration of transcription or correlated factors such as RNAPII occupancy, using either inhibitors or heat shock, results in changes of compartmental domains. Furthermore, differential gene expression between multiple cell types results in the formation of distinct gene-level compartmental domains. This supports the idea that TADs, which are in part formed by these compartmental domains, should be different when comparing cell types with distinct transcription patterns. Recently published studies have examined the role of CTCF in the formation of loops and TADs using an auxin-mediated degradation system in mammals (Kubo et al., 2017; Nora et al., 2017). The loss of CTCF domains and maintenance of compartments seen after CTCF degradation fits with our model. Compartmental domains can explain why TAD-like structures can still be seen after CTCF depletion.
Interestingly, compartmental domains are found in representatives across Eukarya and the relative sizes of active and inactive segments can explain the differences in domain sizes found in these organisms. Our findings invite the question of when animal genomes first acquired oriented CTCF loops. On possibility is that an ancient Bilaterian ancestor possessed oriented looping CTCF whose function was later lost in D. melanogaster and C. elegans. It has been shown that CTCF motifs are oriented in accordance with topological domain borders in both D. rerio and S. purpuratus, suggesting that CTCF acquired this role early in the Deuterostome ancestor (Gómez-Marín et al., 2015). Although there is a clear correspondence between transcriptional activity, compartments, and domain formation, the question of what establishes and/or maintains compartmental domains remains unclear. It has been recently suggested that TADs are still established after inhibition of transcription in Drosophila embryos using low concentrations of triptolide. However, it is possible that transcription of most genes in the genome was not affected under these conditions, since RNAPIISer5ph remains bound to promoter regions under this treatment (Hug et al., 2017). It is also possible that the presence of RNAPII and other associated proteins, rather than transcription itself, is responsible for the establishment of compartmental domains, since compartmental interactions appear to correlate more closely with occupancy of RNAPII at promoter regions. A role for RNAPII and/or associated proteins in the establishment of compartmental domains is also supported by HiChIP and ChIA-PET results, which identify RNAPII-mediated interactions throughout A compartmental domains. This idea is further supported by analysis of Hi-C data in mouse sperm, which is transcriptionally silent but contains RNAPII and active or silent histone modifications, but shows a similar compartmental organization as embryonic stem cells (Jung et al., 2017).
Segregation of the genome into gene-sized active and inactive components explains structural aspects of chromatin organization in all organisms analyzed to date. Proximal gene domains co-associate to form domains that further interact to form compartments. Together with point-to-point interactions mediated by CTCF, these short and long-range interactions give rise to TADs. Altogether, the correlation between transcriptional state and compartmental domains suggests a fundamental and conserved principle of chromatin organization across Eukarya.
STAR METHODS
Contact for Reagent and Resource Sharing
Requests for further information or reagents should be directed to the corresponding author, Victor Corces, vgcorces@gmail.com, Phone: 404-727-4250, Fax: 404-727-2880.
Experimental Model and Subject Details
Kc167 cells (female embryonic) were obtained from the Drosophila Genomics Resource Center (DGRC) and grown at 25°C in Hyclone SFX inse ct culture media (GE Healthcare).
Method Details
Hi-C, ChIA-PET, and HiChIP Library Preparation and Processing
Hi-C heatmaps were Knight-Ruiz (KR) normalized and visualized by Juicer and Juicebox (Durand et al., 2016b, 2016a). Resolution estimate was calculated exactly as described (Rao et al., 2014). Hi-C meta-plots were created using custom scripts; scores were set from zero to one equaling the highest and lowest values within a plot or across plots in a set. All Hi-C datasets from other organisms were reprocessed and normalized using the Juicer pipeline.
ChIA-PET libraries were prepared as previously described (Goh et al., 2012). HiChIP libraries for CP190 and RNA Polymerase II phosphorylated in serine 2 were prepared as described with minor modifications (Mumbach et al., 2016). 100 × 10^6 Kc167 cells at 80% confluency were crosslinked in 1% formaldehyde for 10 min at room temperature, after which cells were incubated in 0.2 M glycine for 5 min to stop the reaction. Cells were pelleted and resuspended in 500 µl cold Hi-C lysis buffer (10 mM Tris-HCl pH8, 10 mM NaCl, 0.2% Igepal CA-630, and 1× Protease Inhibitor (Roche 11873580001) and incubated on ice for 1 h. Nuclei were pelleted at 2500 rcf for 5 min at 4°C, resuspended in 100 µl 0. 5% SDS, and incubated for 5 min at 65°C. We then added 290 µl of H2O and 50 µl of 10% Triton X-100, incubated samples for 15 min at 37°C. 50 µl of 10× DpnII buffer and 200 u of DpnII (NEB R0543) were added and samples were digested overnight at 37°C with rotation.
After digestion, samples were incubated at 65°C for 20 min to inactivate DpnII, and each was divided into two reactions and allowed to cool to room temperature. Biotin fill-in was done with 22.5 µl of water, 1.5 µl each of 10 mM dTTP, dATP, and dGTP, 15 µl of 1 mM biotin-16-dCTP (Jena Bioscience JBS-NU-809-BIO16), and 8 µl of 5 u/µl DNA polymerase I Large (Klenow) fragment (NEB M210). This reaction was placed at 37°C for 1.5 h, after which samples were ligated for 4 h at room temperature with addition of 663 µl H2O, 120 µl 10× NEB T4 DNA Ligase buffer, 100 µl 10% Triton X-100, 12 µl 10 mg/ml BSA, and 5 µl 400 u/µl T4 DNA Ligase (NEB M0202).
Following ligation, nuclei were pelleted and resuspended in 200 µl cold Nuclei Lysis Buffer (50 mM Tris-HCl pH 9, 10 mM EDTA, 1% SDS, and 1× Protease Inhibitors) with incubation on ice for 20 min. After incubation we added 100 µl cold IP Dilution Buffer (0.01% SDS, 1.1% Trition X-100, 1.2 mM EDTA, 16.7 Tris-HCl pH 8, 16.7 mM NaCl, and 1× Protease Inhibitors) and sonicated to approximately 250 bp fragments. Cell debris was pelleted and the supernatant was transferred into a new 1.5 ml tube for immunoprecipitation.
Each sample was precleared before immunoprecipitation by taking 10 µl Protein A and 10 µl Protein G magnetic beads, washing 3× in 0.5% BSA in 1× PBS, followed by incubation with 10 µl pre-immune rabbit serum in 500 µl 0.5% BSA/PBS for 4 h at 4°C with rotation. Afterward beads were washed with 1 ml 0.5% BSA/PBS for 2 min at room temperature, followed by 2 washes in 1 ml IP Dilution Buffer, and resuspension in 300 µl cold IP Dilution Buffer. Beads with each antibody were also prepared the same way.
Chromatin was diluted 5-fold with cold IP Dilution Buffer and incubated with pre-clear beads for 1–2 h at 4°C with rotation. The unbound portion was then transferred to antibody-coated beads and incubated overnight at 4°C with rotation. After IP, samples were washed 3× with low Low Salt Buffer (0.1% SDS, 1% Triton X-100, 2 mM EDTA pH 8, 20 mM Tris-HCl pH 8, 150 mM NaCl), 2× with High Salt Buffer (0.1% SDS, 1% Triton X-100, 2 mM EDTA pH 8, 20 mM Tris-HCl pH 8, 500 mM NaCl), 2× with LiCl Buffer (10 mM Tris-HCl pH 8, 1 mM EDTA, 0.25 M LiCl, 1% Igepal CA-630, 1% DOC), and 1× with TE buffer.
DNA was eluted 2× using 150 µl freshly prepared IP elution buffer (0.1 M NaHCO3, 1% SDS) for 10 min at room temperature, followed by 5 min at 37°C and transferring to a new tube, combining eluates. For crosslink reversal we added 20 µl 5 M NaCl, 8 µl 0.5 M EDTA and 16 µl 1 M Tris-HCl pH8, incubating 1.5 h at 68°C. Afterwards we added 8 µl proteinase K and incubated at 50°C for 2 h. After allowing samples t o reach room temperature, we precipitated DNA in ethanol with Sodium Acetate, resuspending in 300 µl 10 mM Tris-Cl pH 8.5.
To enrich for ligation events we prepared Streptavidin beads by washing in 400 µl TWB (5mM Tris-HCl pH 7.5, 0.5 mM EDTA, 1 M NaCl, 0.05% Tween 20) and resuspending in 300 µl of 2× Binding Buffer (10 mM Tris-HCl pH 7.5, 1 mM EDTA, 2 M NaCl). Beads were added to the sample and incubated at room temperature for 15 min with rotation. Samples were then washed 2× in TWB and the standard Hi-C library preparation was followed (Rao et al., 2014).
Sequenced reads were mapped to the Drosophila dm6 genome, further processed to remove duplicates and self-ligations using the Juicer pipeline, and visualized using Juicebox(Durand et al., 2016a, 2016b). Statistics for each library can be found in Tables S1–S3. The overlap of HiChIP and compartments was computed by the sum of reads divided by the total number of possible bins in each category. Significant interactions were calculated using MICC (He et al., 2015).
Domains and Compartments
Identification of Drosophila TADs and domains has been described previously (Cubeñas-Potts et al., 2016; Hou et al., 2012; Ulianov et al., 2016) as were GM12878 TADs and smaller contact domains (Moore et al., 2015; Rao et al., 2014). Hi-C directionality index (DI) was calculated as previously described (Dixon et al., 2012) using the equation:
To compensate for the smaller genome and smaller domain structures seen in D. melanogaster, we calculated A and B using interactions more than 5 kb but less than 100 kb from each 250 bp bin throughout the genome. Directionality index based domains were called following a hidden Markov model.
Drosophila compartments were identified from the eigenvector computation and Pearson correlation matrices as previously reported (Lieberman-Aiden et al., 2009) using Juicebox. Profiles of different histone modifications across compartments were calculated using ngsplot (Shen et al., 2014).
To calculate the correlation between Hi-C and histone modification HiChIP, samples were read normalized by random picking and H3K27ac and H3K27me3 were combined using Juicebox. Distance normalized interaction signals (observed/expected) within each 10 kb bin were then compared to Hi-C and tested by a Pearson correlation. Compartments mapped using HiChIP were identified by computing the preferential contacts of each row in the matrix with H3K27ac or H3K27me3 such that each bin was given a value of log2(H3K27ac/H3K27me3) contacts. Compartments were then identified from this relative association by a hidden Markov model. Differences in intra-domain and compartmental interactions after triptolide were calculated by the sum of 1 kb resolution interactions more than 2 kb apart.
Human compartments were called by creating a 5 kb by 125 kb matrix and measuring the median log2 distance normalized interaction score with previously defined lower resolution A and B compartments (Rao et al., 2014). An A-B index was then created by subtracting the A and B scores. This index represents the comparative likelihood of a sequence interacting with A or B. 5 kb bins with positive values (more association with A) were called as high-resolution A compartments, while 5 kb bins with negative values (more association with B) were called as high-resolution B compartments. Overlap of CTCF loops and compartmental switches with TAD borders was calculated for each border with a feature within 40 kb of the border and p-values were calculated by permutation test.
Transcriptional state domains were obtained using a hidden Markov model of GRO-seq data binned at 1 kb resolution (Core et al., 2012; Kwak et al., 2013). This utilized a Gaussian distribution to classify each 1 kb bin as an active or inactive state. Transcriptional domains were determined as regions without transcriptional state switches and regions less than 2 kb were merged into the neighboring domains. Differential active domains between GM12878 and IMR90 cells were identified as those with average signal across the region greater than 1 RPKM in one cell type but less than 0.5 RPKM in the other.
ChIP-seq Datasets
Architectural protein binding sites were individually identified by MACS (Zhang et al., 2008). A 200 bp region around the summit was used to combine peaks from all ChIP-seq data-sets. Unique peaks were kept, and overlapping regions were merged placing the center point as the new summit. A second filter was then used to determine occupancy such that RPM normalized read counts were three-fold higher than IgG on the combined peak list. Individual architectural proteins used for APBS occupancy were BEAF32, CAPH2, Chromator, CP190, CTCF, DREF, Fs(1)h-L, L3mbt, Mod(mdg4), Nup98, Rad21, SuHw, TFIIIC, and Z4. Overlap with promoters was determined if the 200 bp region lay within 50 bp of the TSS.
ChIP-seq libraries for histone modifications were prepared and processed in Kc167 cells as previously described (Cubeñas-Potts et al., 2016) and included ChIP-seq for H3K36me3, H3K9me3, H4K16ac, H4K20me1, H2Bub, H3.3, and H2A.Z. ChIP-seq for H3.3 was done in a Kc167 line expressing V5-tagged H3.3 (Wirbelauer et al., 2005).
To calculate the fraction of the Drosophila genome bound by H3K27me3 and/or H3K27ac we used input normalized signal levels at H3K27ac peaks to estimate the background signal of H3K27me3. This was done by dividing the genome into 1 kb bins and counting RPM normalized reads in each ChIP-seq and input dataset. The threshold above which most H3K27ac peaks contained H3K27ac but not H3K27me3, and where non-peaks contained the reverse, was used.
ATAC-seq
Kc167 cells grown to exponential stage were treated with DMSO or triptolide as previously described (Li et al., 2015). 200,000 ctrl and treated cells were collected and processed using the Fast-ATAC protocol (Corces et al., 2016). Briefly, cell pellets were resuspened in 50 µl Tn5 transposase mixture (0.01% digitonin for permeabilizing cell membrane, 2.5 µl Tn5, 25 µl TD buffer), and incubated at 30°C for 20 min with occasional shaking. After reaction, cells were cooled on ice and DNA was purified using the Minelute Kit (Qiagen). 25 µl of eluted DNA were used for real time PCR amplification in the reaction mixture (2× KAPA HiFi mix and 1.25 µM indexed primers) using the following conditions: 72°C for 5 min; 98°C for 30 sec; and 10–11 cycles at 98°C for 10 se c, 63°C for 30 sec, and 72°C for 1 min. Reads were trimmed of adapters, mapped to the Drosophila dm6 genome, deduplicated, and separated into short (<=115 bp) and long fragments (180–247 bp) to obtain transcription factor and nucleosome profiles, respectively. Peaks were identified using MACS2.
RNA-seq and GRO-seq Analysis
Transcriptional quartiles were taken by counting reads within the first 100 bp of genes, and removing genes with no reads as a separate set to reduce repetitive biases. Distance normalized Hi-C contacts at 1 kb resolution were calculated surrounding the TSS and TTS or the TSS of another gene. The median of each bin was then taken and plotted as a heatmap or a 3D surface plot using the Lattice wireframe R package.
HiC Simulations
Simulation in Drosophila Cells
The Drosophila simulated Hi-C matrices were created without any knowledge of three-dimensional contact or domain structure, using only information from GRO-seq and APBS occupancy (ChIP-seq). Simulated contacts between two bins relied on their correlation in transcriptional activity. We noted from Hi-C contact maps that active compartmental interactions were generally stronger than inactive compartmental interactions, thus actively correlating bin scores were increased. These contacts were then reduced based on their distance and the number of architectural proteins lying between them. To recapitulate the noise of Hi-C data, we added matrix blurring and randomly added contacts following a Poisson and gamma distribution. Simulated contact maps without APBS incorporation (GRO-seq alone) were created by an equal decay rate across bins in lieu of APBS insulation. Simulated contacts without transcriptional activity (APBS alone) were created by replacing all transcriptional activity with null values. Simulated contact heatmaps for A. thaliana, P. falciparum, N. crassa, and C. elegans were done solely with transcriptional information.
Simulated read counts for each 1kb interaction bin in the two-dimensional Hi-C matrix were generated using a model that incorporates GRO-seq data and Architectural Protein Binding Sites (APBSs) produced from ChIP-seq peaks of individual architectural proteins. Empirical cutoffs for highly active regions (ac – active cutoff) and inactive regions (ic – inactive cutoff) were determined (1000 and 100 reads per kb respectively) and log10 read counts were taken as the respective value between the two and converted to a probability value with the formula: 1 – ((grocount – ic) / (ac – ic)). This maps all possible read counts to values between 0 and 1, with 0 being active and 1 being inactive.
For each pair of bins the transcriptional activity values determined above were used to create a correlation value using the following formula. The formula computes the similarity or correlation C between the two values and thus will be 0 when one bin is active and the other inactive, but 1 when both bins are active or both bins are inactive. Ax and Ay represent individual GRO-seq bin values calculated above.
A second step increases the score of bins where both anchors have some activity, doubling the score in the case where both anchors are fully active.
APBSs were used to determine the insulation between 2 bins by tallying the number of ChIP seq peaks of each protein in all the bins between any two anchors. B is the number of APBS peaks in each 1kb section of the genome. I is equal to the total number of APBS ChIP peaks between the interacting bins.
Each APBS peak is treated as equally important by the simulation. Ten APBS peaks in a single bin will have the same total effect on insulation as ten peaks spread across multiple bins. A constant, α, was chosen to reflect the insulation of each bound protein. The simulations use a value of 0.982. This constant is raised to the power of the total number of intervening architectural proteins to calculate an insulation score, K, between 0 and 1.
The insulation score is used to modify the correlation score, causing a distance decay, which is sharper or more gradual depending on the density of the architectural proteins. β is a constant that is modified by the correlation and insulation scores of each x, y pair in the matrix. The simulations use a value of 40 for β .
An additional distance-dependent factor was added to each interacting bin. The closer the two anchors the larger the value added to represent the distance decay seen in most Hi-C data. This decay follows the power law frequently observed in Hi-C datasets with a decay rate of −0.8. A constant, θ, was set equal to 300 to reproduce the large number of reads near the diagonal of the Hi-C matrix.
To more closely represent the realities of Hi-C data the matrix was blurred. Each bin was averaged with its surrounding bins in the matrix in order to smooth the data. A window size, w, represents the width of the blurring and was set to 3. The averaging step was carried out twice.
To achieve a source of random fluctuation in the data, a Poisson and gamma distribution were used to add random values to each bin. A gamma distribution with shape of 0.02 and scale of 10 added values to each bin creating a minority of bins with much higher than average values and a poisson distribution was used to randomize all values slightly.
Simulated contact maps without APBS incorporation (GRO-seq alone) were created by an equal decay rate across bins in lieu of APBS insulation. Simulated contacts without transcriptional activity (APBS alone) were created by replacing all transcriptional activity with null values.
Correlations between actual and simulated Hi-C contact maps were done at 5 kb resolution. Distance normalized interactions crossing over, but not landing within the bin, were counted and then normalized by the sum of the interaction counts in each set. These scores were used to create Spearman correlation values. Separately, the smoothed scatter plot was created by taking each distance normalized signal between bins at 5 kb resolution comparing actual to simulated counts.
Simulation in Human Cells
To simulate the human genome Hi-C map at 5 kb resolution we generated the CTCF and transcription regulated components independently and overlaid them for the 54–75 MB region on Chromosome 4 along with a genomic background function.
For the transcriptional segregation component of the combined model, as well as for the stand alone model, the transcription level of each 5 kb bin was determined by Gro-seq data from GM12878 (GSM1480326) and was mapped to values between 0 and 1 in the same way as other simulations resulting in a correlation score C. A second step again increased the score of bins where both anchors had some activity, doubling the score in the case where both anchors are fully active giving C '. In lieu of APBS insulation a constant power law decay with the exponent −0.7 was used to decrease interaction by genomic distance. Β was set to 50. The transcriptional component of the simulation at a bin is thus described by the following equation where the bin of the upstream anchors is u and the downstream anchor is d.
To complete the transcriptional segregation model the genomic background function was added with θ set equal to 100.
To generate the CTCF mediated component of the simulation, CTCF loops in the 54–75 MB section of Chromosome 4 were annotated manually as computational methods were unable to completely annotate CTCF loops in the region. We approximate the effects of each CTCF loop on the simulation by three patterns: increasing score in all bins between the two anchors, strong lines from each CTCF anchor in the orientation of its interacting partner, and a peak of interactions at the intersection of the two anchors.
The strength of the domains and the lines is modified by the distance between the two CTCF anchors divided by a constant larger than the largest distance between CTCF loops, 800.
D Is thus a constant between 0 and 0.2 correlated with the distance of the CTCF loop. D weakens the strength of long range loops in relation to short range loops. All interaction bins within the domain bounded by the CTCF anchors are scored by the following function:
To recreate the lines extending from the diagonal of the matrix to the CTCF loop we use L to represent the width of the line, thicker near the diagonal and tapering towards the CTCF loop defined by:
Any values of L smaller than 2 are replaced by 2. Each x,y bin within L distance of the line is scored by the following equation where K is the distance between the bin and the center of the line.
To produce a peak of interactions at the CTCF loop every x,y bin within 10 bins of the center of the peak, u,d is scored as below. First an expected value E is computed:
O corresponds to the observed/expected value of the peak of the loop and is used to calculate the final value of the bin below.
These three features produce the CTCF component of the Hi-C simulations. Where they overlap, the feature that produces the maximum score is used.
Lastly a genomic background function is added to account for uniform genomic background.
The matrix is then convolved with a Gaussian kernel of size 20 to simulate blurring due to linear proximity. A level of randomized ligations are then added to account for technical effects using a combination of Gamma and Poisson distributions to produce the final matrix.
Quantification and Statistical Analysis
Significant differences at center points between interaction metaplots were performed using a Wilcoxon signe-rank test as described in the figure legends. Significance was determined at p < .05.
Data and Software Availability
HinfI and DpnII Hi-C datasets for Kc167 cells have been deposited in the Gene Expression Omnibus (GEO) under the ID code GSE80702. ATAC-seq, ChIA-PET, HiChIP, and ChIP-seq data are available under the ID code GSE89244.
Supplementary Material
Acknowledgments
We would like to thank the Genomic Services Lab at the HudsonAlpha Institute for Biotechnology, and specially Drs. Angela Jones and Terri Pointer, for their help in performing Illumina sequencing of samples. This work was supported by U.S. Public Health Service Award R01 GM035463 (V.G.C.) and the Ruth L. Kirschstein National Research Service Award F32 GM113570 (M.J.R.) from the National Institutes of Health. The content is solely the responsibility of the authors and does not necessarily represent the official views of the National Institutes of Health.
Footnotes
Publisher's Disclaimer: This is a PDF file of an unedited manuscript that has been accepted for publication. As a service to our customers we are providing this early version of the manuscript. The manuscript will undergo copyediting, typesetting, and review of the resulting proof before it is published in its final citable form. Please note that during the production process errors may be discovered which could affect the content, and all legal disclaimers that apply to the journal pertain.
AUTHOR CONTRIBUTIONS
M.J.R., M.H.N, and V.G.C. designed the project and wrote the manuscript. X.L. performed ATAC-seq. X.L., K.H., M.A-K., and I.S.M.R. performed HiChIP experiments. P.W. and Y.R. performed ChIA-PET experiments. M.J.R. and M.H.N. performed all other analyses.
References
- Andersson R, Refsing Andersen P, Valen E, Core LJ, Bornholdt J, Boyd M, Heick Jensen T, Sandelin A. Nuclear stability and transcriptional directionality separate functionally distinct RNA species. Nat. Commun. 2014;5:5336. doi: 10.1038/ncomms6336. [DOI] [PubMed] [Google Scholar]
- Ay F, Bunnik EM, Varoquaux N, Bol SM, Prudhomme J, Vert J-P, Noble WS, Le Roch KG. Three-dimensional modeling of the P. falciparum genome during the erythrocytic cycle reveals a strong connection between genome architecture and gene expression. Genome Res. 2014;24:974–988. doi: 10.1101/gr.169417.113. [DOI] [PMC free article] [PubMed] [Google Scholar]
- Corces MR, Buenrostro JD, Wu B, Greenside PG, Chan SM, Koenig JL, Snyder MP, Pritchard JK, Kundaje A, Greenleaf WJ, et al. Lineage-specific and single-cell chromatin accessibility charts human hematopoiesis and leukemia evolution. Nat. Genet. 2016;48:1193–1203. doi: 10.1038/ng.3646. [DOI] [PMC free article] [PubMed] [Google Scholar]
- Core LJ, Waterfall JJ, Lis JT. Nascent RNA sequencing reveals widespread pausing and divergent initiation at human promoters. Science. 2008;322:1845–1848. doi: 10.1126/science.1162228. [DOI] [PMC free article] [PubMed] [Google Scholar]
- Core LJ, Waterfall JJ, Gilchrist DA, Fargo DC, Kwak H, Adelman K, Lis JT. Defining the status of RNA polymerase at promoters. Cell Rep. 2012;2:1025–1035. doi: 10.1016/j.celrep.2012.08.034. [DOI] [PMC free article] [PubMed] [Google Scholar]
- Core LJ, Martins AL, Danko CG, Waters CT, Siepel A, Lis JT. Analysis of nascent RNA identifies a unified architecture of initiation regions at mammalian promoters and enhancers. Nat. Genet. 2014;46:1311–1320. doi: 10.1038/ng.3142. [DOI] [PMC free article] [PubMed] [Google Scholar]
- Crane E, Bian Q, McCord RP, Lajoie BR, Wheeler BS, Ralston EJ, Uzawa S, Dekker J, Meyer BJ. Condensin-driven remodelling of X chromosome topology during dosage compensation. Nature. 2015;523:240–244. doi: 10.1038/nature14450. [DOI] [PMC free article] [PubMed] [Google Scholar]
- Cubeñas-Potts C, Rowley MJ, Lyu X, Li G, Lei EP, Corces VG. Different enhancer classes in Drosophila bind distinct architectural proteins and mediate unique chromatin interactions and 3D architecture. Nucleic Acids Res. 2016;45:1714–1730. doi: 10.1093/nar/gkw1114. [DOI] [PMC free article] [PubMed] [Google Scholar]
- Dixon JR, Selvaraj S, Yue F, Kim A, Li Y, Shen Y, Hu M, Liu JS, Ren B. Topological domains in mammalian genomes identified by analysis of chromatin interactions. Nature. 2012;485:376–380. doi: 10.1038/nature11082. [DOI] [PMC free article] [PubMed] [Google Scholar]
- Durand NC, Robinson JT, Shamim MS, Machol I, Mesirov JP, Lander ES, Aiden EL. Juicebox Provides a Visualization System for Hi-C Contact Maps with Unlimited Zoom. Cell Syst. 2016b;3:99–101. doi: 10.1016/j.cels.2015.07.012. [DOI] [PMC free article] [PubMed] [Google Scholar]
- Durand NC, Shamim MS, Machol I, Rao SSP, Huntley MH, Lander ES, Aiden EL. Juicer Provides a One-Click System for Analyzing Loop-Resolution Hi-C Experiments. Cell Syst. 2016a;3:95–98. doi: 10.1016/j.cels.2016.07.002. [DOI] [PMC free article] [PubMed] [Google Scholar]
- El-Sharnouby S, Fischer B, Magbanua JP, Umans B, Flower R, Choo SW, Russell S, White R. Regions of very low H3K27me3 partition the Drosophila genome into topological domains. PloS One. 2017;12:e0172725. doi: 10.1371/journal.pone.0172725. [DOI] [PMC free article] [PubMed] [Google Scholar]
- Galazka JM, Klocko AD, Uesaka M, Honda S, Selker EU, Freitag M. Neurospora chromosomes are organized by blocks of importin alpha-dependent heterochromatin that are largely independent of H3K9me3. Genome Res. 2016;26:1069–1080. doi: 10.1101/gr.203182.115. [DOI] [PMC free article] [PubMed] [Google Scholar]
- Goh Y, Fullwood MJ, Poh HM, Peh SQ, Ong CT, Zhang J, Ruan X, Ruan Y. Chromatin Interaction Analysis with Paired-End Tag Sequencing (ChIA-PET) for Mapping Chromatin Interactions and Understanding Transcription Regulation. J. Vis. Exp. 2012:e3770. doi: 10.3791/3770. [DOI] [PMC free article] [PubMed] [Google Scholar]
- Gómez-Marín C, Tena JJ, Acemel RD, López-Mayorga M, Naranjo S, de la Calle-Mustienes E, Maeso I, Beccari L, Aneas I, Vielmas E, et al. Evolutionary comparison reveals that diverging CTCF sites are signatures of ancestral topological associating domains borders. Proc. Natl. Acad. Sci. 2015;112:7542–7547. doi: 10.1073/pnas.1505463112. [DOI] [PMC free article] [PubMed] [Google Scholar]
- Gonçalves AP, Hall C, Kowbel DJ, Glass NL, Videira A. CZT-1 is a novel transcription factor controlling cell death and natural drug resistance in Neurospora crassa. G3 Bethesda Md. 2014;4:1091–1102. doi: 10.1534/g3.114.011312. [DOI] [PMC free article] [PubMed] [Google Scholar]
- Guo Y, Xu Q, Canzio D, Shou J, Li J, Gorkin DU, Jung I, Wu H, Zhai Y, Tang Y, et al. CRISPR Inversion of CTCF Sites Alters Genome Topology and Enhancer/Promoter Function. Cell. 2015;162:900–910. doi: 10.1016/j.cell.2015.07.038. [DOI] [PMC free article] [PubMed] [Google Scholar]
- He C, Zhang MQ, Wang X. MICC: an R package for identifying chromatin interactions from ChIA-PET data. Bioinforma. Oxf. Engl. 2015;31:3832–3834. doi: 10.1093/bioinformatics/btv445. [DOI] [PMC free article] [PubMed] [Google Scholar]
- Hillier LW, Reinke V, Green P, Hirst M, Marra MA, Waterston RH. Massively parallel sequencing of the polyadenylated transcriptome of C. elegans. Genome Res. 2009;19:657–666. doi: 10.1101/gr.088112.108. [DOI] [PMC free article] [PubMed] [Google Scholar]
- Hou C, Li L, Qin ZS, Corces VG. Gene Density, Transcription, and Insulators Contribute to the Partition of the Drosophila Genome into Physical Domains. Mol. Cell. 2012;48:471–484. doi: 10.1016/j.molcel.2012.08.031. [DOI] [PMC free article] [PubMed] [Google Scholar]
- Hug CB, Grimaldi AG, Kruse K, Vaquerizas JM. Chromatin Architecture Emerges during Zygotic Genome Activation Independent of Transcription. Cell. 2017;169:216–228. e19. doi: 10.1016/j.cell.2017.03.024. [DOI] [PubMed] [Google Scholar]
- Jin F, Li Y, Dixon JR, Selvaraj S, Ye Z, Lee AY, Yen C-A, Schmitt AD, Espinoza CA, Ren B. A high-resolution map of the three-dimensional chromatin interactome in human cells. Nature. 2013;503:290–294. doi: 10.1038/nature12644. [DOI] [PMC free article] [PubMed] [Google Scholar]
- Jung YH, Sauria MEG, Lyu X, Cheema MS, Ausio J, Taylor J, Corces VG. Chromatin States in Mouse Sperm Correlate with Embryonic and Adult Regulatory Landscapes. Cell Rep. 2017;18:1366–1382. doi: 10.1016/j.celrep.2017.01.034. [DOI] [PMC free article] [PubMed] [Google Scholar]
- Kasowski M, Kyriazopoulou-Panagiotopoulou S, Grubert F, Zaugg JB, Kundaje A, Liu Y, Boyle AP, Zhang QC, Zakharia F, Spacek DV, et al. Extensive variation in chromatin states across humans. Science. 2013;342:750–752. doi: 10.1126/science.1242510. [DOI] [PMC free article] [PubMed] [Google Scholar]
- Kensche PR, Hoeijmakers WAM, Toenhake CG, Bras M, Chappell L, Berriman M, Bártfai R. The nucleosome landscape of Plasmodium falciparum reveals chromatin architecture and dynamics of regulatory sequences. Nucleic Acids Res. 2016;44:2110–2124. doi: 10.1093/nar/gkv1214. [DOI] [PMC free article] [PubMed] [Google Scholar]
- Kubo N, Ishii H, Gorkin D, Meitinger F, Xiong X, Fang R, Liu T, Ye Z, Li B, Dixon J, et al. Preservation of Chromatin Organization after Acute Loss of CTCF in Mouse Embryonic Stem Cells 2017 [Google Scholar]
- Kwak H, Fuda NJ, Core LJ, Lis JT. Precise maps of RNA polymerase reveal how promoters direct initiation and pausing. Science. 2013;339:950–953. doi: 10.1126/science.1229386. [DOI] [PMC free article] [PubMed] [Google Scholar]
- Langmead B, Trapnell C, Pop M, Salzberg SL. Ultrafast and memory-efficient alignment of short DNA sequences to the human genome. Genome Biol. 2009;10:R25. doi: 10.1186/gb-2009-10-3-r25. [DOI] [PMC free article] [PubMed] [Google Scholar]
- Li L, Lyu X, Hou C, Takenaka N, Nguyen HQ, Ong C-T, Cubeñas-Potts C, Hu M, Lei EP, Bosco G, et al. Widespread rearrangement of 3D chromatin organization underlies polycomb-mediated stress-induced silencing. Mol. Cell. 2015;58:216–231. doi: 10.1016/j.molcel.2015.02.023. [DOI] [PMC free article] [PubMed] [Google Scholar]
- Lieberman-Aiden E, van Berkum NL, Williams L, Imakaev M, Ragoczy T, Telling A, Amit I, Lajoie BR, Sabo PJ, Dorschner MO, et al. Comprehensive Mapping of Long-Range Interactions Reveals Folding Principles of the Human Genome. Science. 2009;326:289–293. doi: 10.1126/science.1181369. [DOI] [PMC free article] [PubMed] [Google Scholar]
- Moore BL, Aitken S, Semple CA. Integrative modeling reveals the principles of multi-scale chromatin boundary formation in human nuclear organization. Genome Biol. 2015;16:110. doi: 10.1186/s13059-015-0661-x. [DOI] [PMC free article] [PubMed] [Google Scholar]
- Mumbach MR, Rubin AJ, Flynn RA, Dai C, Khavari PA, Greenleaf WJ, Chang HY. HiChIP: efficient and sensitive analysis of protein-directed genome architecture. Nat. Methods. 2016;13:919–922. doi: 10.1038/nmeth.3999. [DOI] [PMC free article] [PubMed] [Google Scholar]
- Nora EP, Goloborodko A, Valton A-L, Gibcus JH, Uebersohn A, Abdennur N, Dekker J, Mirny LA, Bruneau BG. Targeted Degradation of CTCF Decouples Local Insulation of Chromosome Domains from Genomic Compartmentalization. Cell. 2017;169:930–944. doi: 10.1016/j.cell.2017.05.004. [DOI] [PMC free article] [PubMed] [Google Scholar]
- Pai C-Y, Lei EP, Ghosh D, Corces VG. The centrosomal protein CP190 is a component of the gypsy chromatin insulator. Mol. Cell. 2004;16:737–748. doi: 10.1016/j.molcel.2004.11.004. [DOI] [PubMed] [Google Scholar]
- Rao SSP, Huntley MH, Durand NC, Stamenova EK, Bochkov ID, Robinson JT, Sanborn AL, Machol I, Omer AD, Lander ES, et al. A 3D map of the human genome at kilobase resolution reveals principles of chromatin looping. Cell. 2014;159:1665–1680. doi: 10.1016/j.cell.2014.11.021. [DOI] [PMC free article] [PubMed] [Google Scholar]
- Rowley MJ, Corces VG. The three-dimensional genome: principles and roles of long-distance interactions. Curr. Opin. Cell Biol. 2016;40:8–14. doi: 10.1016/j.ceb.2016.01.009. [DOI] [PMC free article] [PubMed] [Google Scholar]
- Sexton T, Yaffe E, Kenigsberg E, Bantignies F, Leblanc B, Hoichman M, Parrinello H, Tanay A, Cavalli G. Three-Dimensional Folding and Functional Organization Principles of the Drosophila Genome. Cell. 2012;148:458–472. doi: 10.1016/j.cell.2012.01.010. [DOI] [PubMed] [Google Scholar]
- Shen L, Shao N, Liu X, Nestler E. ngs.plot: Quick mining and visualization of next-generation sequencing data by integrating genomic databases. BMC Genomics. 2014;15:284. doi: 10.1186/1471-2164-15-284. [DOI] [PMC free article] [PubMed] [Google Scholar]
- Swaminathan J, Baxter EM, Corces VG. The role of histone H2Av variant replacement and histone H4 acetylation in the establishment of Drosophila heterochromatin. Genes Dev. 2005;19:65–76. doi: 10.1101/gad.1259105. [DOI] [PMC free article] [PubMed] [Google Scholar]
- Ulianov SV, Khrameeva EE, Gavrilov AA, Flyamer IM, Kos P, Mikhaleva EA, Penin AA, Logacheva MD, Imakaev MV, Chertovich A, et al. Active chromatin and transcription play a key role in chromosome partitioning into topologically associating domains. Genome Res. 2016;26:70–84. doi: 10.1101/gr.196006.115. [DOI] [PMC free article] [PubMed] [Google Scholar]
- Van Bortle K, Corces VG. The role of chromatin insulators in nuclear architecture and genome function. Curr. Opin. Genet. Dev. 2013;23:212–218. doi: 10.1016/j.gde.2012.11.003. [DOI] [PMC free article] [PubMed] [Google Scholar]
- Van Bortle K, Ramos E, Takenaka N, Yang J, Wahi JE, Corces VG. Drosophila CTCF tandemly aligns with other insulator proteins at the borders of H3K27me3 domains. Genome Res. 2012;22:2176–2187. doi: 10.1101/gr.136788.111. [DOI] [PMC free article] [PubMed] [Google Scholar]
- Van Bortle K, Nichols MH, Li L, Ong C-T, Takenaka N, Qin ZS, Corces VG. Insulator function and topological domain border strength scale with architectural protein occupancy. Genome Biol. 2014;15:R82. doi: 10.1186/gb-2014-15-5-r82. [DOI] [PMC free article] [PubMed] [Google Scholar]
- Wang C, Liu C, Roqueiro D, Grimm D, Schwab R, Becker C, Lanz C, Weigel D. Genome-wide analysis of local chromatin packing in Arabidopsis thaliana. Genome Res. 2015;25:246–256. doi: 10.1101/gr.170332.113. [DOI] [PMC free article] [PubMed] [Google Scholar]
- Wirbelauer C, Bell O, Schübeler D. Variant histone H3.3 is deposited at sites of nucleosomal displacement throughout transcribed genes while active histone modifications show a promoter-proximal bias. Genes Dev. 2005;19:1761–1766. doi: 10.1101/gad.347705. [DOI] [PMC free article] [PubMed] [Google Scholar]
- Yang J, Sung E, Donlin-Asp PG, Corces VG. A subset of Drosophila Myc sites remain associated with mitotic chromosomes colocalized with insulator proteins. Nat. Commun. 2013;4:1464. doi: 10.1038/ncomms2469. [DOI] [PMC free article] [PubMed] [Google Scholar]
- Zhang Y, Liu T, Meyer CA, Eeckhoute J, Johnson DS, Bernstein BE, Nussbaum C, Myers RM, Brown M, Li W, et al. Model-based Analysis of ChIP-Seq (MACS) Genome Biol. 2008;9:R137. doi: 10.1186/gb-2008-9-9-r137. [DOI] [PMC free article] [PubMed] [Google Scholar]
- Zhu Y, Rowley MJ, Böhmdorfer G, Wierzbicki AT. A SWI/SNF chromatin remodeling complex acts in noncoding RNA-mediated transcriptional silencing. Mol. Cell. 2013;49:298–309. doi: 10.1016/j.molcel.2012.11.011. [DOI] [PMC free article] [PubMed] [Google Scholar]
Associated Data
This section collects any data citations, data availability statements, or supplementary materials included in this article.