Abstract
Patients with acute myocardial infarction are at increased risk of developing atrial fibrillation. We aimed to evaluate whether speckle tracking echocardiography improves risk stratification for atrial fibrillation in these patients.
The study comprised of 373 patients with ST-segment elevation myocardial infarction (STEMI) treated with primary percutaneous coronary intervention. Patients had an echocardiogram performed at a median of 2 days after their STEMI. The echocardiograms consisted of conventional measurements and myocardial strain analysis by speckle tracking from 3 apical projections. The endpoint was a composite of new-onset atrial fibrillation and ischemic stroke. At a median follow-up time of 5.5 years (interquartile range 4.9, 6.1 years), 44 patients developed the endpoint (atrial fibrillation: n = 24, ischemic stroke: n = 24, both: n = 4). Patients who reached the endpoint had significantly reduced systolic function by the left ventricular ejection fraction (LVEF) (43% vs 46%; P = 0.042) and global longitudinal strain (10.9% vs 12.6%; P = 0.004), both being univariable predictors. However, only global longitudinal strain remained a significantly independent predictor (hazard ratio 1.12, 95% confidence interval 1.00; 1.25, P = 0.042, per 1% decrease) after multivariable adjustment for baseline predictors (age, sex, diabetes, hypertension, diastolic dysfunction, and LVEF) using Cox regression. Furthermore, global longitudinal strain resulted in significantly higher c-statistics for prediction of outcome compared with LVEF <45% (0.63 vs 0.52; P = 0.026). When stratified into tertiles of global longitudinal strain, it became evident that patients in the lowest tertile mediated this signal with a 2-fold increased risk compared with the highest tertile (hazard ratio 2.10, 95% confidence interval 1.04; 4.25).
Global longitudinal strain predicts atrial fibrillation after STEMI and may add valuable information which can help facilitate arrhythmia detection in these patients.
Keywords: atrial fibrillation, echocardiography, global longitudinal strain, myocardial infarction, stroke
1. Introduction
Acute myocardial infarctions (MIs) are often complicated by cardiac arrhythmias. Although ventricular arrhythmias represent the acute and dangerous complications to MI, the most common cardiac arrhythmia in the subacute phase is atrial fibrillation (AF).[1] This arrhythmia is associated with progressive heart failure, recurrent MIs, ventricular arrhythmias, stroke, and death.[2–4] Such associated outcomes most often afflict post-MI patients with left ventricular (LV) systolic dysfunction.[5] This emphasizes a need for AF detection as we are able to manage the arrhythmia by cardioversion, frequency regulation, stroke prevention, and search of an underlying cause.[6] The approach for detecting AF currently relies on discretional electrocardiograms, telemetry, and Holter monitoring with limited diagnostic capabilities.[7] The application of insertable cardiac monitors (ICMs) with an AF algorithm has unveiled that 27% of MI patients with LV dysfunction develop AF.[1] This may be a consequence of an elevated filling pressure after the MI, which creates a pressure gradient on the LA, eventually causing LA remodeling, which increases the risk of AF.[8] Hence, prolonged monitoring may facilitate arrhythmia detection and possibly guide treatment in the future. However, owing to the high incidence of MIs, the use of ICMs or extended external devices for this purpose would require vast amounts of resources, stressing the need for selecting those MI patients at highest risk of AF development. Echocardiography may aid this risk-stratification process since many patients will have an echocardiogram performed either in the acute phase or in the aftermath of their MI.[9] Measures of the cardiac deformation may reveal systolic impairment missed by the LV ejection fraction (LVEF).[10] The most promising technique for evaluating myocardial deformation is speckle tracking echocardiography, which analyzes speckle motion in gray scale images by the use of dedicated algorithms. Several parameters are obtained by LV speckle tracking, but the most widely investigated is the global peak longitudinal strain (GLS), which is a measure of systolic function (Fig. 1). As such, strain imaging by GLS is gradually being implemented to complement the LVEF for the early recognition of compromised systolic function in patients with hypertrophic cardiomyopathy and chemotherapy-induced cardiotoxicity.[11] This measure may additionally serve as a sensitive marker of adverse events, including AF development, and thus assist the selection of patients in need of more vigilant arrhythmia surveillance. We sought to assess whether GLS predicts AF and/or stroke in patients with ST-segment elevation MI (STEMI) treated with primary percutaneous coronary intervention (pPCI).
Figure 1.
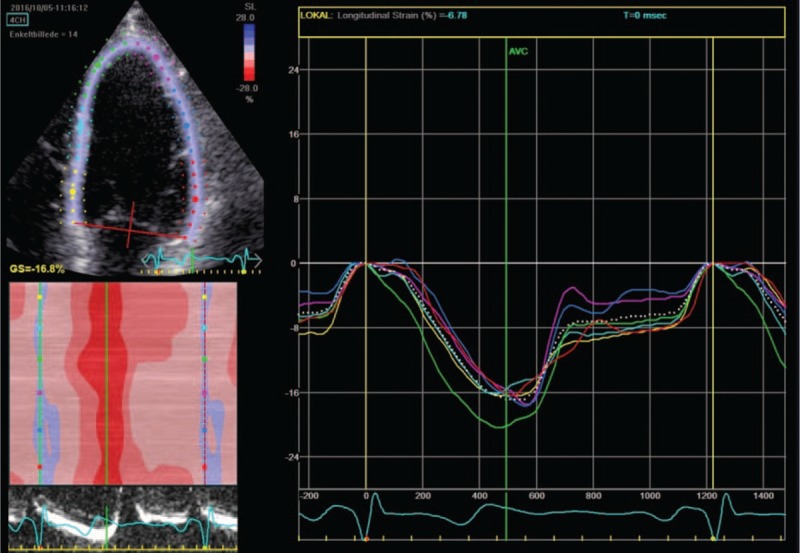
Speckle tracking and global longitudinal strain curve. The figure illustrates myocardial speckle tracking of the left ventricle obtained from the apical 4-chamber view. Each color represents different segments of the left ventricular myocardial wall, and the white dotted line represents the estimated global strain value. When the ventricular myocardium is compressed during systole, the speckles move closer to each other and this is reflected as a negative strain value, with the maximum ventricular deformation occurring at aortic valve closure.
2. Methods
2.1. Population
The study population has previously been described.[12,13] Patients admitted with STEMI and treated with pPCI were prospectively enrolled between September 2006 and December 2008 at Gentofte Hospital, Copenhagen, Denmark. Patients had an extensive echocardiographic examination performed at a median of 2 days after their STEMI. A total of 391 patients were initially included, with 18 patients subsequently excluded due to either poor image quality or known history of AF, leaving 373 for final analysis. The diagnosis of STEMI was based on chest pain persisting for more than 30 minutes, but shorter than 12 hours along with either ST-elevation >2 mm in at least 2 contiguous precordial leads, ST-elevation >1 mm in at least 2 contiguous limb leads, or a newly developed left bundle branch block. Inclusion to the study also required a concomitant Troponin I increase of >0.5 μg/L. Troponin I was measured on admission, 6 hours after admission, and 12 hours after admission. Baseline data were collected upon inclusion to the study. Hypercholesterolemia was defined as the use of cholesterol-lowering medication. Hypertension was defined as the use of blood pressure-lowering medication. Diabetes was defined as the use of glucose-lowering medication, fasting plasma glucose levels >7 mmol/L, or nonfasting plasma glucose levels >11.1 mmol/L. The study was approved by the regional scientific ethics committee and the Danish Data Protection Agency, and was in line with the ethical policy set by the second Declaration of Helsinki.
2.2. Reperfusion and management
All patients were treated with pPCI in accordance with contemporary guidelines.[14] Initial treatment before interventional reperfusion included: 300 mg acetylsalicylic acid, 600 mg clopidogrel, and 10,000 international units of unfractionated heparin. The use of additional treatment, that is, glycoprotein inhibitors, was left to the discretion of the operator. Patients were started in relevant post-MI treatment (antithrombotic, cholesterol-lowering, and β-antagonists) that complied with contemporary guidelines.[14]
2.3. Outcomes and endpoint
The primary endpoint was a composite of new-onset AF and ischemic stroke. Endpoints were obtained by International Classification of Disease (ICD-10) codes from the Danish Board of Health's National Patient Registry.
2.4. Echocardiograms
All echocardiograms were performed by experienced clinicians or sonographers on GE Vivid 7 machines using a 3.5-MHz probe. Echocardiographic investigations were stored on a digital image vault and analyzed offline (EchoPac, GE Healthcare, Horten, Norway) by an investigator experienced in echocardiographic postprocessing analysis, who was blinded to clinical baseline data and endpoints.
2.5. Conventional 2-dimensional echocardiography
Left ventricular dimensions, comprising of interventricular septal wall thickness, LV internal diameter, and LV posterior wall thickness, were measured from the parasternal long-axis view at end diastole. LV filling pressures expressed by mitral valve inflow patterns were measured using Doppler pulsed-wave at the tips of the mitral valve leaflets in the apical 4-chamber view. This was supplemented with pulsed-wave tissue Doppler imaging sampling at the mitral annulus in the lateral and septal walls to obtain early diastolic myocardial velocities (e’). Diastolic dysfunction grade 1 was defined as: e’ <9 cm/s, E/A <0.8, and/or E-wave deceleration time >200 ms and E/e’ ≤8. Diastolic dysfunction grade 2 was defined as: e’ <9 cm/s, E/A 0.8 to 1.5, and/or E wave deceleration time 160 to 200 ms, and E/e’ ≥9 to 12. Diastolic dysfunction grade 3 was defined as: e’ <9 cm/s, E/A ≥2, and/or E-wave deceleration time <160 ms and E/e’ ≥13. LVEF was measured by the modified Simpson biplane method. The end-systolic left atrial (LA) volume was measured by the biplane area-length method and indexed with body surface area.
2.6. Speckle tracking echocardiography
Longitudinal ventricular myocardial strain analysis was performed by speckle tracking from the 3 apical windows: 4-chamber, 2-chamber, and the apical longitudinal long-axis view. The ventricular endocardium was traced by a semiautomated function and manually adjusted by a point-and-click approach if the tracing proved inaccurate. The width of the region of interest was adjusted to encompass the endocardium, myocardium, and epicardium. Each projection covered 6 segments, thereby including 18 segments in total for calculation of the GLS. Segments could be excluded at discretion of the analyst based on obscureness caused by rib artifacts, lung tissue, and so on.
2.7. Statistical analysis
STATA, data analysis, and statistical software, SE 12.0 (StataCorp, TX) was used for statistical calculations. Continuous variables exhibiting Gaussian distribution were compared between the groups by Student t test and expressed as means ± SD. Those not showing Gaussian distribution were compared by Mann–Whitney U test and expressed as medians with interquartile ranges (IQRs). The chi-square test was applied for binary and categorical variables, and expressed as total numbers and percentages. A P value ≤0.05 in 2-tailed tests was considered statistically significant. Univariable Cox regression was conducted to correlate clinical, biochemical, and echocardiographic findings to the combined endpoint of AF and/or stroke. Univariable predictors were incorporated into multivariable Cox regression models to adjust for potential confounders and for calculation of adjusted hazard ratios (HRs). Patients who died during follow-up were censored from the analyses. Harrell c-statistic was calculated from univariable Cox regression for all measures included in the multivariable Cox regression to compare the predictive potential of baseline predictors. Kaplan–Meier curves were constructed for the population stratified into tertiles of GLS.
3. Results
3.1. Endpoint and follow-up
Of the 373 patients included in this study, 44 (12%) of them developed the primary endpoint of new-onset AF or ischemic stroke, 24 (6%) of whom developed new-onset AF, 24 (6%) developed ischemic strokes, with 4 (1%) patients developing both outcomes. The outcome occurring first was used as the index outcome. Follow-up was 100% during a median follow-up period of 5.5 years (IQR 4.9; 6.1 years). Of the patients who developed the outcome of stroke and/or PAF, the median time to outcome was 1.45 years (IQR 0.38; 3.27 years). For the individual endpoints, the median time to AF event was 1.47 years (IQR 0.42; 3.46 years) and the median time to stroke event was 1.38 years (IQR 0.35; 3.26 years).
3.2. Baseline findings
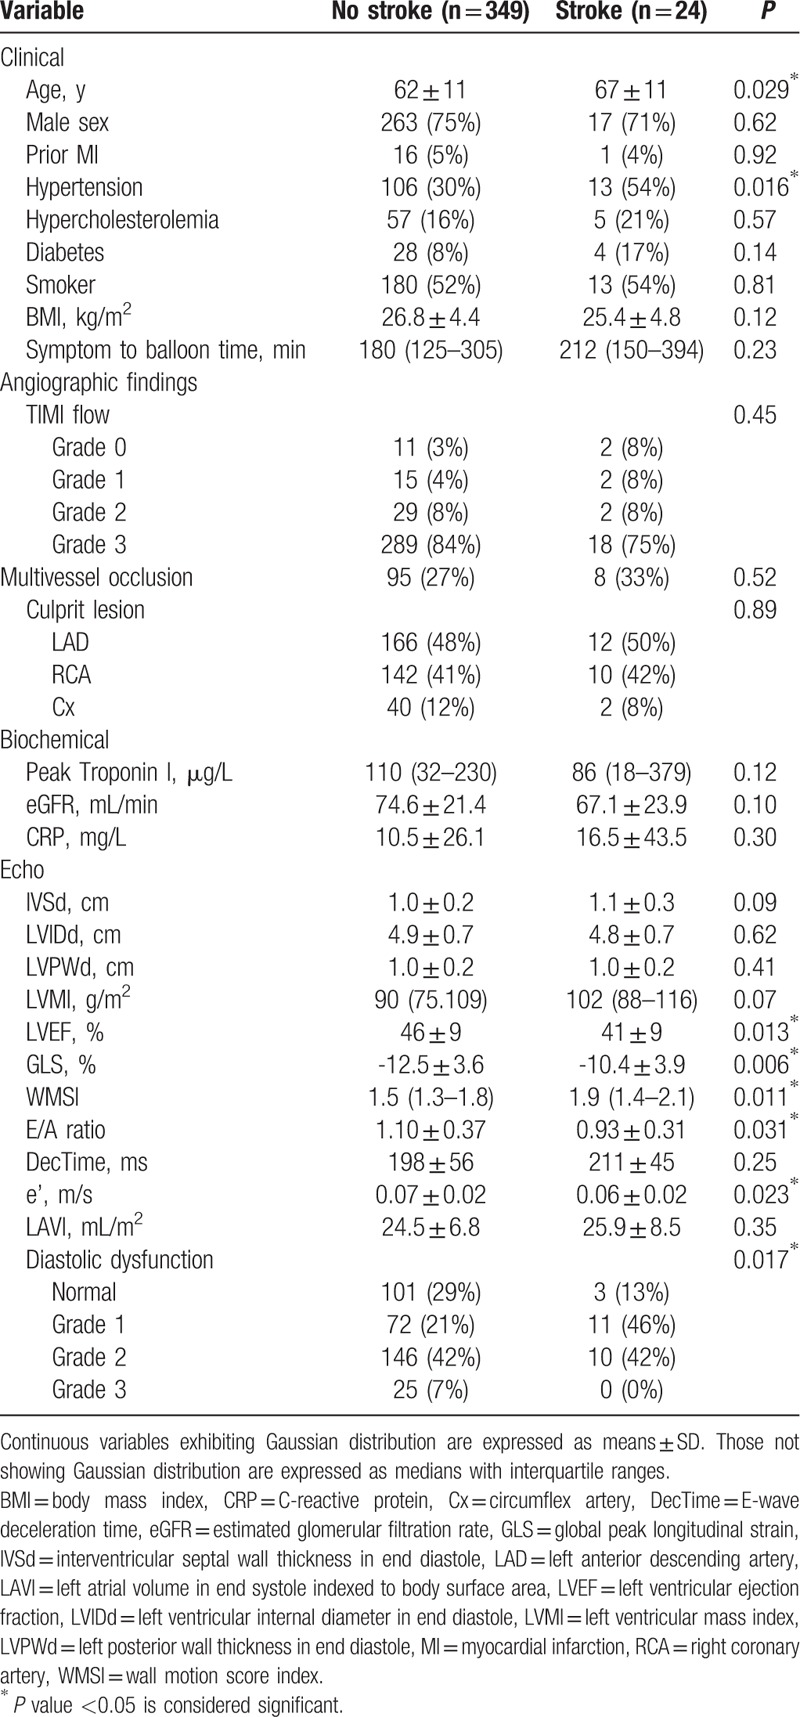
Baseline clinical, biochemical, and echocardiographic characteristics for the population grouped by the primary endpoint are displayed in Table 1. Baseline characteristics for the population stratified by development of new-onset AF and ischemic stroke as separate endpoints are portrayed in Tables 2 and 3, respectively. The majority of patients included in the study were men (75%). Patients who developed the primary endpoint were significantly older than those who did not (67 vs 62 years; P = 0.005). Significantly more in this group had hypertension (50% vs 30%; P = 0.006) and diabetes (18% vs 7%; P = 0.015). Systolic function in the outcome group was significantly reduced by both the LVEF (43% vs 46%; P = 0.042) and GLS (−10.9% vs −12.6%; P = 0.004). They also presented with impaired diastolic function by the e’ (0.07 vs 0.08 m/s; P = 0.006). This diastolic dysfunction was also reflected, although not significantly, in the other diastolic measures [E/A, E-wave deceleration time, indexed LA volume (LAVI), and diastolic dysfunction grading].
Table 1.
Baseline variables for combined outcome of new-onset AF or stroke.
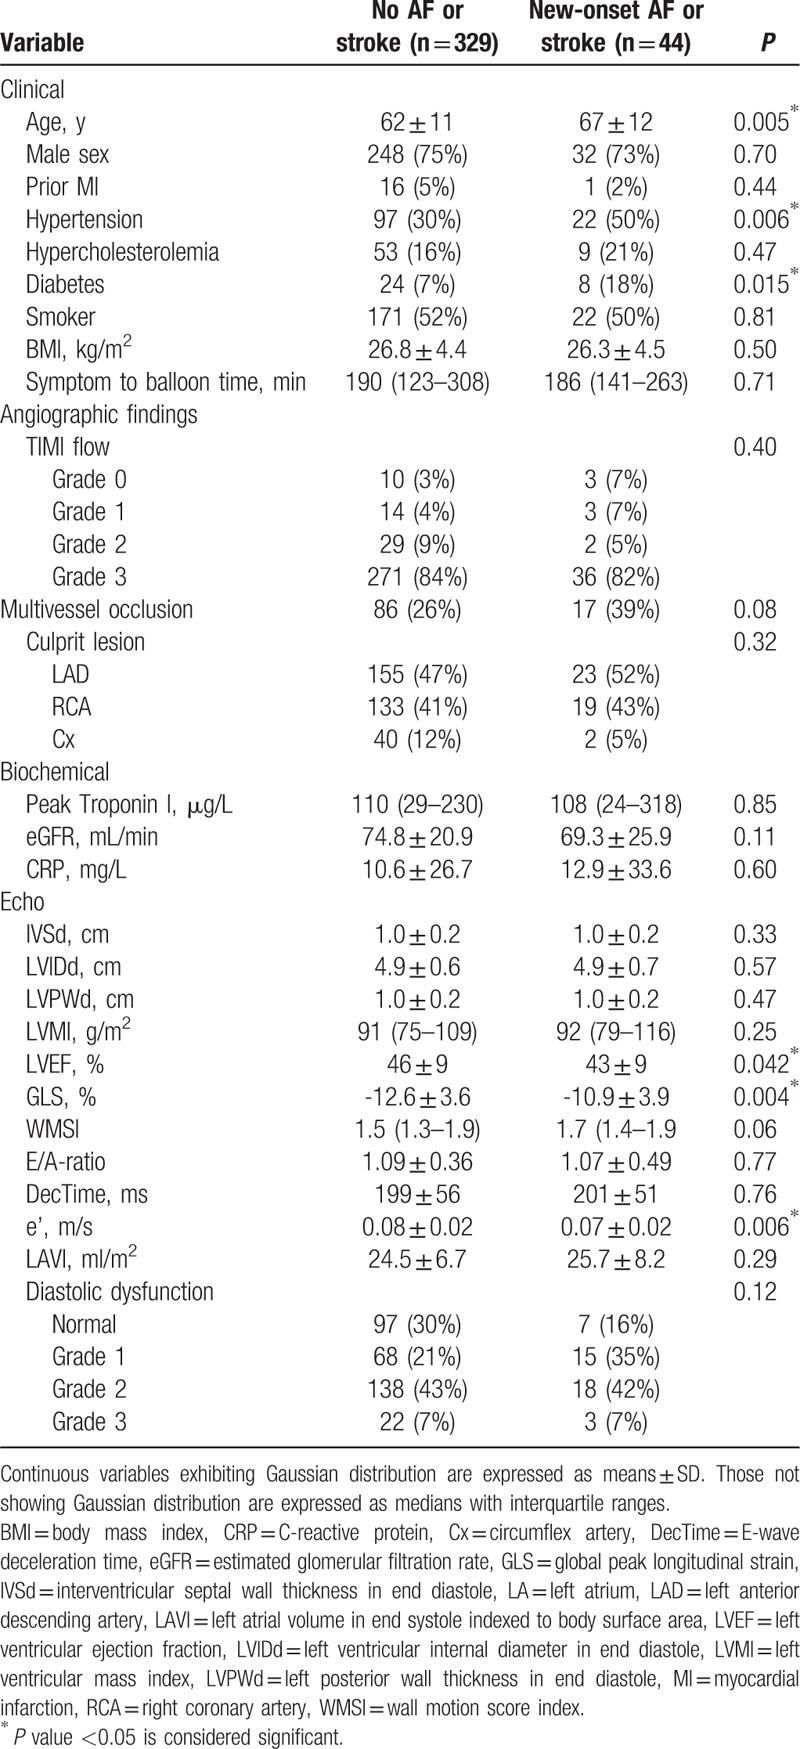
Table 2.
Baseline variables for new-onset AF outcome.
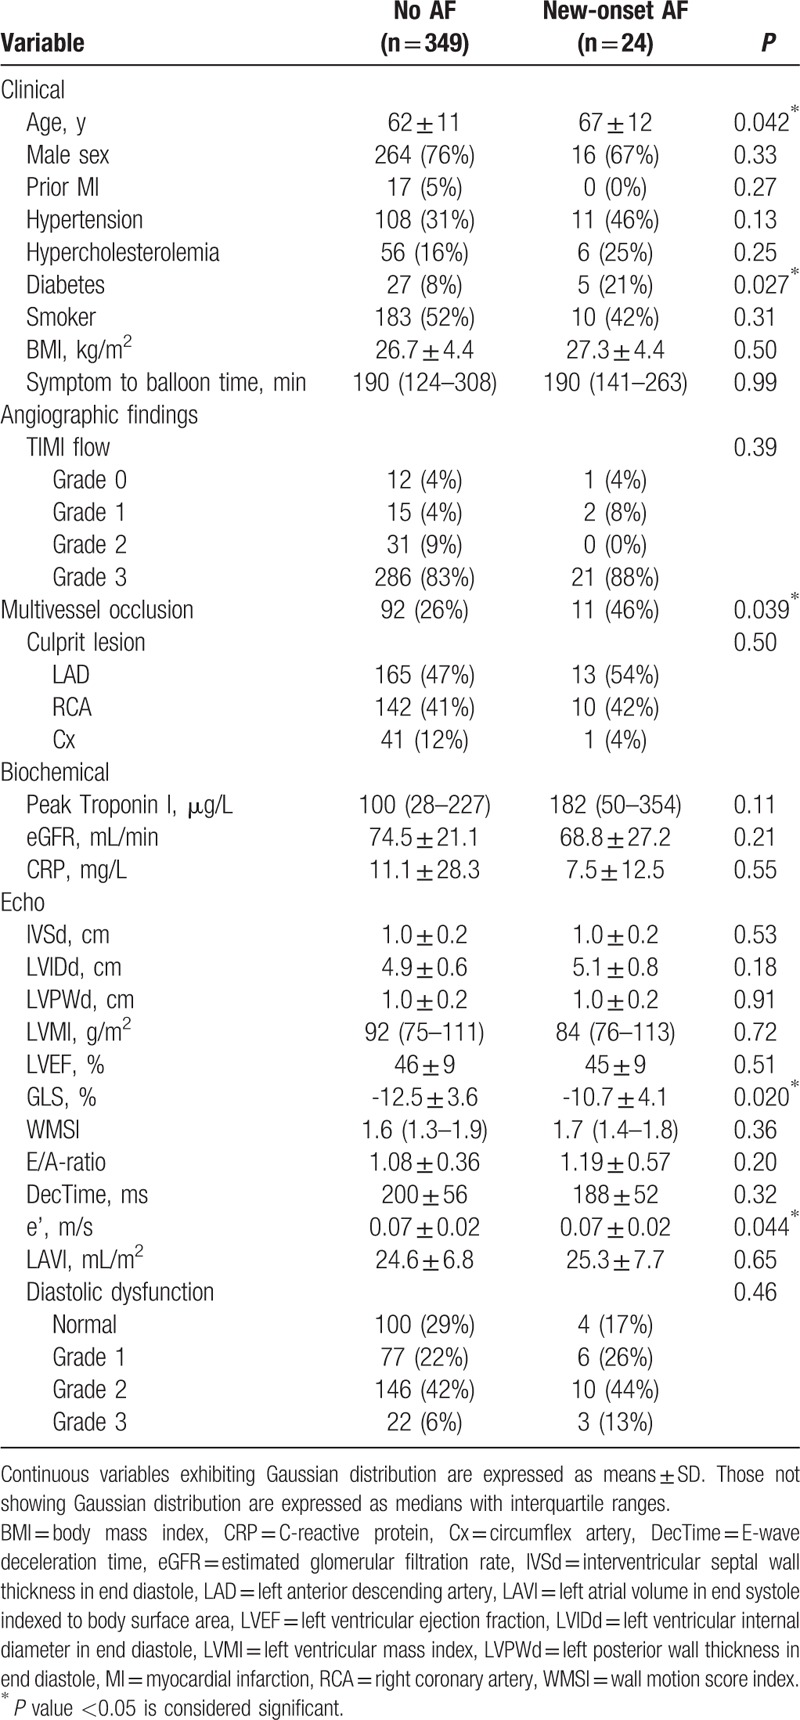
Table 3.
Baseline variables for stroke outcome.
3.3. Prediction of outcome
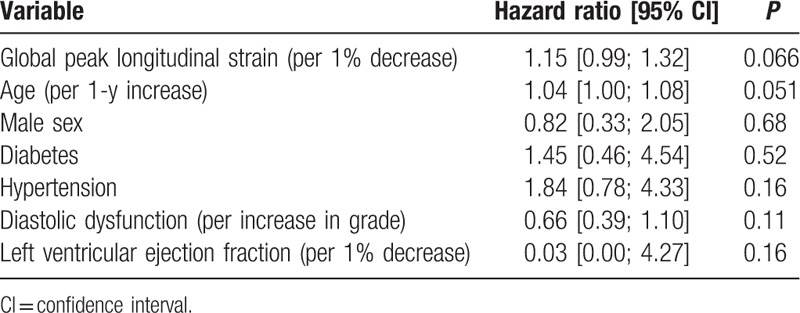
Univariable Cox regression revealed the following parameters to be univariable predictors of the primary endpoint: age, male sex, diabetes, hypertension, diastolic dysfunction, depressed LVEF, and GLS. These were selected for multivariable Cox regression (Table 4), where only reduced GLS and age were left as significantly independent predictors of outcome [GLS: 1.12 (1.00;1.25), P = 0.042 per 1% decrease, and age: 1.04 (1.01;1.07), P = 0.007 per increasing year]. Kaplan–Meier curves for the study population stratified into tertiles of GLS (Fig. 2) showed that the patients in the lowest tertile mediated this increased risk. These had a 2-fold increased risk of developing the primary endpoint compared with the patients in the highest tertile [HR 2.10, 95% confidence interval (CI) 1.04; 4.25]. There was only a marginal difference in prognosis between the patients in the intermediate tertile and those placed in the highest tertile of GLS. Harrell c-statistics revealed that GLS contributed with a higher c-statistics (0.63 vs 0.52; P = 0.026) compared with conventional systolic dysfunction (LVEF <45%), and along with age provided the highest c-statistics among all baseline predictors (Table 4). In subgroup analyses with new-onset AF and ischemic stroke as separate endpoints, GLS was a significantly univariable predictor of both outcomes (HR 1.16, 95% CI 1.03; 1.30, P = 0.013 with AF as outcome; and HR 1.18, 95% CI 1.05; 1.33, P = 0.005 with ischemic stroke as outcome). In the multivariable Cox regression GLS remained a significantly independent predictor of new-onset AF, and was a borderline significant predictor of ischemic stroke (Tables 5 and 6).
Table 4.
Multivariable Cox regression and c-statistics.

Figure 2.
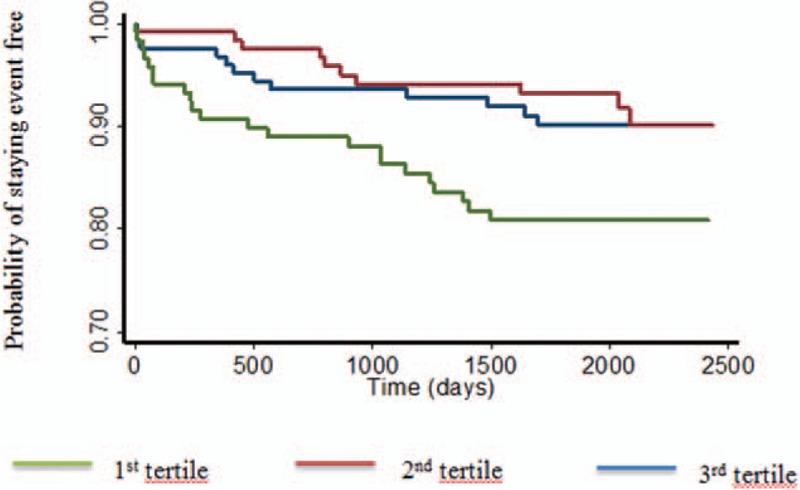
Kaplan–Meier curves for the population stratified by tertiles of global longitudinal strain. The study population was split into 3 groups based on tertiles of global longitudinal strain. The horizontal axis represents time from ST-elevation myocardial infarction expressed in days. The vertical axis represents the cumulative probability of staying event free of the primary endpoint, being AF and/or stroke. The first tertile corresponds to those with lowest values of GLS (>−10.9%), second tertile represents those with intermediate values (−10.9%; −13.7%), and third tertile includes those with highest values (<−13.7%). Patients in the first tertile have a 2-fold increased risk of developing the primary endpoint compared with the third tertile. There is no discernable difference between patients in the second and third tertiles. GLS = global peak longitudinal strain.
Table 5.
Multivariable Cox regression for new-onset AF outcome.
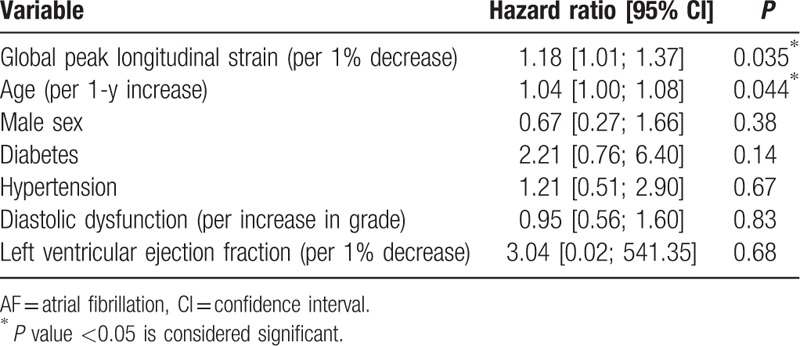
Table 6.
Multivariable Cox regression for ischemic stroke outcome.
4. Discussion
To the best of our knowledge, this is the first prospective study to look at the utility of GLS for predicting AF and ischemic stroke after STEMI. Although GLS was merely a borderline significant predictor of ischemic stroke as a separate endpoint, this may be because of the relatively few events (age was also only a borderline significant predictor). Our subgroup analyses suggest that GLS may actually be equally capable of predicting ischemic stroke as it is for predicting AF, with comparable hazard rates after multivariable adjustment (Tables 5 and 6). This may reflect the close link between these 2 conditions, with many of the patients with ischemic stroke also having AF.[15,16] This study may provide insight into echocardiographic risk stratification for AF development after MIs since other studies have focused primarily on conventional and advanced measures of diastolic function (see below). This study further validates the general prognostic potential of GLS in MI patients that has been established throughout recent years.[17]
4.1. Baseline findings
In this study, AF was more common in patients with hypertension, diabetes, and older age, which is consistent with the literature. All of these variables are included in the CHADS2 and CHA2DS2-VASc scores, which in recent years have been found to be useful prediction models for the development of AF.[18] Originally, these prediction models were constructed for predicting ischemic stroke in patients with AF, but given the shared risk factors for developing stroke and AF, it seems equally capable of predicting AF. For some risk factors, that is, diabetes, the increased risk of AF is largely well-understood. Diabetic neuropathy may explain this increased risk as diabetic patients develop autonomic neuropathy, which predisposes to proarrhythmic conditions and thus AF.[19] Studies have shown that no matter how AF presents in diabetic patients, as asymptomatic or symptomatic, there is an increased likelihood of ischemic strokes,[20] which again stresses the need for increased AF detection and thereby medication for stroke prevention.
4.2. Related studies and clinical relevance
Our findings differ in many ways from existing echocardiographic evidence in that we examined an advanced systolic marker. Even though impaired systolic function by LVEF has been found to correlate with new-onset AF,[18] no investigations of GLS’ predictive ability has been reported for this purpose in MI patients specifically. However, a recent study by Russo et al[21] found that GLS was a strong predictor of incident AF in a community cohort. Furthermore, they found that GLS and LAVI complemented each other well and provided incremental predictive information for the prognosis of AF. This synergy of GLS and LAVI further stresses the need for an integrative assessment of both systolic and diastolic function, when estimating the patient's risk of AF. The application of continuous monitoring has gained increasing attention in several patient groups, and for patients with MI, the Cardiac Arrhythmia and Risk Stratification After Acute Myocardial Infarction (CARISMA) trial has revealed potential for arrhythmia detection. In related patient groups, specifically heart failure patients with reduced ejection fraction, the use of continuous monitoring has shown to translate into a reductions in hospitalization and may improve clinical management in these patients.[22] Thus, continuous monitoring may play a vital role in the future, and detecting patients with systolic dysfunction who develop AF is particularly important, as the TRAndolapril Cardiac Evaluation (TRACE) trial showed that these patients have a worse outcome than those with preserved systolic function and AF.[5] Even though AF is primarily related to diastolic function, this implies that the risk stratification should be devised from a broader perspective to include measures of systolic function. This could be done as a stepwise approach by initially screening MI patients for systolic dysfunction either by LVEF or GLS, and subsequently supplement with an extensive diastolic evaluation, that is, by the below-mentioned measures. As presented by Russo et al,[21] several possible explanations exist for the link between GLS and AF development. One likely explanation is that GLS largely reflects LA reservoir function, and a decrease in GLS is hence a reflection of an impaired reservoir function, which has been shown to be associated with AF development.[23] Other measures of cardiac deformation could be of clinical value for the prediction of AF, and such measures include color tissue Doppler velocities and strain rate measures. Some studies indicate that strain rate measures may be superior to tissue Doppler velocities,[24] and the fact that myocardial speckle tracking is now being implemented clinically makes it more feasible that strain rate will play a bigger part in the echocardiographic assessment in the future compared with tissue Doppler velocities. Our study group recently published a related study, which investigated the value of myocardial deformation for predicting AF in patients with ischemic stroke.[25] In this study, we found that a decrease in atrial contraction, defined as global ventricular strain rate ‘a,’ was associated with an increased risk of AF, which highlights the potential for strain rate measures in the setting of predicting of AF as well. However, in the present study, GLS was the strongest predictor of AF, and the fact that GLS has higher reproducibility and is already implemented clinically favors this parameter over other deformation parameters such as strain rate. Studies looking into echocardiographic predictors of AF complicating MIs are widespread. LA structure and function have been most widely investigated. Partly due to the natural development of AF,[6] but also because LA structure may be less impacted than LV filling pressures by acute hemodynamic alterations instigated by the MI.[8] A recently published study by Galvão Braga et al[26] found systolic dysfunction by LVEF <40% and LA diameter to be independent predictors of new-onset AF in patients presenting with acute coronary syndrome. However, no other measures of LA structure (ie, LA volume) or LA function were reported in this study, and LA diameter is gradually being considered an outdated measure. The LA has on several occasions been found to undergo echocardiographic visible remodeling after MIs.[27–29] Such remodeling expressed as LAVI enlargement may be correlated with AF development and related adverse events after STEMI treated with pPCI.[28] LAVI has itself shown predictive potential in some studies; however, these findings are ambiguous and were not reproduced in our study. The fact that LAVI was not an independent predictor of AF in our population may rely on the fact that LAVI is a marker of chronic pressure overload and remodeling of the LA (expressed by the LAVI) does not appear in the acute setting of MI, but rather as a consequence over a chronic period. Since our patients had their echocardiogram performed in the immediate days after their MI, our findings may suggest that GLS is more sensitive in the acute phase than LAVI, and therefore be a superior marker of incident AF in our study. Some other promising parameters deserves mentioning, and particularly atrial functional parameters, specifically as total atrial conduction time by tissue Doppler imaging (PA-TDI), may convey some relevant knowledge due to the high temporal resolution provided by this modality and has also been subject to investigation. PA-TDI has been shown to predict AF after MI[30] and after revascularization by coronary artery bypass grafting,[31] supposedly because scar tissue will extend the LA electromechanical coupling. However, in the few studies where PA-TDI has been found to be of predictive value of AF after MI, the LA maximal volume has also been found to provide similar prognostic information.[30,31] Arguably, the electromechanical coupling may be prolonged simply because of atrial enlargement, why LA volume may largely influence the predictive capability of PA-TDI. However, this remains to be elucidated when this measure is extended into larger studies. Another hypothesis is that changes in LV filling pressures after MIs may produce a backwards pressure gradient on the LA that could induce LA remodeling and eventually AF. Restrictive LV filling patterns have accordingly been examined in MI patients both by transmitral flow measures[32,33] and by the speckle tracking derived early diastolic strain rate.[34] Jons et al elaborated on the findings made by the CARISMA study[1] and found that different degrees of diastolic dysfunction correlated with AF development diagnosed by ICMs in MI patients with depressed systolic function (LVEF <40%).[32] Aronson et al[33] achieved similar findings in a large prospective cohort, where a restrictive filling pattern was found to be associated with new-onset AF independent of LV systolic function by the LVEF.
4.3. Perspective
Advanced echocardiography may indeed become a valuable tool for the risk stratification of AF in the future. However, it is important to recognize that echocardiography constitutes one part of a large set of paraclinical parameters at our disposal. These other paraclinical parameters include electrocardiographic measures,[35] biomarkers of epigenetic modulation (ie, microRNA),[36] and cardiac biomarkers (pro-atrial natriuretic peptide and pro-brain natriuretic peptide).[37] Finally, the patients’ clinical characteristics are a major determinant of the risk of AF, and clinical risk schemes such as CHADS2 and CHA2DS2-VASc have shown promising for the prediction of AF.[18] Therefore, the optimal risk stratification scheme will have to be devised from a larger perspective which takes all of these parameters into consideration, but echocardiography could play an integral part in this risk stratification.
4.4. Limitations
As we only included patients treated with pPCI who had an echocardiogram performed, we cannot extrapolate our results to all STEMI patients. We obtained the endpoints from ICD-10 codes, meaning that we cannot state how rigorously these patients were monitored for AF, but patients have likely received different strategies for arrhythmia detection. Since we do not have data on the patients cardiac function before admission for acute MI, we cannot exclude the possibility that pre-existing cardiac dysfunction could influence our findings.
5. Conclusions
Global peak longitudinal strain is a significantly independent predictor of AF after STEMI treated with pPCI. This measure could assist in the risk stratification process for AF, although larger studies are needed to validate these findings and elucidate the potential role of this measure.
Footnotes
Abbreviations: AF = atrial fibrillation, CARISMA = Cardiac Arrhythmias and Risk Stratification After Acute Myocardial Infarction study, CHA2DS2-VASc = Congestive heart failure, Hypertension, Age ≥ 75, Diabetes, Stroke-Vascular disease, Age: 65-74, Sex (female). GLS = global peak longitudinal strain, ICD-10 = International Classification of Diseases, ICM = insertable cardiac monitor, IQR = interquartile range, LA = left atrium, LAVI = indexed left atrial end-systolic volume, LV = left ventricle, LVEF = left ventricular ejection fraction, MI = myocardial infarction, PA-TDI = total atrial conduction time by tissue Doppler imaging, pPCI = primary percutaneous coronary intervention, STEMI = ST-elevation myocardial infarction, TRACE = TRAndolapril Cardiac Evaluation study.
Funding: Flemming Javier Olsen was financed by a scholarship grant from the P Carl Petersen foundation during the preparation of this paper. The study was further funded by the Danish Heart Foundation. The sponsors had no role in the study design, data collection, data analysis, data interpretation, or writing of the manuscript.
The authors report no conflicts of interest.
References
- 1.Bloch Thomsen PE, Jons C, Raatikainen MJP, et al. Long-term recording of cardiac arrhythmias with an implantable cardiac monitor in patients with reduced ejection fraction after acute myocardial infarction: the Cardiac Arrhythmias and Risk Stratification After Acute Myocardial Infarction (CARISMA) study. Circulation 2010; 122:1258–1264. [DOI] [PubMed] [Google Scholar]
- 2.Jons C, Thomsen PEB. Treating cardiac arrhythmias detected with an implantable cardiac monitor in patients after an acute myocardial infarction. Curr Treat Options Cardiovasc Med 2012; 14:39–49. [DOI] [PubMed] [Google Scholar]
- 3.Schmitt J, Duray G, Gersh BJ, et al. Atrial fibrillation in acute myocardial infarction: a systematic review of the incidence, clinical features and prognostic implications. Eur Heart J 2009; 30:1038–1045. [DOI] [PubMed] [Google Scholar]
- 4.Ruwald A-CH, Bloch Thomsen PE, Gang U, et al. New-onset atrial fibrillation predicts malignant arrhythmias in post-myocardial infarction patients: a Cardiac Arrhythmias and RIsk Stratification after acute Myocardial infarction (CARISMA) substudy. Am Heart J 2013; 166:855–863. [DOI] [PubMed] [Google Scholar]
- 5.Pedersen OD, Bagger H, Køber L, et al. TRACE Study Group. Impact of congestive heart failure and left ventricular systolic function on the prognostic significance of atrial fibrillation and atrial flutter following acute myocardial infarction. Int J Cardiol 2005; 100:65–71. [DOI] [PubMed] [Google Scholar]
- 6.Camm AJ, Kirchhof P, Lip GYH, et al. Guidelines for the management of atrial fibrillation: the Task Force for the Management of Atrial Fibrillation of the European Society of Cardiology (ESC). Eur Heart J 2010; 31:2369–2429. [DOI] [PubMed] [Google Scholar]
- 7.Ziegler PD, Koehler JL, Mehra R. Comparison of continuous versus intermittent monitoring of atrial arrhythmias. Heart Rhythm 2006; 3:1445–1452. [DOI] [PubMed] [Google Scholar]
- 8.Beinart R, Boyko V, Schwammenthal E, et al. Long-term prognostic significance of left atrial volume in acute myocardial infarction. J Am Coll Cardiol 2004; 44:327–334. [DOI] [PubMed] [Google Scholar]
- 9.O’Gara PT, et al. American College of Emergency Physicians, Society for Cardiovascular Angiography and Interventions. 2013 ACCF/AHA guideline for the management of ST-elevation myocardial infarction: a report of the American College of Cardiology Foundation/American Heart Association Task Force on Practice Guidelines. J Am Coll Cardiol 2013; 61:e78–e140. [DOI] [PubMed] [Google Scholar]
- 10.Biering-Sørensen T, Solomon SD. Assessing contractile function when ejection fraction is normal: a case for strain imaging. Circ Cardiovasc Imaging 2015; 8:e004181. [DOI] [PubMed] [Google Scholar]
- 11.Elliott PM, Anastasakis A, et al. Authors/Task Force members. 2014 ESC Guidelines on diagnosis and management of hypertrophic cardiomyopathy: the Task Force for the Diagnosis and Management of Hypertrophic Cardiomyopathy of the European Society of Cardiology (ESC). Eur Heart J 2014; 35:2733–2779. [DOI] [PubMed] [Google Scholar]
- 12.Biering-Sørensen T, Jensen JS, Pedersen S, et al. Doppler tissue imaging is an independent predictor of outcome in patients with ST-segment elevation myocardial infarction treated with primary percutaneous coronary intervention. J Am Soc Echocardiogr 2014; 27:258–267. [DOI] [PubMed] [Google Scholar]
- 13.Biering-Sørensen T, Mogelvang R, Søgaard P, et al. Prognostic value of cardiac time intervals by tissue Doppler imaging M-mode in patients with acute ST-segment-elevation myocardial infarction treated with primary percutaneous coronary intervention. Circ Cardiovasc Imaging 2013; 6:457–465. [DOI] [PubMed] [Google Scholar]
- 14.Antman EM, Anbe DT, Armstrong PW, et al. ACC/AHA guidelines for the management of patients with ST-elevation myocardial infarction--executive summary. A report of the American College of Cardiology/American Heart Association Task Force on Practice Guidelines (Writing Committee to revise the 1999 guidelines for the management of patients with acute myocardial infarction). J Am Coll Cardiol 2004; 44:671–719. [DOI] [PubMed] [Google Scholar]
- 15.Ihle-Hansen H, Thommessen B, Wyller TB, et al. Risk factors for and incidence of subtypes of ischemic stroke. Funct Neurol 2012; 27:35–40. [PMC free article] [PubMed] [Google Scholar]
- 16.Sanna T, Diener H-C, Passman RS, et al. Cryptogenic stroke and underlying atrial fibrillation. N Engl J Med 2014; 370:2478–2486. [DOI] [PubMed] [Google Scholar]
- 17.Ersbøll M, Valeur N, Mogensen UM, et al. Prediction of all-cause mortality and heart failure admissions from global left ventricular longitudinal strain in patients with acute myocardial infarction and preserved left ventricular ejection fraction. J Am Coll Cardiol 2013; 61:2365–2373. [DOI] [PubMed] [Google Scholar]
- 18.Ruwald AC, Gang U, Thomsen PEB, et al. The predictive value of CHADS2 risk score in post myocardial infarction arrhythmias: a Cardiac Arrhythmias and RIsk Stratification after Myocardial infArction (CARISMA) substudy. Int J Cardiol 2014; 173:441–446. [DOI] [PubMed] [Google Scholar]
- 19.Rizzo MR, Sasso FC, Marfella R, et al. Autonomic dysfunction is associated with brief episodes of atrial fibrillation in type 2 diabetes. J Diabetes Complications 2015; 29:88–92. [DOI] [PubMed] [Google Scholar]
- 20.Marfella R, Sasso FC, Siniscalchi M, et al. Brief episodes of silent atrial fibrillation predict clinical vascular brain disease in type 2 diabetic patients. J Am Coll Cardiol 2013; 62:525–530. [DOI] [PubMed] [Google Scholar]
- 21.Russo C, Jin Z, Sera F, et al. Left ventricular systolic dysfunction by longitudinal strain is an independent predictor of incident atrial fibrillation: a community-based cohort study. Circ Cardiovasc Imaging 2015; 8:e003520. [DOI] [PMC free article] [PubMed] [Google Scholar]
- 22.Sardu C, Santamaria M, Rizzo MR, et al. Telemonitoring in heart failure patients treated by cardiac resynchronisation therapy with defibrillator (CRT-D): the TELECART Study. Int J Clin Pract 2016; 70:569–576. [DOI] [PMC free article] [PubMed] [Google Scholar]
- 23.Abhayaratna WP, Fatema K, Barnes ME, et al. Left atrial reservoir function as a potent marker for first atrial fibrillation or flutter in persons > or = 65 years of age. Am J Cardiol 2008; 101:1626–1629. [DOI] [PubMed] [Google Scholar]
- 24.Vicario MLE, Caso P, Martiniello AR, et al. Effects of volume loading on strain rate and tissue Doppler velocity imaging in patients with idiopathic dilated cardiomyopathy. J Cardiovasc Med (Hagerstown) 2006; 7:852–858. [DOI] [PubMed] [Google Scholar]
- 25.Olsen FJ, Jørgensen PG, Møgelvang R, et al. Predicting paroxysmal atrial fibrillation in cerebrovascular ischemia using tissue Doppler imaging and speckle tracking echocardiography. J Stroke Cerebrovasc Dis 2015; 25:350–359. [DOI] [PubMed] [Google Scholar]
- 26.Galvão Braga C, Ramos V, Vieira C, et al. New-onset atrial fibrillation during acute coronary syndromes: predictors and prognosis. Rev Port Cardiol 2014; 33:281–287. [DOI] [PubMed] [Google Scholar]
- 27.Ahn S-G, Shin J-H, Koh B-R, et al. Impact of myocardial perfusion on left atrial remodeling following primary angioplasty for acute myocardial infarction. Coron Artery Dis 2006; 17:597–603. [DOI] [PubMed] [Google Scholar]
- 28.Cho JH, Kim SH, Kim Chwan, et al. Prognostic value of left atrium remodeling after primary percutaneous coronary intervention in patients with ST elevation acute myocardial infarction. J Korean Med Sci 2012; 27:236–242. [DOI] [PMC free article] [PubMed] [Google Scholar]
- 29.Antoni ML, Ten Brinke EA, Marsan NA, et al. Comprehensive assessment of changes in left atrial volumes and function after ST-segment elevation acute myocardial infarction: role of two-dimensional speckle-tracking strain imaging. J Am Soc Echocardiogr 2011; 24:1126–1133. [DOI] [PubMed] [Google Scholar]
- 30.Antoni ML, Bertini M, Atary JZ, et al. Predictive value of total atrial conduction time estimated with tissue Doppler imaging for the development of new-onset atrial fibrillation after acute myocardial infarction. Am J Cardiol 2010; 106:198–203. [DOI] [PubMed] [Google Scholar]
- 31.Özlü MF, Erdem K, Kırış G, et al. Predictive value of total atrial conduction time measured with tissue Doppler imaging for postoperative atrial fibrillation after coronary artery bypass surgery. J Interv Card Electrophysiol 2013; 37:27–33. [DOI] [PubMed] [Google Scholar]
- 32.Jons C, Joergensen RM, Hassager C, et al. Diastolic dysfunction predicts new-onset atrial fibrillation and cardiovascular events in patients with acute myocardial infarction and depressed left ventricular systolic function: a CARISMA substudy. Eur J Echocardiogr 2010; 11:602–607. [DOI] [PubMed] [Google Scholar]
- 33.Aronson D, Mutlak D, Bahouth F, et al. Restrictive left ventricular filling pattern and risk of new-onset atrial fibrillation after acute myocardial infarction. Am J Cardiol 2011; 107:1738–1743. [DOI] [PubMed] [Google Scholar]
- 34.Ersbøll M, Andersen MJ, Valeur N, et al. Early diastolic strain rate in relation to systolic and diastolic function and prognosis in acute myocardial infarction: a two-dimensional speckle-tracking study. Eur Heart J 2014; 35:648–656. [DOI] [PubMed] [Google Scholar]
- 35.Binici Z, Intzilakis T, Nielsen OW, et al. Excessive supraventricular ectopic activity and increased risk of atrial fibrillation and stroke. Circulation 2010; 121:1904–1911. [DOI] [PubMed] [Google Scholar]
- 36.Sardu C, Santamaria M, Paolisso G, et al. microRNA expression changes after atrial fibrillation catheter ablation. Pharmacogenomics 2015; 16:1863–1877. [DOI] [PubMed] [Google Scholar]
- 37.den Uijl DW, Delgado V, Tops LF, et al. Natriuretic peptide levels predict recurrence of atrial fibrillation after radiofrequency catheter ablation. Am Heart J 2011; 161:197–203. [DOI] [PubMed] [Google Scholar]


