

Abstract
The SEIR (Susceptible-Exposed-Infected-Recovered) model is used to describe the transmission of dengue virus. The main contribution is determining the role of the rainfall in Thailand in the model. The transmission of dengue disease is assumed to depend on the nature of the rainfall in Thailand. We analyze the dynamic transmission of dengue disease. The stability of the solution of the model is analyzed. It is investigated by using the Routh-Hurwitz criteria. We find two equilibrium states: a disease-free state and an endemic equilibrium state. The basic reproductive number (R0) is obtained, which indicates the stability of each equilibrium state. Numerical results taking into account the rainfall are obtained and they are seen to correspond to the analytical results.
1. Introduction
Dengue disease is caused by the dengue virus that is transmitted to human by the bite of a mosquito. The mosquito is the vector of this disease. The spread of dengue disease depends on the contact between the human and the mosquitoes. Therefore, the way to control dengue virus transmission is to either control the mosquito vectors or interrupt the human-vector contact [1]. Outbreaks of dengue disease often occur in most tropical countries around the world, with close to 75% of the global population exposed to the disease living in the Asia-Pacific region [2]. Four serotypes of the dengue virus, DEN1–DEN4, are responsible for the disease in humans. They are all transmitted to human through the bites of infected Aedes aegypti and Aedes albopictus mosquitoes. When the mosquitoes are in immature or lava stages, they are usually found in water-filled habitats such as water containers close to dwellings of humans. In the adult stages, the mosquitoes may spend most of their lifetimes around the homes of humans. This would lead to the mosquitoes being able to transmit the dengue virus rapidly between the communities.
In Thailand, dengue disease has been reported nationwide in all parts of Thailand, including the Bangkok metropolitan area in which three forms of dengue disease, dengue fever (DF), dengue hemorrhagic fever (DHF), and dengue shock syndrome (DSS), were reported. The three categories are based on the clinical presentation of patients. The most severe form of dengue disease is DSS [1, 2]. It reappears on a regular basis every year with the peak during the rainy season, June–August. The amount of rainfall is the single most important factor for dengue virus transmission, since this condition is most suitable for mosquitoes to lay their eggs and for the humans and mosquito to come into contact. The historical data in Thailand indicates that the number of reported cases correlates with the average amount of rainfall. The relationships between average monthly dengue reported cases and average monthly amount of rainfall during 2003–2015 in Thailand and Bangkok metropolitan area are presented in Figures 1 and 2, respectively [3].
Figure 1.

Average monthly rainfall and dengue reported cases during 2003–2015 in Thailand [3].
Figure 2.
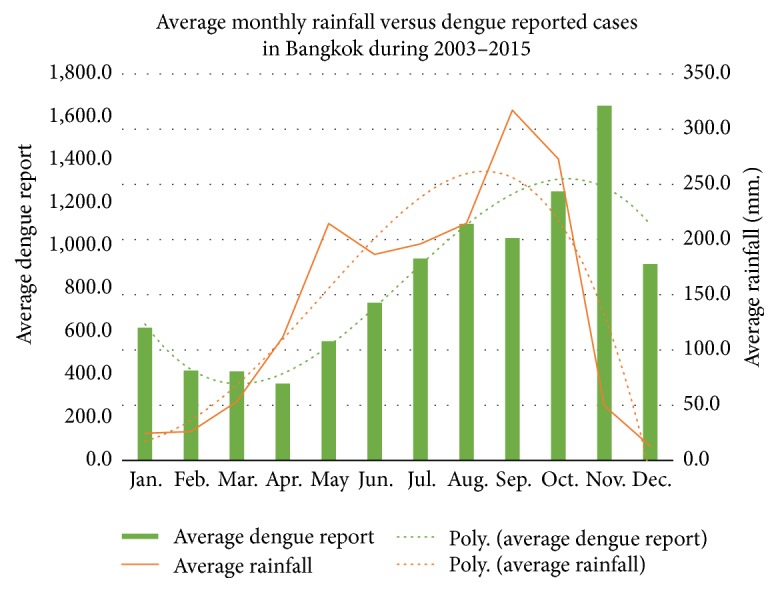
Average monthly rainfall and dengue reported cases during 2003–2015 in Bangkok [3].
As we can see from Figures 1 and 2, the correlation between the amount of rainfall and the number of reported cases of dengue disease in the period of this study is cosine function dependence corresponding to the study of Stolwijk et al. [4]. When mosquito bites an infectious human being, the mosquito will be feeding on the infected blood. As a consequence, the mosquito receives the dengue viruses and will be a vector for the transmission of the dengue viruses. The dengue disease epidemic can then be analyzed in order to determine a set of parameter values that will allow a strategy to control the spread of the disease when other factors are taken into account. The mathematical model to be developed will be a SEIR (Susceptible-Exposed-Infected-Recovered) mathematical model. Mathematical models have long been used to describe the dengue transmission.
Esteva and Vargas [5] proposed a model with a constant human population and variable vector population model to describe the transmission of dengue disease and studied the global stability of the endemic equilibrium. Polwiang [6] presented a mathematical model for general vector-host infectious disease and used the reproduction number as a means to evaluate the potential, severity, and persistence of dengue infection. The dengue infection will depend on the seasonal variation of the climate and the rainfall which will affect the breeding pool for the mosquitoes to lay their eggs and to develop into the adult stage. Rodrigues et al. [7] presented disease transmission with the effects of seasonality on the vectorial capacity and, consequently, on the disease development. Using entomological information of the mosquito's behavior under different temperatures and rainfall, the time development of the epidemics was simulated and analyzed. Chompoosri et al. [8] introduced seasonal dengue infection rates in the Aedes aegypti mosquitoes to study the dengue infection in suspected patients in 4 central provinces of Thailand. Dengue morbidity rates used for the patients in all 4 provinces were taken to be the highest in rainy season. Kesorn et al. [9] discovered that the Aedes aegypti female and larvae mosquito infection rates significantly positively associated with the morbidity rate, where the increasing infection rate of female mosquitoes and larvae led to a higher number of dengue cases. This result supports regarding the largest female populations to be present in the rainy season (May-June) in Thailand, in which the biting activity rate of female mosquitoes increases and more dengue cases occur. Siriyasatien et al. [10] found that female mosquitoes and seasons were strongly correlated with dengue cases in Thailand in which infected female mosquitos together with season are directly correlated to the number of dengue cases. Pongsumpun and Tang [11] analyzed a model when a seasonal variation in the incubation period of the virus while it was developing in the mosquito was included in the model. The annual variation in the length of the extrinsic incubation period was considered by using standard dynamical modeling method to analyze the Susceptible-Exposed-Infected-Recovered (SEIR) model. Chanprasopchai and Pongsumpun [12] used a mathematical model for transmission dynamics of dengue based on the Susceptible-Infected-Recovered (SIR) model. The standard dynamical modeling techniques were used to analyze that model. Relations between each individual variable in the model and the biting rate of mosquito were obtained. Sungchasit et al. [13] later proposed a transmission model of dengue virus in which there were two mosquito species, Aedes aegypti and Aedes albopictus, causing the infection. Separate SIR (Susceptible-Infected-Recovered) models were proposed to describe the dengue virus transmission by two mosquito species. Pongsumpun and Tang [14] proposed the transmission of dengue hemorrhagic fever by Susceptible-Infected-Recovered model considering the influence of age structure in human population. Human population was divided into two groups, adult and juvenile groups, in order to analyze the dengue disease transmission and the equilibrium state, stability, and numerical calculation were presented. Adams et al. [15] proposed the epidemic pattern observed in Bangkok regarding the result of cross-protective immunity and presented significantly altered changes in the interserotypic immune reaction. They used records of the annual number of confirmed cases of dengue in Bangkok between 1977 and 2000 and used a mathematical model based on standard SIR formulation forced with an annually periodic transmission rate cosine function representing seasonal fluctuations in the vector population.
In this study, we consider the transmission of dengue disease by using mathematical model to investigate the dengue disease mechanism with the effect of rainy season taken into account. The transmission rates of dengue virus vary during the season. The Routh-Hurwitz criteria are applied to analyze the system stability of the SEIR model and the dynamical transmission model of dengue disease is proposed. The equilibrium state and stability, numerical simulation and results, and conclusion are presented.
2. Materials and Methods
2.1. Mathematical Model
The SEIR mathematical model consists of two population compartments, human's population and mosquito's population. Human's population includes four epidemiological states, Susceptible human (), Exposed human (), Infected human (), and Recovered human (), whereas mosquito's population is divided into 3 epidemiological states, Susceptible vector (), Exposed vector (), and Infected vector (). The mosquito's population cannot recover from infection which has no recovery epidemiological states. The dynamical transmission between human's population and mosquito's populations is shown in Figure 3.
Figure 3.

The dynamical transmission of dengue disease.
In the figure, is number of susceptible humans at any time t, is number of susceptible vectors at any time t, is number of exposed humans at any time t, is number of exposed vectors at any time t, is number of infected humans at any time t, is number of infected vectors at any time t, is number of recovered humans at any time t, βH, βV are transmission probabilities of dengue virus from vector to human and from human to vector, εH is intrinsic incubation rate, εV is extrinsic incubation rate, μH, μV are death rates of human and vector, λH, γH are birth rate of human and recovery rate of human, respectively, A, b are constant recruitment rate and biting rate, respectively, α, θ are amplitude and horizontal shift of the cosine function, and a, T are time period and number of time periods.
To simplify the model, we assume that both the human and mosquito populations are constant and there is no vertical transmission; that is, the eggs cannot be infected by sexual contacts between the male and female mosquitoes. It means that total human population is and total mosquito population is . The mathematical descriptions of the processes shown in Figure 3 are the seven differential equations given as follows:
| (1) |
| (2) |
Since we have assumed that the total human and mosquito populations are constant, we have
| (3) |
with
| (4) |
Equations (1) and (2) can be normalized as follows: we first define the normalized variables as
| (5) |
with
| (6) |
Then, there are only five independent variables and only five differential equations are needed. We pick them to be
| (7) |
We now have five time differential equations involving five independent normalized population groups (SH, EH, IH, SV, IV). We can set the RHS of (7) to zero and find the equilibrium (time-independent) populations. There will be two equilibrium states for each population group, a disease-free equilibrium point and an endemic equilibrium point (one with IV1(2) = 0 and the other ≠ 0). Calling the five equilibrium points for the five populations Xi (i = 1,2,…, 5) and letting each of the independent population groups be equal to the equilibrium point plus a perturbation Vi which is time-dependent, we insert these new forms of the solution into (7) and expand the RHS about the equilibrium populations. Doing this, we get the 5 × 5 matrix equation.
| (8) |
where J is the gradient matrix evaluated at the equilibrium points or “the Jacobian matrix.”
2.2. Mathematical Analysis for Equilibrium Point
The stability of the solutions of (7) will be considered for 2 cases, one where θ ≠ a/T and one where θ = a/T. It should be noted that when θ = a/T, the argument of the cosine function will be zero, meaning that there are no changes in the rate of infection due to increasing or decreasing rainfall. For θ ≠ a/T, the value of cosine function will change during the rainy season and will vary according to the amount of rainfall, meaning that the rate of transmission will change during the rainy season. The change in rate could be due to the fact that more eggs can be laid or developed quicker or slower depending on the amount of rain that has fallen. It is also well known that climatic factors control the development of the mosquitoes and of the dengue virus.
In either case, the equilibrium points must first be determined. This is done by setting the right-hand side of (7) to zero. Doing this, we obtain two solutions: one will be the disease-free equilibrium point (E1) and the other will be the endemic equilibrium point (E2). The two possible solutions depend on whether we take IV = 0 or IV ≠ 0. After much work, we find that
| (9) |
where
| (10) |
All parameters in the system should be positive definite and the epidemic region of system will be restricted to the region of interest given by
| (11) |
2.3. Mathematical Analysis for Local Stability
The equilibrium states are locally asymptotically stable if all the eigenvalues obtained by solving the eigenvalues equation Det | J − λI | = 0 have negative imaginary parts. This will be true if the characteristic equation has coefficients which satisfy the Routh-Hurwitz criteria. Performing the calculations, we find that the Jacobian matrix for (7) is just
| (12) |
The stability is usually expressed in terms of what is known as the basic reproduction number. This is the number of secondary infections which is produced by a case of an infection in a population of its infectious period (√R0). This number is the best indicator of the potential for disease transmission.
Proposition 1 . —
The equilibrium state E1 is asymptotically stable when R0 is lower than 1; that is, R0 < 1 and θ ≠ a/T.
Proof —
The local stability of E1 is governed by linearization of (7). Rearranging the expressions for the equilibrium values of IH or EH so that they would be in a form ∝R − 1, we find that R0 will be of the following form:
(13) The eigenvalues of (12) are used to evaluate the disease-free equilibrium point which is determined by solving
(14) where JE1 is the Jacobian matrix at the equilibrium point E1, λ are eigenvalues, and I5 is identity 5 × 5 matrix.
Evaluating the determinant of (12), we obtain the following characteristic equation:
(15) where
(16) Routh-Hurwitz criteria required for all of the eigenvalues (solutions) defined by (12) are negative real parts and the coefficients must satisfy all conditions given as follows:
(17) When this happens and for R0 < 1, disease-free equilibrium will be stable as is seen in Figure 4.
Figure 4.

All parameters spaces of disease-free equilibrium of E1 satisfy the Routh-Hurwitz criteria. All parameter values are NH = 9,200, b = 1/3, μH = 1/(70∗365), γH = 1/3, βH = 0.1, βV = 0.1, μV = 1/14, εV = 0.1428, εH = 0.1667, and A = 500.
Proposition 2 . —
The equilibrium state E2 is asymptotically stable when R0 is higher than 1; R0 > 1 and θ ≠ a/T.
Proof —
The local stability of E2 is governed by linearization of (7). The characteristic equation is now
(18) where
(19) where
(20) The endemic equilibrium point of local stability of the system will have negative real parts when the coefficients in the characteristic equation (18) satisfy the Routh-Hurwitz conditions now given by
(21) All conditions of (21) are satisfied for endemic equilibrium point as is evident by the behaviors seen in Figure 5. Next, we consider the case of θ = a/T; (7) will be the standard case of SEIR model, where no effects of rainfall are taken into account. As a result, the mathematical equations describing the model are
(22) R0 obtained from (22) is as follows:
(23)
Figure 5.

All parameters spaces of endemic equilibrium of E2 satisfy the Routh-Hurwitz criteria. All parameter values are NH = 9,200, b = 1/3, μH=1/(70∗365), γH = 1/3, βH = 0.5, βV = 0.3, μV = 1/14, εV = 0.1428, εH = 0.1667, and A = 500.
3. Numerical Results
The transmission of dengue disease in this study is based on the SEIR model. The susceptible class will be people who have no immunity and who are not infectious. Human beings infected are people who are infectious, that is, able to pass on the virus onto the mosquitoes. The infectious period will be taken to be the period during which the person appears to be sick, a period of one to two weeks. When human gets well, the patient passes into the recovery class with lifelong immunity to the virus. In this study, the numerical simulations assume the following values of the parameters; μH = 1/(70∗365) per day corresponding to a life expectancy of 70 years in Thai people, A = 5,000 corresponding to constant recruitment rate, NH = 92,000 corresponding to total number of human population, and b = 1/3 corresponding to biting rate of vector population.
For case 1, the values of the parameters of case 1 for disease-free equilibrium are μV = 1/14, γH = 1/3, βH = 0.1, βV = 0.1, εV = 0.1428, and εH = 0.1667 which will lead to R0 < 1, while the set of values of the parameters of case 2 are μV = 1/14, γH = 1/3, βH = 0.5, βV = 0.3, εV = 0.1428, and εH = 0.1667 which will lead to R0 > 1. The trajectories of the numerical solutions for case 1 and for case 2 of SH, EH, IH, EV, and IV are shown in the Figures 6 and 7, respectively. The trajectories of the numerical solutions for case 1 and case 2 plotted in the 2D (SH, EH), (SH, IH), (SH, EV), and (SH, IV) planes are shown in Figures 8 and 9, respectively. The trajectories of the numerical solutions for case 1 and case 2 in the 3D (SH, EH, IH), (SH, EH, EV), (SH, EH, IV), (SH, EV, IV), (EH, EV, IV), and (IH, EV, IV) spaces are shown in Figures 10 and 11, respectively.
Figure 6.

The trajectories of the time evolutions of the five population groups, SH, EH, IH, EV, and IV, towards the disease-free equilibrium.
Figure 7.

The trajectories of the time evolution of SH, EH, IH, EV, and IV based on numerical solving.
Figure 8.

The trajectories of the numerical solutions of dengue disease for disease-free equilibrium projected onto (SH, EH), (SH, IH), (SH, EV), and (SH, IV).
Figure 9.

The trajectories of the numerical solutions of dengue disease for endemic equilibrium projected onto (SH, EH), (SH, IH), (SH, EV), and (SH, IV).
Figure 10.

The trajectories of the numerical solutions of dengue disease for disease-free equilibrium projected onto (SH, EH, IH), (SH, EH, EV), (SH, EH, IV), (SH, EV, IV), (EH, EV, IV), and (IH, EV, IV).
Figure 11.

The trajectories of the numerical solutions of dengue disease for endemic equilibrium projected onto (SH, EH, IH), (SH, EH, EV), (SH, EH, IV), (SH, EV, IV), (EH, EV, IV), and (IH, EV, IV).
4. Discussion and Conclusion
The effect of rainfall on the dynamic transmission of dengue disease in Thailand has been studied using the SEIR model to model the dynamics of the dengue epidemic in Thailand. The analysis is based on using the Routh-Hurwitz criteria to establish the local asymptotic stability of the equilibrium points. Two equilibrium points were found: a disease-free equilibrium point and an endemic equilibrium point. The disease-free equilibrium point, E1, is locally asymptotically stable for R0 < 1 and θ ≠ a/T. The set of differential equations for the SEIR model of the dengue infections were solved for different sets of numerical values of the parameters to obtain the different trajectories of the different population groups in the model. The trajectories were projected into the 2D (SH, EH), (SH, IH), (SH, EV), and (SH, IV) planes and onto the 3D (SH, EH, IH), (SH, EH, EV), (SH, EH, IV), (SH, EV, IV), (EH, EV, IV), and (IH, EV, IV) spaces. These trajectories are shown in Figures 4, 6, 8, and 10, respectively. When the values of the parameters are such that R0 > 1 and θ ≠ a/T, then the trajectories ending at the endemic equilibrium point, E2, are described in Figures 5, 7, 9, and 11. The numerical results correspond to Propositions 1 and 2.
Looking at the figures, we see that everything is determined by whether R0 < 1 or R0 > 1; in the first case, the equilibrium state is the disease-free state, while in the second case, it is the endemic equilibrium state. Everything depends on the form of the expression for R0. In summary, R0 in SEIR model which includes the effect of rainfall is given by (24), while R0 in SEIR model which ignores the effect of rainfall is given by expression (25). R0 value of the SIR model of Esteva and Vargas [5] is given by (26) and the simplest expression is given by Rodrigues et al. [7] in (27).
| (24) |
| (25) |
| (26) |
| (27) |
In expression (26), m is the number of alternative sources of blood, that is, other animals.
In (24), R0 value is considered the effect of rainfall, where Thailand has correlation between rainfall and the prevalence of clinical cases of dengue [16]. Thailand's historical data indicate that rainfall was associated with dengue in many regions, for example, southern [17], northern [18], northeastern [19], and central [20] regions. Dengue disease fluctuation is related to climate variability and seasonal factor is taken into account [10, 21–25] in which the dengue virus transmission is considered as a cosine function [15, 26]. When R0 > 1, this will increase the opportunity of the outbreak situation. R0 is an important indicator, where the realistic controlling of the value of R0 will improve the way to control the outbreak. The value of R0 simulation of endemic equilibrium state and the average amount of rainfall are shown in Figure 12. It is indicated that there is a relation between the value of R0 and the average amount of rainfall.
Figure 12.

The value of R0 simulation of endemic equilibrium state and the average amount of rainfall.
In addition, the suitable ways to control the dengue disease are environmental management to prevent mosquitoes from laying their eggs and breeding and using of personal household protection to prevent contact between human and mosquito [1, 2]. In the present paper, we did not explicitly take into account the egg and aquatic stages of the mosquito development (see (2)) as was done by Erickson et al. [27] and Moulay et al. [28]. The lack of these classes precludes any discussion of the vertical transmission of the disease, since the “sexual” transmission (evidenced by the presence of the DNA fragments of the dengue virus in the larvae and pupae [29]) occurs at these stages.
Acknowledgments
This work is supported by King Mongkut's Institute of Technology Ladkrabang and National Research Council of Thailand.
Conflicts of Interest
The authors declare that there are no conflicts of interest regarding the publication of this paper.
References
- 1.World Health Organization. Dengue: guidelines for diagnosis, treatment, prevention and control . Geneva, Switzerland: 2011. [PubMed] [Google Scholar]
- 2.World Health Organization. Global strategy for dengue prevention and control 2012-2020 . Geneva, Switzerland: 2012. [Google Scholar]
- 3.Annual Epidemiology Surveillance Report 2015. Center of Epidemiological Information, Bureau of Epidemiology, Ministry of Public Health, Bangkok, Thailand, 2015.
- 4.Stolwijk A. M., Straatman H., Zielhuis G. A. Studying seasonality by using sine and cosine functions in regression analysis. Journal of Epidemiology and Community Health . 1999;53(4):235–238. doi: 10.1136/jech.53.4.235. [DOI] [PMC free article] [PubMed] [Google Scholar]
- 5.Esteva L., Vargas C. Analysis of a dengue disease transmission model. Mathematical Biosciences . 1998;150(2):131–151. doi: 10.1016/S0025-5564(98)10003-2. [DOI] [PubMed] [Google Scholar]
- 6.Polwiang S. The seasonal reproduction number of dengue fever: Impacts of climate on transmission. PeerJ . 2015;2015(7) doi: 10.7717/peerj.1069.e1069 [DOI] [PMC free article] [PubMed] [Google Scholar] [Retracted]
- 7.Rodrigues H. S., Monteiro M. T. T., Torres D. F. M. Seasonality effects on dengue: basic reproduction number, sensitivity analysis and optimal control. Mathematical Methods in the Applied Sciences . 2016;39(16):4671–4679. doi: 10.1002/mma.3319. [DOI] [Google Scholar]
- 8.Chompoosri J., Thavara U., Tawatsin A., Anantapreecha S., Siriyasatien P. Seasonal monitoring of dengue infection in Aedes aegypti and serological feature of patients with suspected dengue in 4 Central provinces of Thailand. Thai Journal of Veterinary Medicine . 2012;42(2):185–193. [Google Scholar]
- 9.Kesorn K., Ongruk P., Chompoosri J., et al. Morbidity rate prediction of dengue hemorrhagic fever (DHF) using the support vector machine and the Aedes aegypti infection rate in similar climates and geographical areas. PLoS ONE . 2015;10(5) doi: 10.1371/journal.pone.0125049.e0125049 [DOI] [PMC free article] [PubMed] [Google Scholar]
- 10.Siriyasatien P., Phumee A., Ongruk P., Jampachaisri K., Kesorn K. Analysis of significant factors for dengue fever incidence prediction. BMC Bioinformatics . 2016;17(1, article no. 166) doi: 10.1186/s12859-016-1034-5. [DOI] [PMC free article] [PubMed] [Google Scholar]
- 11.Pongsumpun P., Tang M. I. Effect of the seasonal variation in the extrinsic incubation period on the long term behavior of the dengue hemorrhagic fever epidemic. International Journal of Biological and Medical Sciences . 2008;3(3):208–214. [Google Scholar]
- 12.Chanprasopchai P., Pongsumpun P. The transmission dynamic of SIR modeling for dengue fever with vector infection. Proceedings of the Burapha University International Conference, Global Warming and Its Impact; 3-4 July 2014; Pattaya, Thailand. pp. 295–301. [Google Scholar]
- 13.Sungchasit R., Pongsumpun P., Tang I. M. Transmission model of dengue virus by Aedes aegypti and Aedes albopictus. Far East Journal of Mathematical Sciences . 2013;83(1):85–112. [Google Scholar]
- 14.Pongsumpun P., Tang I. M. Transmission of Dengue hemorrhagic fever in an age structured population. Mathematical and Computer Modelling . 2003;37(9-10):949–961. doi: 10.1016/S0895-7177(03)00111-0. [DOI] [Google Scholar]
- 15.Adams B., Holmes E. C., Zhang C., et al. Cross-protective immunity can account for the alternating epidemic pattern of dengue virus serotypes circulating in Bangkok. Proceedings of the National Academy of Sciences of the United States of America . 2006;103(38):14234–14239. doi: 10.1073/pnas.0602768103. [DOI] [PMC free article] [PubMed] [Google Scholar]
- 16.Wiwanitkit V. An observation on correlation between rainfall and the prevalence of clinical cases of dengue in Thailand. Journal of Vector Borne Diseases . 2006;43(2):73–76. [PubMed] [Google Scholar]
- 17.Promprou S., Jaroensutasinee M., Jaroensutasinee K. Climatic factors affecting dengue haemorrhagic fever incidence in Southern Thailand. Dengue Bulletin . 2005;29:41–48. [Google Scholar]
- 18.Wongkoon S., Jaroensutasinee M., Jaroensutasinee K. Climatic variability and dengue virus transmission in Chiang Rai, Thailand. Biomedica . 2011;27:5–13. [Google Scholar]
- 19.Wongkoon S., Jaroensutasinee M., Jaroensutasinee K. Distribution, seasonal variation & dengue transmission prediction in Sisaket, Thailand. Indian Journal of Medical Research . 2013;138:347–353. [PMC free article] [PubMed] [Google Scholar]
- 20.Wiwanitkit V. Strong correlation between rainfall and the prevalence of dengue in central region of Thailand in 2004. Journal of Rural and Tropical Public Health . 2005;4:41–42. [Google Scholar]
- 21.Hopp M. J., Foley J. A. Worldwide fluctuations in dengue fever cases related to climate variability. Climate Research . 2003;25(1):85–94. doi: 10.3354/cr025085. [DOI] [Google Scholar]
- 22.Toan Do T. T., Martens P., Luu N. H., Wright P., Choisy M. Climatic-driven seasonality of emerging dengue fever in Hanoi, Vietnam. BMC Public Health . 2014;14, article no. 1078 doi: 10.1186/1471-2458-14-1078. [DOI] [PMC free article] [PubMed] [Google Scholar]
- 23.Nishiura H. Mathematical and statistical analyses of the spread of dengue. Dengue Bulletin . 2006;30:51–67. [Google Scholar]
- 24.Andraud M., Hens N., Beutels P. A simple periodic-forced model for dengue fitted to incidence data in Singapore. Mathematical Biosciences . 2013;244(1):22–28. doi: 10.1016/j.mbs.2013.04.001. [DOI] [PubMed] [Google Scholar]
- 25.Tiensuwan M., O'Brien T. Modeling dengue virus infection patients for each severity of dengue disease in Thailand. Far East Journal of Mathematical Sciences . 2013;2013:1–20. [Google Scholar]
- 26.Altizer S., Dobson A., Hosseini P., Hudson P., Pascual M., Rohani P. Seasonality and the dynamics of infectious diseases. Ecology Letters . 2006;9(4):467–484. doi: 10.1111/j.1461-0248.2005.00879.x. [DOI] [PubMed] [Google Scholar]
- 27.Erickson R. A., Presley S. M., Allen L. J. S., Long K. R., Cox S. B. A stage-structured, Aedes albopictus population model. Ecological Modelling . 2010;221(9):1273–1282. doi: 10.1016/j.ecolmodel.2010.01.018. [DOI] [Google Scholar]
- 28.Moulay D., Aziz-Alaoui M. A., Cadivel M. The chikungunya disease: modeling, vector and transmission global dynamics. Mathematical Biosciences . 2011;229(1):50–63. doi: 10.1016/j.mbs.2010.10.008. [DOI] [PubMed] [Google Scholar]
- 29.Martins V. E. P., Alencar C. H., Kamimura M. T., et al. Occurrence of natural vertical transmission of dengue-2 and dengue-3 viruses in Aedes aegypti and Aedes albopictus in Fortaleza, Ceará, Brazil. PLoS ONE . 2012;7(7) doi: 10.1371/journal.pone.0041386.e41386 [DOI] [PMC free article] [PubMed] [Google Scholar]