

Abstract
Although studies have linked soy phytoestrogen 4,7,4-trihydroxyisoflavone genistein (GEN) to reduced type 1 diabetes (T1D) risk, the mechanism of dietary GEN on T1D remains unknown. In our studies, adult non-obese diabetic (NOD) mouse model was employed to investigate the effects of GEN exposure on blood glucose level (BGL), glucose tolerance, gut microbiome, and immune responses. Adult male and female NOD mice were fed with either soy-based or casein-based diet, and received GEN at 20 mg/kg body weight by gavage daily. The BGL and immune responses (represented by serum antibodies, cytokines and chemokines, and histopathology) were monitored, while the fecal gut microbiome was sequenced for 16S ribosomal RNA to reveal any alterations in gut microbial communities. A significantly reduced BGL was found in NOD males fed with soy-based diet on day 98 after initial dosing and an improved glucose tolerance was observed on both diets. In addition, an anti-inflammatory response (suggested by reduced IgG2b and cytokine/chemokine levels, and alterations in the microbial taxonomy) was accompanied by an altered β-diversity in gut microbial species. Among the NOD females exposed to GEN, a later onset of T1D was observed. However, the profiles of gut microbiome, antibodies and cytokines/chemokines were all indicative of pro-inflammation This study demonstrated an association among GEN exposure, gut microbiome alteration, and immune homeostasis in NOD males. Although the mechanisms underlying the protective effects of GEN in NOD mice need to be explored further, the current study suggested a GEN-induced sex-specific effect in inflammatory status and gut microbiome.
Keywords: genistein, hyperglycemia, type 1 diabetes, glucose tolerance, inflammation, NOD mouse, gut microbiome
Introduction
Type 1 diabetes (T1D) is an autoimmune disease in which insulin-secreting pancreatic β cells are selectively destroyed by self-reactive immune responses that are dictated by proinflammatory cytokines (1-3). Isoflavones in soy exert weak estrogen-like (i.e., phytoestrogenic) effects, and the major components in the isoflavone family are genistein (GEN), diadzein, and glycitein. GEN is reported to have anti-diabetic functions, especially in type 2 diabetes (4), and this notion is supported by a number of epidemiological studies (5, 6). In contrast, the associations of high soy consumption and risk of T1D are uncertain and intricate, which may depend on the window of exposures and its interaction with the other dietary intake, as epidemiological evidences are limited (7). The effect of GEN on T1D and glucose regulation has not been fully recognized. However, there have been multiple lines of evidence indicating an association between GEN intake and T1D. GEN administration by gavage reduced the incidence and delayed the onset of T1D in female non-obese diabetic (NOD) adult mouse (8, 9), a strain that spontaneously develops insulitis and shares many similarities with human T1D (10). In addition, our previous studies have shown that GEN decreased blood glucose levels (BGL) in streptozotocin (STZ) - treated male B6C3F1 mice (11), which was due to, at least in part, immunomodulation (e.g., decreased Gr-1+Mac-3- neutrophils). In the current study, the animal model we have used is the NOD mouse. NOD females have a T1D incidence rate of 60-80% with an earlier onset than males (10).
Due to recent advances in molecular biology and DNA sequencing techniques, the gut microbiome has been increasingly subjected to extensive studies. Evidence from both human and animal studies suggest that T1D is originated in the gut, which houses 70% of the body's immune system (12), and is associated with a profound dysbiosis, favoring pro-inflammatory microbial communities. The sex-specific autoimmune disease could also be attributed to differences in gut microbiome (13), which prompted us to study if GEN modulation of T1D was mediated by microbiome. As GEN demonstrates a protective effect on T1D in both males (11, 14) and females (8, 9), we hypothesized that the exposure to GEN in adulthood could: (a) reduce the BGL and insulitis score; (b) lead to an alternation in gut microbiome; and (c) alter the inflammatory status. In addition, sex-specific effect was also expected in the modulation of gut microbiome and immune responses by the phytoestrogen GEN. Our study focused on the association between GEN exposure and BGL from a microbiome perspective, and could be applied as a strategy to evaluate the preventive effects of nutritional products on autoimmune diseases.
Methods
Animal husbandry
NOD mice were initially purchased from Taconic Biosciences (Hudson, NY), and a breeding colony has been maintained in our lab. The mice were housed in the Central Animal Facility located in the College of Veterinary Medicine at University of Georgia (UGA), and kept in standard plastic cages with irradiated laboratory animal bedding (The Andersons company, Maumee, OH), with each cage housing 4-5 mice. The mice were separated from the dams on postnatal day (PND) 21, and were used in this study after reaching sexual maturity (PND 55-60). The cages were maintained at temperature ranged 22–25°C, and relative humidity 50 ± 20 with 12-h light cycles (7:00–19:00). The cages were changed on a bi-weekly basis, or they were changed when the cages became wet because T1D was associated with sanitary conditions. They had free access to water supply from the animal room, and animal procedures were conducted under an animal protocol approved by the UGA Institutional Animal Care and Use Committee (IACUC). The mice were treated humanely, and efforts were made to relieve the suffering (e.g., to avoid excessive handling to lessen the stress).
We have previously found that GEN modulated the immune responses (e.g., IgE production) more when mice were maintained on the soy-based diet than on the soy-free diet (15). Therefore, an initial study was performed using a soy-based diet. A total of forty adult NOD mice (20 males and 20 females) were used for the soy-based diet study. For each sex, the mice were randomized into vehicle control (VH; 25 mM sodium carbonate) and GEN groups according to body weight (BW) and BGL. Starting from PND 55-60, the mice in the GEN groups were gavaged daily with 0.1 ml/10g BW GEN dissolved and sonicated in VH (2 mg GEN/mL) (11), while the VH groups received the same volume of VH daily with 18 G gavage needles. The mice were fed with the soy-based PicoLab Rodent Diet 20 (LabDiet, St. Louis, MO) for 5 months, and the nutrients were described in Table 1. In addition, the soy-free diet was used to rule out the dietary isoflavone effect. A total of 8 adult NOD males and 10 adult NOD females were equally randomized into VH and GEN groups, and fed with a soy-free diet for 7 months, and they received the same dosing regime as above. The Verified Casein Diet 10 IF, the phytoestrogen-free 5K96 diet (TestDiet, St. Louis, MO; Table 1), is based on the NIH-31 formula, except that casein replaces the protein contributed by soy and alfalfa, and soy oil is replaced by corn oil, to preclude other phytoestrogens that might be present. The 5K96 diet was assayed for GEN and daidzein after hydrolysis of conjugates. The concentrations of both GEN and daidzein were found to be below the limit of detection (0.5 ppm) (16). The protein, carbohydrates, fat, and total calories are comparable between soy-based and soy-free diets.
Table 1. The major nutrients composition in the diets.
| Diet | Amount by weight | Calories (kcal/g) | |||
|---|---|---|---|---|---|
|
| |||||
| Protein (%) | Carbohydrates (%) | Fat (%) | Isoflavone (ppm) | ||
|
|
|||||
| PicoLab Rodent Diet 20 (soy-based) | 24.7 | 62.1 | 13.2 | 237-655 | 3.41 |
| 5K96 Verified Casein Diet | 22.1 | 66.6 | 11.3 | <10 | 3.44 |
Note: All numbers are obtained from the manufacturer's protocols. Websites http://www.labdiet.com/cs/groups/lolweb/@labdiet/documents/web_content/mdrf/mdi4/∼edisp/ducm04_028427.pdf http://www.labdiet.com/cs/groups/lolweb/@labdiet/documents/web_content/mdrf/mdi4/∼edisp/ducm04_028436.pdf
Body weight, organ weight, and blood glucose measurement
The BW and BGL were monitored every 1-2 wks. Non-fasting BGL was measured directly in small samples of venous blood (tail nick) using Accu-Chek Diabetes monitoring kit (Roche Diagnostics, Indianapolis, IN) (11). T1D was defined as a BGL higher or equal than 250 mg/dL (11). The mice were euthanized by carbon dioxide (CO2) inhalation after a BGL of 600 mg/dL was detected in 2 consecutive weeks or at the end of study. Individual organs were collected and weighed during necropsy.
Glucose Tolerance Test (GTT)
GTT, a measurement for the metabolic function of NOD mice, was performed as described (17). The test was conducted 5 months after initial GEN dosing. The mice were fasted for 15 h (18) followed by glucose injection (2 g/kg BW; i.p.). The fasting BW and BGLs, together with BGLs at 15, 30, 60, and 120 min after glucose injection, were measured.
Antibody and insulin measurement by enzyme-linked immunosorbent assay (ELISA)
At the end of each study (8 months for the soy-based diet and 7 months for the soy-free diet), the mice were euthanized by CO2 inhalation. After euthanasia, the terminal blood was collected by cardiac puncture, centrifuged for serum, and stored at -20 °C. The levels of serum IgG subclasses (including IgG1, IgG2a, IgG2b) and IgM were measured using ELISA kits (eBioscience, San Diego, CA). Briefly, capture antibodies (primary antibodies, 1:1000 v/v) were coated on 96-well microtiter plates, and incubated overnight at 4°C. Capture antibodies used in this study were purified goat anti-mouse IgG1, IgG2a, IgG2b and IgM, respectively. After washing with phosphate-buffered saline (PBS) containing 0.05% Tween-20 (PBST), the wells were blocked with 5% (w/v) milk power (prepared in PBS) at room temperature (RT) for 2 h. After washing with PBST, the diluted samples were added to the microplates and incubated for 2 h at RT. After washing with PBST, horseradish peroxidase (HRP)-conjugated detection antibodies (secondary antibodies) were added to each well and incubated for 1 h at RT. After washing with PBST, the substrate solution (citrate acid tablet and 2,2′-azino-bis, ABTS, Sigma, in PBS) was added into the microtiter plates and incubated for 45 min at RT. The optical density (OD) was read using a microplate fluorescence reader (Synergy 4 Hybrid Microplate Reader, BioTek, Winooski, VT) at a wavelength of 405 nm. Alternatively, the 3,3′,5,5′-tetramethylbenzidine (TMB) substrate (Sigma) was used, and the reaction was stopped by adding 2N sulfuric acid (100 μL/well). The OD was read at a wavelength of 450 nm. The serum insulin levels were measured with the Ultra Sensitive Mouse Insulin ELISA Kit (Crystal Chem, Inc., Downers Grove, IL) following manufacture protocol.
Cytokine/chemokine measurement
The cytokine/chemokine levels in the terminal sera were measured using Multiplex Mouse Cytokine/chemokine Magnetic Bead Panel Kit 96 Well Plate Assay (Cat. No. MCYTOMAG-70K, EMD Millipore, Billerica, MA). These cytokine/chemokines include granulocyte-colony stimulating factor (G-CSF), EOTAXIN, granulocyte macrophage colony-stimulating factor (GM-CSF), interferon (IFN)- γ, interleukin (IL)-1α, IL-1β, IL-2, IL-4, IL-3, IL-5, IL-6, IL-7, IL-9, IL-10, IL-12p40, IL-12p70, leukemia inhibitory factor (LIF), IL-13, LIX (C-X-C motif chemokine 5 or CXCL5), IL-15, IL-17, IFN-γ-induced protein 10 (IP-10), keratinocyte chemoattractant (KC), monocyte chemoattractant protein-1 (MCP-1), macrophage inflammatory protein (MIP)-1α, MIP-1β, macrophage colony-stimulating factor (M-CSF), MIP-2, MIG (C-X-C motif chemokine 9 or CXCL9), RANTES (C-C motif ligand 5 or CCL5), vascular endothelial growth factor (VEGF), tumor necrosis factor (TNF)-α. Plates were run on a Bio-Plex MAGPIX™ Multiplex Reader with Bio-Plex Manager™ MP Software (Luminex, Austin, TX). Each cytokine/chemokine concentration was calculated as pg/ml.
Histopathology
The pancreas from NOD males and females were collected, mounted on a cassette, and stored in 10% formalin for histological analysis. Hematoxylin and eosin (H&E) staining was performed and the slides were reviewed in a blinded manner by a board-certified veterinary pathologist for any pathological changes (Score 0 = no insulitis, Score 1 = peri-islet insulitis, Score 2 = intermediate insulitis, Score 3 = intra-islet insulitis, and Score 4 = complete islet insulitis).
DNA extraction for gut microbiome analysis
The feces were collected from individual mice 4 months after initial GEN dosing transferred to 500 μL Eppendorf tubes and kept in a -20 °C freezer. For each animal, a total of 4-5 fecal pellets (weighed from 80-120 mg) were used to ensure proper homogenization and DNA concentration. On the day of DNA extraction, the fecal samples were thawed on ice, and the DNA was extracted using QIAamp DNA stool mini kits (Qiagen, Valencia, CA) following manufacture protocols. Briefly, the fecal pellets were homogenized by vortex, and lysed with proteinase K to digest protein. The bacterial DNA was then bound to silica membrane, washed in ethanol to remove residual protein and salt, and eluted in Tris buffer. Typically, 15–60 μg DNA was yielded in each sample.
Library preparation and sequencing
On a polymerase chain reaction (PCR) plate, the extracted DNA was normalized to 20 ng/μL at Georgia Genomic Facility (GGF). The locus-specific primers (forward: 16S_341_F, and reverse: 16S_785_R) were used to target the V3-V4 region of 16S rRNA (Table 2). The Read 1 and Read 2 sequencing primers were Illumina-specific iTru_R1_5′_fusion and iTru_R2_5′_fusion In addition, a total of 20 internal tags ranging from 5 nucleotides (NTs) to 8 NTs long were used; 8 of them were the forward fusion primers and 12 the reverse fusion primers (Table 2) (19). Following the preparation of Taggi-matrix library, the PCR mix (Kapa Biosystems, Inc., Boston, MA) was added, together with forward fusion primers (including the Read 1 sequencing primer, Read 1 tag and forward locus-specific primer) and reverse fusion primers (including the Read 2 sequencing primer, Read 2 tag and reverse locus-specific primer). Different samples were distinguished by 20 tags (Table 2). The first round PCR was conducted with 25 cycles. The PCR amplicon was run on a 1.5% agarose gel to check the integrity of the PCR bands at 550 bp. Then, the PCR amplicon aliquot (10 μL per DNA sample) was purified with Speedbeads and quantified on Qubit, and the second round PCR was performed using Illumina iTru5 primer and iTru7 primer. The PCR products were purified with Speedbead, run on the 5% agarose gel, quantified, and sequenced on Illumina Miseq (Illumina Inc., San Diego, US) with 500 cycles, resulting in pair-end 250 bases to target 25,000 reads per sample.
Table 2. The primers and tags used in sequencing.
| Primers | |||
|---|---|---|---|
| 16S_341_F | CCTACGGGNGGCWGCAG | ||
| 16S_785_R | GACTACHVGGGTATCTAATCC | ||
| iTru_Rl_5′_fusion | ACACTCTTTCCCTACACGACGCTCTTCCGATCT | ||
| iTru_R2_5′_fusion | GTGACTGGAGTTCAGACGTGTGCTCTTCCGATCT | ||
| Tags | |||
| 1 | GGTAC | 11 | ccACGTC |
| 2 | cAACAC | 12 | ttcTCAGC |
| 3 | atCGGTT | 13 | CTAGG |
| 4 | tcgGTCAA | 14 | tGCTTA |
| 5 | AAGCG | 15 | gcGAAGT |
| 6 | gCCACA | 16 | aatCCTAT |
| 7 | ctGGATG | 17 | ATCTG |
| 8 | tgaTTGAC | 18 | gAGACT |
| 9 | AGGAA | 19 | cgATTCC |
| 10 | gAGTGG | 20 | tctCAATC |
Bioinformatic analysis
The bioinformatic analysis was performed as described (20). Briefly, the Read 1 and Read 2 sequence files from each sample were first merged, demultiplexed (a process that removes the internal tag and primers), and filtered with Phred Quality Score of 20, allowing for an error rate of 1 in 100. The subsequent analysis was performed on Quantitative Insights Into Microbial Ecology (QIIME) version 1.7.0, a pipeline that worked with high-throughput 16S rRNA sequencing data (21). The pick_de_novo_otus.py workflow was applied to pick Operational Taxonomic Units (OTU), align the representative sequence set, assign taxonomy, and build a phylogenetic tree and OTU table at the time (21). Subsequent core_diversity_analysis.py workflow was applied to determine α (within sample) and β (between samples) diversity after the OTU table was rarefied to a depth 80% of the minimum read per sample. The α diversity metrics used were phylogenetic diversity (PD) representing the genetic diversity and Shannon index representing both richness and evenness. The β diversity metrics used were unweighted and weighted Unifrac (a distance metric that takes account the abundance of each sample), and the principle coordinate analysis (PCoA) was conducted to visualize the phylogenetic distance between different samples with unweighted and weighted Unifrac. Further, the jackknifed β diversity analysis was performed to account for the uncertainty of the data at a depth 80% of the minimum read per sample, and it was repeated 999 times. The Linear Discriminant Analysis (LDA) Effect Size (LEfSe) analysis was performed to identify the taxa that were significant between groups on the website: http://huttenhower.sph.harvard.edu/galaxy, and the differential features identified at both the order and the genus levels. The LEfSe analysis was performed under the following conditions: (a) the α value for the factorial Kruskal–Wallis test and pairwise Wilcoxon test among classes was <0.05, and (b) the threshold on the logarithmic LDA score for discriminative features was >2.0. A critical value of 0.05 was applied throughout the bioinformatic analysis.
Statistical analysis
Dunnett's test was used to compare the means among treatment groups when the equal variance assumption was met; otherwise, and Wilcoxon test was performed to compare the means. Likelihood ratio test was used to compare the diabetes incidence, and Student's t-test was used to compare the abundance of taxa between treatment groups. JMP Pro 11 (SAS Inc., Cary, NC), R 3.3.1 (22), and GraphPad Prism 7 (GraphPad Software Inc., La Jolla, CA) were used for statistical analysis and data visualization. In addition, non-parametric t-test was used to test the statistical significance for α diversity, and Analysis of Similarities (ANOSIM) for β diversity.
In addition, the linear correlational analysis was performed within each pairs: BGL in males or days to develop hyperglycemia in females, and variables that were found to be significant between GEN and VH. The Pearson' correlation was performed to measure the strength of correlation, and the p-value, altogether with a 95% confidence interval, were provided.
Results
Blood glucose measurements and glucose tolerance test in males and females
We first determined the effect of GEN on BGL when the mice were maintained on soy-based diet. As depicted in Figure 1, GEN treatment in males produced a decrease in BGL with a significant change observed on day 98 following initial dosing (Fig. 1A). The protective effect of GEN was further supported by GTT results in which the fasting BGL and 120-min BGL in GEN-treated males were significantly lower than the control, showing an improved metabolic function (Fig. 1B). No males developed T1D during the study according to the criteria defined in the Method section. In females, a numerical (P > 0.05) decrease in BGL (Fig. 1D) and an improvement in the glucose tolerance (P > 0.05; data not shown) were observed; however, GEN exposure significantly delayed the onset of T1D (Fig. 1E) within three months of treatment. Taken together, the results showed that GEN decreased BGL in NOD males and delayed T1D onset in NOD females.
Figure 1.
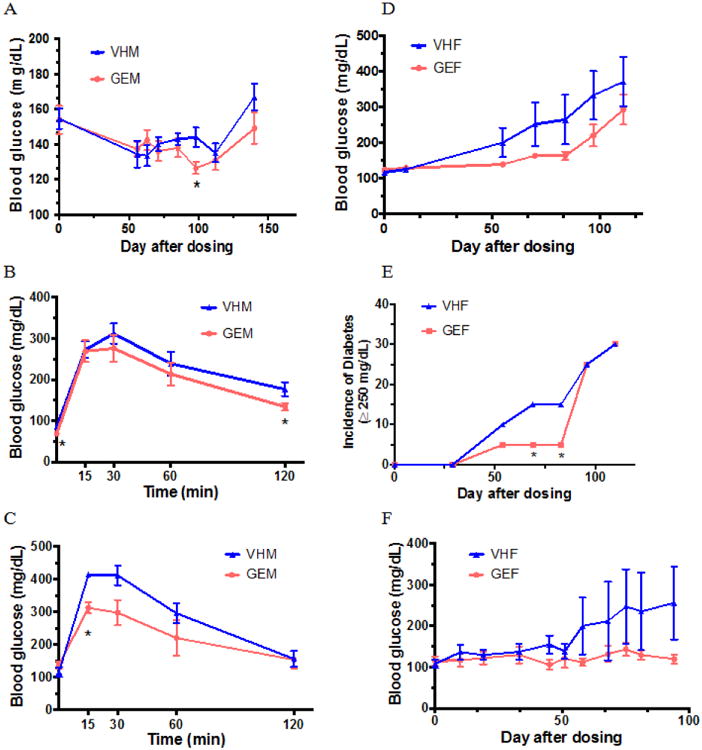
Time course studies for the blood glucose levels and glucose tolerance test (GTT) in NOD mice. (A) Blood glucose levels (BGLs ± SE) in NOD males (N = 10/group) on PicoLab diet; (B) GTT for NOD males at day 128 after initial dosing on PicoLab diet (N = 10/group); (C) GTT for NOD males on 5K96 diet prior to euthanasia (N = 4/group); (D) BGL (± SE) in NOD females on PicoLab diet (N = 10/group); (E) The incidence of T1D in NOD females on PicoLab diet (N=10/group). A BGL ≥ 250 mg/dL was considered T1D. (F) BGL (± SE) in NOD females on 5K96 diet (N = 5/group). *, p < 0.05. VHM = NOD males dosed with vehicle (VH); VHF = NOD females dosed with VH; GEM = NOD males dosed with genistein (GEN); and GEF = NOD females dosed with GEN.
For male NOD mice fed with soy-free diet, no difference in BGL was observed throughout the study (data not shown); however, the GTT showed a similar protective effect in GEN-exposed males as those fed with the soy-based diet (Fig. 1C). In our previous study, adult GEN exposure delayed the T1D onset in female NOD mice when fed the soy-free (8). In this study, a similar numerical decrease (P > 0.05) in BGL was observed in female mice on soy-free diet (Fig. 1F) as those fed with soy-based diet. Taken together, adult GEN exposure produced a protective effect in both male and female NOD adults independent of diet.
GEN alteration of gut microbiome in males and females
The gut microbial taxonomy was firstly characterized to determine if GEN exposure altered the compositional structure of gut microbiome. Fig. 2A shows the identified gut bacterial strains assigned at the phylum level from 16S rRNA sequencing in NOD males, with each color representing an individual bacterial phylum. Phylum Bacteroidetes represented 58.6% of the total bacteria in the VH group; while in GEN group, it represented 67.8% of the total taxa. Firmicutes/ Bacteroides (F/B) ratio was decreased following GEN treatment; however, it did not reach the level of statistical significance. Both the PD whole tree and chao1, indexes of α diversity that reflected the genetic diversity of the communities under study (23), were not significantly altered by GEN treatment (data not shown). In addition, GEN treatment did not show a clear pattern on the unweighted Unifrac, an index of β diversity (data not shown). However, when taking difference in abundance into account using weighted Unifrac (Fig. 2B), the gut bacteria communities in the VH and GEN groups were well separated, with 55.1% and 25.32% variation explained by principal component (PC) 1 and PC2, respectively. The weighted Unifrac result is supported by ANOSIM (P < 0.05 with 999 permutation), which suggested the difference in the gut microbiome induced by GEN exposure was readily observable and well differentiated. Moreover, when the microbial taxa at the genus level were compared, GEN treatment increased Prevotella, and decreased Alistipes and Blautia in terms of relative abundance (Fig. 2C), suggesting a protection against T1D (24-26).
Figure 2.
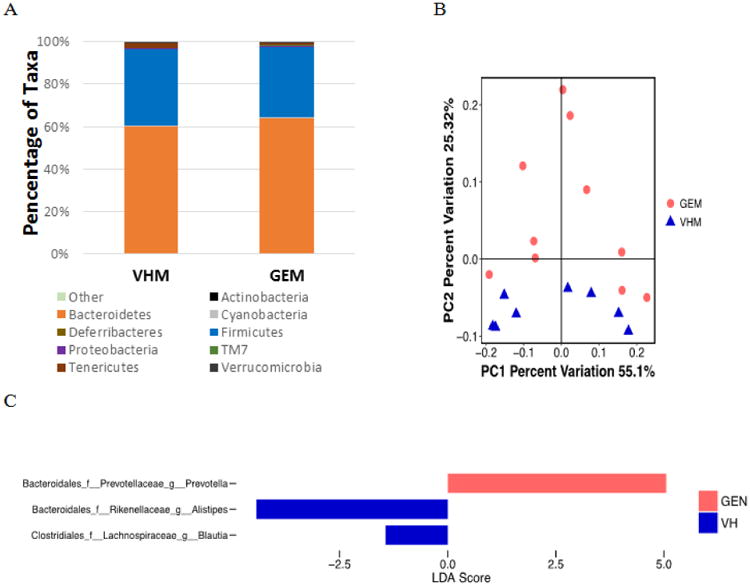
The composition of gut microbiome based on 16S rRNA sequencing in NOD males on PicoLab diet treated with genistein (GEM, N = 10) or vehicle (VHM, N = 8). (A) The taxonomy of the gut microbiome at the phylum level when the individual animal data were combined for analysis according to the treatment. (B) The β-diversity based on the weighted Unifrac index. Each of the symbols (closed circles and triangles) represents one animal and is illustrated by Principal Coordinate Component (PCoA), and the primary principal component (PC1) and secondary principal component (PC2) are shown. Eigenvalues of PCoA represented by the distance matrix can be interpreted in terms of percentage of total variability (x-axis and y-axis). The distance between two symbols suggests dissimilarity between the two samples. Weighted Unifrac takes into account the differences in abundance of taxa between samples. (C) Linear Discriminant Analysis Effective Size (LEfse) results at the genus level between VHM and GEM groups. LEfse is used to elucidate the differences in bacterial taxa.
Among NOD females, the abundance of taxa in individual animals at the phylum level was not significantly altered. Phylum Bacteroidetes represented 68.5% of the total bacteria in VH group, while it represented 79.0% of the total bacteria in GEN group. The taxonomy at the phylum level did not exhibit a significant change (Fig. 3A). Neither Unweighted Unifrac (data not shown) nor weighted Unifrac (Fig. 3B) showed a clear separation by treatment (P > 0.05). However, three taxa at the order level (Fig. 3C) and six at the genus level (Fig. 3D) were significantly increased following GEN treatment, suggesting a pro-inflammatory effect (25, 27-29). In addition, we have found that two diets used in this study had a differential effect (indicated by α-diversity, β-diversity, and taxonomy) on gut microbiome in VH females, which is in agreement with previous literatures (30).
Figure 3.
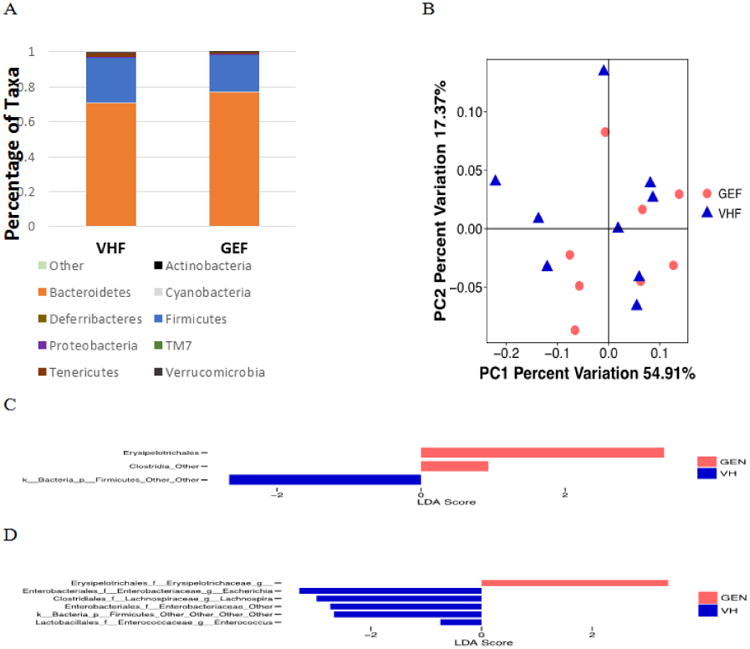
The composition of gut microbiome based on 16S rRNA sequencing in GEN-treated (GEF, N = 8) and VH-treated (VHF, N = 9) NOD females on the PicoLab diet. (A) The taxonomy of the gut microbiome at the phylum level when the individual animal data were combined for analysis according to the treatment. (B) The β-diversity based on the weighted Unifrac index. (C) LEfse results between VHF and GEF groups at the order level. (D) LEfse results between VHF and GEF groups at the genus level.
As the alteration in gut microbial species in NOD females maintained on soy-based diet suggested a pro-inflammatory instead of an anti-inflammatory effect of GEN, the gut microbiome in the females maintained on soy-free diet were also sequenced. The β diversity and taxonomical changes did not show any significant differences among groups of females on the soy-free diet (Fig. 4A-B); whereas one taxa at the order level (Fig. 4C) and two taxa at the genus level (Fig. 4D) showed differential abundances between VH and GEN groups, in agreement with the data from mice maintained on the soy-based diet.
Figure 4.
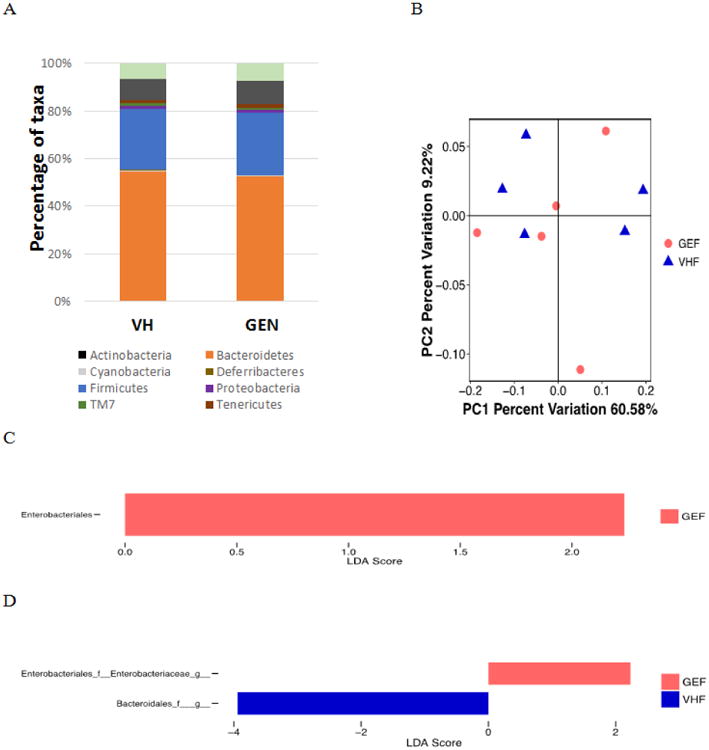
The composition of gut microbiome based on 16S ribosome RNA sequencing in NOD adult females fed with isoflavone and alfalfa-free 5K96 diet exposed to genistein (GEF, N = 5) or VH (VHF, N=5). (A) The taxonomy of the gut microbiome at the phylum level when the individual animal data were combined for analysis according to the treatment. (B) The β-diversity based on the weighted Unifrac index. (C) LEfse results at the order level between VHF and GEF groups. (D) LEfse results at the genus level between VHF and GEF groups.
Serum antibody levels in males and females maintained on soy-based diet
As a reflection of alterations in immune homeostasis, serum antibody levels were measured using ELISA (Fig. 5). GEN exposure significantly decreased the IgG2b production (Fig. 5B) among NOD males while the levels of IgG2a, IgM and IgG1 remained unchanged (Fig. 5A, C, D). Among females, an elevated IgG2a level (Fig. 5E) was observed following GEN exposure, while no differences were found for IgG2b, IgM, and IgG1 (Fig. 5F-H). Serum IgG2a levels in females was positively associated with days to develop hyperglycemia (BGL ≥ 250 mg/dL).
Figure 5.
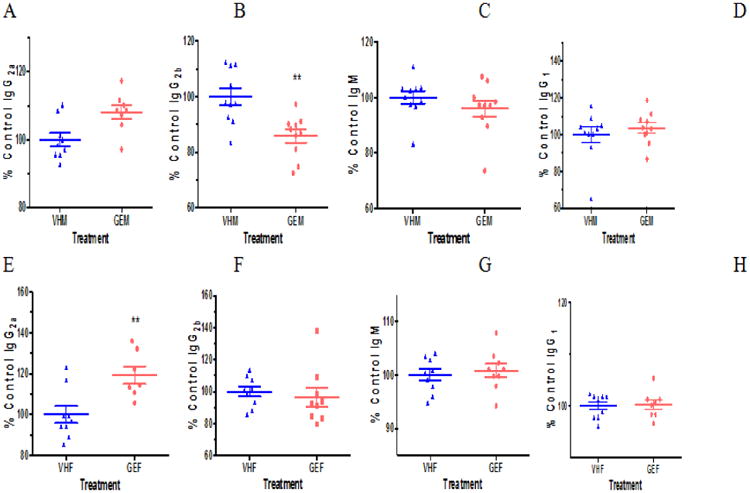
The serum antibody levels in NOD males (A-D) and females (E-H) on PicoLab diet. IgG2a (A), IgG2b (B), IgM (C), and IgG1 (D) levels in the sera of NOD males were measured at dilutions of 1:50, 1:50, 1:500, and 1:5000 (v/v), respectively, by ELISA. IgG2a (E), IgG2b (F), IgM (G), and IgG1 (H) levels in the sera of NOD females were determined at dilutions of 1:50, 1:50, 1:500, and 1:5000 (v/v), respectively. The sera were obtained when the mice were euthanized. *, p<0.05, and **, p<0.01. Each of the serum antibody concentration was calculated as the percent control. VHM = NOD males dosed with vehicle (VH, N = 10); VHF = NOD females dosed with VH (N = 8); GEM = NOD males dosed with GEN (N = 10); and GEF = NOD females dosed with GEN (N = 9).
Serum cytokine/chemokine levels in males and females maintained on soy-based diet
To further determine the systemic alterations in immunological response, we measured the levels of cytokines/chemokines in NOD males and females. Among the 32 cytokines/chemokines (Table 3), those that had significant changes following GEN treatment are as follows. GEN induced a decrease in GM-CSF (24.4%), IFN-γ (22.9%), IL-5 (63.7%), IL-10 (54.7%), and MCP-1 (72.2%) among males, suggesting an overall anti-inflammatory effect. However, an increased level in GM-CSF (2.2-fold), IL-1α (2.2-fold), LIX (2.2-fold), and MIP-2 (1.6-fold), G-CSF (1.8-fold), IL-1β (2-fold) and TNF-α (1.5-fold) was found among females following GEN treatment, suggesting a pro-inflammatory effect. Take together, the serum levels of cytokines/chemokines suggested that GEN had a differential effect on the immune system in NOD males and females.
Table 3. The cytokine/chemokine levels measured by Multiplex Mouse Cytokine/chemokine Magnetic Bead Panel Kit 96 Well Plate Assay in NOD male and female sera.
| G-CSF | EOTAXIN | GM-CSF | IFN-γ | IL-1α | IL-1β | IL-2 | IL-4 | |
|---|---|---|---|---|---|---|---|---|
|
|
||||||||
| VHF | 131.95±28.09 | 288.22±71.23 | 10.17±4.05 | 5.59±2.39 | 76.99±22.33 | 5.02±1.46 | 10.63±4.94 | n.d. |
| GEF | 242.24±26.27* | 437.94±66.63 | 22.08±3.79* | 11.58±2.24 | 168.89±24.32* | 10.18±1.37* | 19.68±4.62 | n.d. |
| VHM | 163.15±32.98 | 676.00±51.06 | 24.58±5.88 | 8.17±2.00 | 239.96±27.22 | 14.70±2.25 | n.d. | n.d. |
| GEM | 195.36±36.88 | 565.61±57.09 | 6.00±6.57* | 1.87±2.20* | 222.21±30.43 | 11.40±2.52 | n.d. | n.d. |
|
|
||||||||
| IL-3 | IL-5 | IL-6 | IL-7 | IL-9 | IL-10 | IL-12p40 | IL-12p70 | |
|
|
||||||||
| VHF | n.d. | 8.23±2.32 | 4.14±2.44 | 16.90±5.30 | 243.98±64.56 | 3.41±0.41 | n.d. | 3.72±0.82 |
| GEF | n.d. | 9.34±2.17 | 8.00±2.29 | 7.51±8.39 | 330.15±60.39 | 4.15±0.39 | n.d. | 4.27±0.76 |
| VHM | n.d. | 7.01±0.61 | 13.08±3.88 | n.d. | 356.53±59.57 | 6.07±1.13 | n.d. | 4.67±0.87 |
| GEM | n.d. | 4.46±0.68* | 3.17±4.33 | n.d. | 176.75±66.60 | 3.32±1.27** | n.d. | 2.92±0.98 |
|
|
||||||||
| LIF | IL-13 | LIX | IL-15 | IL-17 | IP-10 | KC | MCP-1 | |
|
|
||||||||
| VHF | n.d. | 10.75±3.07 | 914.39±330.69 | 352.19±98.54 | n.d. | 227.06±36.51 | 67.57±17.99 | 18.64±3.62 |
| GEF | n.d. | 19.36±2.87 | 2014.00±309.33* | 51.96±92.17 | n.d. | 239.84±34.15 | 101.03±16.83 | 24.80±3.39 |
| VHM | n.d. | 22.59±4.83 | 1722.36±223.59 | 66.90±61.97 | n.d. | 220.87±18.00 | 108.84±18.35 | 26.43±2.65 |
| GEM | n.d. | 12.09±0.81 | 1107.63±249.98 | 198.54±69.28 | n.d. | 189.77±20.13 | 80.87±20.51 | 19.08±2.97* |
|
|
||||||||
| MIP-1α | MIP-1β | M-CSF | MIP-2 | MIG | RANTES | VEGF | TNF-α | |
|
|
||||||||
| VHF | 97.75±35.84 | 22.62±6.23 | n.d. | 79.04±10.40 | 224.64±44.65 | 7.52±0.63 | 3.96±1.36 | 2.88±0.42 |
| GEF | 165.01±33.53 | 41.03±5.84 | n.d. | 125.41±9.73* | 147.07±41.76 | 8.06±0.59 | 6.34±1.22 | 4.37±0.40* |
| VHM | 131.70±22.89 | 36.03±6.29 | 5.65±0.85 | 129.76±5.05 | 263.06±30.66 | 11.41±1.28 | 4.79±0.61 | 5.09±0.38 |
| GEM | 64.72±25.59 | 20.21±7.04 | 7.29±0.95 | 116.15±5.65 | 265.15±34.28 | 10.10±1.43 | 3.74±0.69 | 4.09±0.42 |
Note: All values represent mean ± S.E. (pg/ml). IL = interleukin, IP-10 = interferon γ-induced protein 10, G-CSF = granulocyte-colony stimulating factor, GM-CSF = granulocyte macrophage colony-stimulating factor, LIX = C-X-C motif chemokine 5, KC = keratinocyte chemoattractant, MCP-1 = monocyte chemoattractant protein-1, MIP-1α = macrophage inflammatory protein 1-α, MIP-1 β = macrophage inflammatory protein 1- β, MIG = C-X-C motif chemokine 9, RANTES = C-C motif ligand 5, VEGF = vascular endothelial growth factor, TNF-α = tumor necrosis factor-α, LIF = leukemia inhibitory factor, M-CSF = macrophage colony-stimulating factor, n.d. = not detected, VHM = NOD males dosed with vehicle (VH, N = 10); VHF = NOD females dosed with VH (N = 8); GEM = NOD males dosed with genistein (GEN, N = 10); and GEF = NOD females dosed with GEN (N = 9).
P<0.05,
P<0.01.
Body weight and pancreatic histopathology
Body weight was not changed for both NOD males and females on soy-based diet throughout the study (data not shown). No difference was found for the terminal body and organ weights except for an increased liver weight at 9.2% (1079.2 g in VH vs. 1178.6 g in GEN) following GEN exposure among GEN females. In mice fed with soy-free diet, no significant changes in body weight and organ weights were found at euthanasia (data not shown). With regards to the pathological changes, 25% of males exposed to VH showed severe insulitis (with an insulitis score of 3+) whereas none of the males exposed to GEN showed severe insulitis (P > 0.05). The representative images of insulitis were presented in Figure 6. Among females, 20% of the mice in both VH and GEN group showed severely insulitis (data not shown). In addition, no difference in serum insulin level was observed (data not shown).
Figure 6.
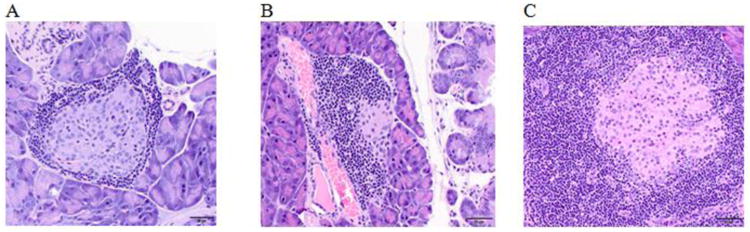
Representative images of insulitis in NOD mice. (A) Female mouse dosed with vehicle control with an insulitis score of 1+; (B) Male mouse dosed with genistein with an insulitis score of 2+; and (C) Male mouse dosed with vehicle control with an insulitis score of 3+
Correlational analysis
Figure 7 illustrates the relationships between pairs of the variables that were significant by Pearson's correlation. In NOD males, the increase in BGL is associated with increased levels of GM-CSF (Fig. 7A), IFN-γ (Fig. 7B), Alistipes (at the genus level, Fig. 7C), and a decreased Provetella (at the genus level, Fig. 7D). In females, no correlation was found between hyperglycemia development and antibody/cytokine/chemokine levels, whereas two OTUs at the genus level, Enterocccus (Fig. 7E) and Escherichia (Fig. 7F), were negatively associated with days to develop hyperglycemia (BGL ≥ 250 mg/dL) in females.
Figure 7.
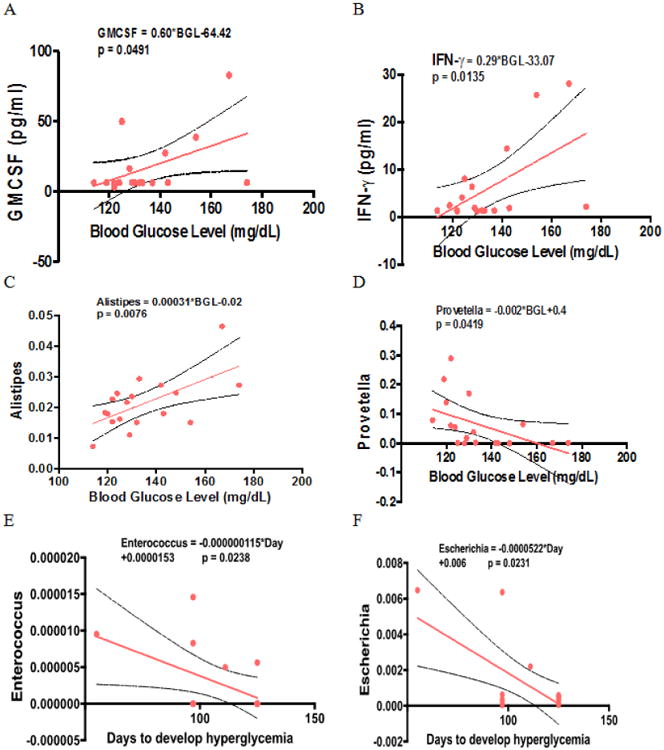
Correlational analysis. (A) Serum GM-CSF and blood glucose levels in males at Day 98 after initial dose, (B) Serum IFN-γ and blood glucose levels in males. (C) The relative abundance of Alistipes and blood glucose levels in males. (D) The relative abundance of Provetella and blood glucose levels in males. (E) The relative abundance of Enterocccus and days to develop hyperglycemia in females. (F) The relative abundance of Escherichia and and days to develop hyperglycemia in females. Hyperglycemia was defined as a blood glucose level higher or equal than 250 mg/dL. The dotted lines represent 95% confidence interval.
Discussion
The prevalence of T1D, previously referred to as “juvenile diabetes”, is alarmingly increasing in the US (1.25 million in American children and adults as in the year of 2012, American Diabetes Association) (31). In comparison, the low incidence of T1D in Asian countries coincides with the high consumption of soy-based diet, with the intake of soy food at a level of 36 g/d (32). Our previous studies showed that GEN treatment induced a decreased BGL in STZ - treated adult male B6C3F1 mice (11) and a delayed onset of T1D in female NOD mice (8). Gut microbiome has a “cross-talk” with mucosal immunity (33), and is closely associated with T1D risk (34-36). To our knowledge, our study is the first to evaluate the GEN effect on gut microbiome in vivo, and relates it to immunological changes and T1D occurrence.
In our previous studies with different diets, we have found that NOD mice maintained on the soy-free diet developed T1D faster (data not shown). In our male NOD mice, the development of T1D was slower (0% by 6 months of age) than the rate reported in literature (20 to 30%), which might be due to the protective effect of soy in the soy-based diet, with an isoflavone level range of 237-655 ppm (Table 1). In this study, it is assumed that the food intake of a 25 g mouse is 2 g; thus, the dietary intake of isoflavone is approximately 18.96-52.4 mg/kg BW. We used blood glucose measurement as the major readout in males. We were able to make a precise measurement of non-fasting BGL as we have kept the measuring time consistent (around noon on the day of measurement) as well as fasting BGL as we followed the 15-h fasting protocol (18). In addition to a decreased BGL, we observed an increased glucose tolerance among NOD males following GEN exposure, which is in agreement with our previous studies in STZ - treated male B6C3F1 mice (11) and has been confirmed by others (37).
T1D was found to closely associate with the diversity and abundance of taxa in gut microbiome in both human epidemiological studies (38) and animal studies (39-41). Although no alteration in β diversity was observed between sexes in our study (data not shown), a significantly different gut microbial taxonomy between male and female NOD mice was noted (data not shown), which suggested the sex effect on T1D might be due to gut microbiome (42). Patterson et al. (2015) investigated the gut microbiome changes in STZ-induced T1D in male Sprague-Dawley rats, and found a reduced α-diversity and F/B ratio while a change in β diversity (41). In our study with male NOD mice, we found that GEN exposure had a significant effect on β diversity when accounting for the abundance of taxa (e.g., weighted Unifrac), although the effect on F/B ratio was not significant. In addition, the increased Prevotella as well as decreased Alistipes and Blautia at the genus level following GEN exposure in NOD males were all in accordance with a reduced T1D risk and an anti-inflammatory status (24-26). Further evidence that adult GEN exposure induced anti-inflammation in NOD males included a reduced IgG2b level (43) and the cytokine/chemokine profiles with reduced GM-CSF, IFN-γ, IL-5, and MCP-1 levels. MCP-1 was found to be higher in T1D cases (44). As an immune modulatory cytokine, GM-CSF could exacerbate autoimmune diseases in inflammatory microenvironments (45). IFN-γ induces pancreatic β cell apoptosis through STAT1-mediated Bim protein activation and exacerbates T1D (46).
In spite of the protective effect of GEN on T1D among females, increased Erysipelotrichaceae (28), and decreased Escherichia (27), Lachnoslira (25), Firmicutes (other genus) and Enterococcus (29) at the genus level suggested a pro-inflammatory status in our GEN-treated NOD females. At the order level, increased Erysipetotrichalae (28) and Clostridia (other order), and decreased Firmicutes (other order) also indicated an exacerbating effect of T1D. The notion that GEN is pro-inflammatory in females is further supported by increased levels of cytokines/chemokines in GEN-treated NOD females when compared to the control, including GM-CSF, IL-1α, LIX, and MIP-2, G-CSF, IL-1β, and TNF-α (46, 48-50). It was suggested that sex has a strong effect on IL-1β, while gut microbiome has more effect on TNF-α (50). In fact, GEN also showed a pro-inflammatory response among female B6C3F1 mice in our previous studies (51, 52). Therefore, GEN exposure led to a protection on T1D among NOD females, which could not be explained by the pro-inflammatory status as represented by gut microbiome, antibody and cytokine/chemokine profiles.
The protective effect of GEN on T1D in NOD females could be due to direct inhibition of insulitis, increased insulin receptor expression (45) or up-regulation of hepatic glucose-6-phosphate dehydrogenase (G6PD) activities (9). However, these effects were observed in both females (9) and males (14). It has been reported that T1D is gender-specific, and phytoestrogens like GEN can exert estrogen-like effects (4, 53). There is evidence that estrogen receptor (ER) agonist (such as phytoestrogen) could reduce the risk of diabetes in animals (54). Thus, GEN might function as an ER agonist in female NOD mice in which the estrogen level is relatively low by preserving the pancreatic β cells (4, 9, 55) and regulating insulin-secreting pathways (56). In addition, it was possible that a decreased Enterobacteriaceae at the order level (57) and elevated IgG2a could have a protective effect on T1D (58) in GEN-treated NOD females, as IgG2a antibodies might non-specifically delay the onset of diabetes in female NOD mice (58).
With regards to glucose regulation, Weigt et al. (2015) showed that GEN improved glucose tolerance in female rats using a GEN dosage that was twice as ours. In our current study with NOD females, GEN exposure at 20 mg/kg produced a later onset of T1D but had no significant effects on glucose tolerance (37). This amount of GEN in a mouse is equivalent to a human clinical trial dose (approximately 100 mg/day) in terms of milligram/square meter of body surface that usually gives more accurate interspecies extrapolation (60). Interestingly, no glucose tolerance improvement was found among Chinese women who used a dose of 50 mg GEN daily for 6 months in an epidemiological study (1). It is possible that adult GEN exposure at physiologically relevant doses can decrease T1D incidence but not BGL in females; however, further epidemiological studies are needed to confirm this.
This study also has some limitations. First, the implicated causal relationship in the immunity-microbiome-T1D was not studied, and thus it is important to carry out approaches involving fecal transfer, immune reconstitution in severe combined immunodeficiency (SCID) mice, and antibiotic treatment to deplete microbiome or germ free mice in the future. Secondly, only one time points along the course of T1D development was shown in the study, which limited our ability to study the sequential events of immunological alteration and microbiome changes with the progression of T1D. In addition, with the use of soy-based diet, it was difficult to exclude the confounding effects of daidzein and glycitein, as their average concentration is 175.1 ppm and 37.8 ppm, respectively, compared to 191.9 ppm for GEN concentration. Therefore, a mixture study by combining GEN with daidzein and/or glycitein will help further elucidate the underlying mechanisms of action.
Overall, our studies suggested that the GEN exposure is associated with alterations in both gut microbiome and immune responses. An intricate interaction between microbiome and immunity, especially mucosal immunity, has been suggested in multiple studies through production of mucin, antimicrobial peptides, and cytokines (60). In our study, GEN-mediated gut microbiome alterations, together with immunological changes, were pro-inflammatory in NOD females and anti-inflammatory in NOD males. Further investigations should be carried out to determine the causal relationship among the estrogen-microbiome-immune consortium, and if GEN protection of T1D is through microbiome-mediated immunomodulation. This study will serve as a model to study exposure to natural products and prevention of autoimmune diseases.
Highlights.
GEN reduces blood glucose level and improves glucose tolerance in NOD males
GEN delayed type 1 diabetes onset in NOD females
GEN produces a perturbed gut microbiota in both NOD males and females
GEN produces anti-inflammatory responses in NOD males
GEN produces pro-inflammatory responses in NOD females
Acknowledgments
The authors would like to thank the funding agency for support (NIH R21ES24487).
Abbreviations
- T1D
type 1 diabetes
- GEN
genistein
- BW
body weight
- BGL
blood glucose level
- PND
postnatal day
- Ig
immunoglobulin
- GTT
glucose tolerance test
- NOD
non-obese diabetic
- STZ
streptozotocin
- UGA
University of Georgia
- IACUC
Institutional Animal Care and Use Committee
- i.p.
intraperitoneal
- PBS
phosphate-buffered saline
- PBST
phosphate-buffered saline with Tween-20
- ELISA
enzyme-linked immunosorbent assay
- VH
vehicle control
- ABTS
2,2′-azino-bis(3-ethylbenzothiazoline-6-sulphonic acid)
- RT
room temperature
- HRP
horseradish peroxidase
- TMB
3,3′,5,5′-Tetramethylbenzidine
- CO2
carbon dioxide
- OD
optical density
- G-CSF
granulocyte-colony stimulating factor
- GM-CSF
granulocyte macrophage colony-stimulating factor
- IL
interleukin
- IFN
interferon
- LIF
leukemia inhibitory factor
- KC
keratinocyte chemoattractant
- MCP
monocyte chemoattractant protein
- MIP
macrophage inflammatory protein
- M-CSF
macrophage colony-stimulating factor
- VEGF
vascular endothelial growth factor
- H&E
Hematoxylin and eosin
- PCR
polymerase chain reaction
- GGF
Georgia Genomic Facility
- rRNA
ribosomal RNA
- QIIME
Quantitative Insights Into Microbial Ecology
- OTU
Operational Taxonomic Units
- PD
phylogenetic diversity
- PCoA
principle coordinate analysis
- LDA
Linear Discriminant Analysis
- LEfSe
Linear Discriminant Analysis Effect Size
- ANOSIM
Analysis of Similarities
- PC
Principal Component
- ER
estrogen receptor
Footnotes
Conflict of interest: There are no conflicts of interest to declare.
Publisher's Disclaimer: This is a PDF file of an unedited manuscript that has been accepted for publication. As a service to our customers we are providing this early version of the manuscript. The manuscript will undergo copyediting, typesetting, and review of the resulting proof before it is published in its final citable form. Please note that during the production process errors may be discovered which could affect the content, and all legal disclaimers that apply to the journal pertain.
References
- 1.Ye YB, Chen AL, Lu W, Zhuo SY, Liu J, Guan JH, Deng WP, Fang S, Li YB, Chen YM. Daidzein and genistein fail to improve glycemic control and insulin sensitivity in Chinese women with impaired glucose regulation: A double-blind, randomized, placebo-controlled trial. Molecular Nutrition & Food Research. 2015;59(2):240–9. doi: 10.1002/mnfr.201400390. [DOI] [PubMed] [Google Scholar]
- 2.Badami E, Sorini C, Coccia M, Usuelli V, Molteni L, Bolla AM, Scavini M, Mariani A, King C, Bosi E, et al. Defective differentiation of regulatory FoxP3+ T cells by small-intestinal dendritic cells in patients with type 1 diabetes. Diabetes. 2011;60(8):2120–4. doi: 10.2337/db10-1201. [DOI] [PMC free article] [PubMed] [Google Scholar]
- 3.Li M, Song LJ, Qin XY. Advances in the cellular immunological pathogenesis of type 1 diabetes. J Cell Mol Med. 2014;18(5):749–58. doi: 10.1111/jcmm.12270. [DOI] [PMC free article] [PubMed] [Google Scholar]
- 4.Gilbert ER, Liu D. Anti-diabetic functions of soy isoflavone genistein: mechanisms underlying its effects on pancreatic beta-cell function. Food Funct. 2013;4(2):200–12. doi: 10.1039/c2fo30199g. [DOI] [PMC free article] [PubMed] [Google Scholar]
- 5.Ding M, Pan A, Manson J, Willett W, Malik V, Rosner B, Giovannucci E, Hu F, Sun Q. Consumption of soy foods and isoflavones and risk of type 2 diabetes: a pooled analysis of three US cohorts. European Journal of Clinical Nutrition. 2016;70(12):1381–7. doi: 10.1038/ejcn.2016.117. [DOI] [PMC free article] [PubMed] [Google Scholar]
- 6.Nanri A, Mizoue T, Takahashi Y, Kirii K, Inoue M, Noda M, Tsugane S. Soy product and isoflavone intakes are associated with a lower risk of type 2 diabetes in overweight Japanese women. J Nutr. 2010;140(3):580–6. doi: 10.3945/jn.109.116020. [DOI] [PubMed] [Google Scholar]
- 7.Strotmeyer ES, Yang Z, LaPorte RE, Chang YF, Steenkiste AR, Pietropaolo M, Nucci AM, Shen S, Wang L, Wang B, et al. Infant diet and type 1 diabetes in China. Diabetes Res Clin Pract. 2004;65(3):283–92. doi: 10.1016/j.diabres.2004.02.007. [DOI] [PubMed] [Google Scholar]
- 8.Guo TL, Germolec DR, Zheng JF, Kooistra L, Auttachoat W, Smith MJ, White KL, Elmore SA. Genistein Protects Female Nonobese Diabetic Mice from Developing Type 1 Diabetes When Fed a Soy- and Alfalfa-free Diet. Toxicologic Pathology. 2015;43(3):435–48. doi: 10.1177/0192623314526318. [DOI] [PMC free article] [PubMed] [Google Scholar]
- 9.Choi MS, Jung UJ, Yeo J, Kim MJ, Lee MK. Genistein and daidzein prevent diabetes onset by elevating insulin level and altering hepatic gluconeogenic and lipogenic enzyme activities in non-obese diabetic (NOD) mice. Diabetes-Metabolism Research and Reviews. 2008;24(1):74–81. doi: 10.1002/dmrr.780. [DOI] [PubMed] [Google Scholar]
- 10.Anderson MS, Bluestone JA. Annual Review of Immunology. Palo Alto: Annual Reviews; 2005. The NOD mouse: A model of immune dysre gulation; pp. 447–85. [DOI] [PubMed] [Google Scholar]
- 11.Guo TL, Wang YB, Xiong T, Ling X, Zheng JF. Genistein modulation of streptozotocin diabetes in male B6C3F1 mice can be induced by diet. Toxicology and Applied Pharmacology. 2014;280(3):455–66. doi: 10.1016/j.taap.2014.08.028. [DOI] [PMC free article] [PubMed] [Google Scholar]
- 12.Vighi G, Marcucci F, Sensi L, Di Cara G, Frati F. Allergy and the gastrointestinal system. Clin Exp Immunol. 2008;153(1):3–6. doi: 10.1111/j.1365-2249.2008.03713.x. [DOI] [PMC free article] [PubMed] [Google Scholar]
- 13.Yurkovetskiy L, Burrows M, Khan AA, Graham L, Volchkov P, Becker L, Antonopoulos D, Umesaki Y, Chervonsky AV. Gender Bias in Autoimmunity Is Influenced by Microbiota. Immunity. 2013;39(2):400–12. doi: 10.1016/j.immuni.2013.08.013. [DOI] [PMC free article] [PubMed] [Google Scholar]
- 14.Zimmermann C, Cederroth CR, Bourgoin L, Foti M, Nef S. Prevention of diabetes in db/db mice by dietary soy is independent of isoflavone levels. Endocrinology. 2012;153(11):5200–11. doi: 10.1210/en.2012-1490. [DOI] [PubMed] [Google Scholar]
- 15.Guo TL, Auttachoat W, Chi RP. Genistein enhancement of respiratory allergen trimellitic anhydride-induced IgE production by adult B6C3F1 mice following in utero and postnatal exposure. Toxicological Sciences. 2005 Oct 1;87(2):399–408. doi: 10.1093/toxsci/kfi268. [DOI] [PMC free article] [PubMed] [Google Scholar]
- 16.Guo T, White K, Brown R, Delclos K, Newbold R, Weis C, Germolec D, McCay J. Genistein modulates splenic natural killer cell activity, antibody-forming cell response, and phenotypic marker expression in F 0 and F 1 generations of Sprague-Dawley rats. Toxicology and applied pharmacology. 2002;181(3):219–27. doi: 10.1006/taap.2002.9418. [DOI] [PubMed] [Google Scholar]
- 17.Cui XB, Luan JN, Ye J, Chen SY. RGC32 deficiency protects against high-fat diet-induced obesity and insulin resistance in mice. Journal of Endocrinology. 2015;224(2):127–37. doi: 10.1530/JOE-14-0548. [DOI] [PMC free article] [PubMed] [Google Scholar]
- 18.Ayala JE, Samuel VT, Morton GJ, Obici S, Croniger CM, Shulman GI, Wasserman DH, McGuinness OP Consortium NIHMMPC. Standard operating procedures for describing and performing metabolic tests of glucose homeostasis in mice. Dis Model Mech. 2010;3(9-10):525–34. doi: 10.1242/dmm.006239. [DOI] [PMC free article] [PubMed] [Google Scholar]
- 19.Glenn TC, Nilsen R, Kieran TJ, Finger JW, Pierson TW, Bentley KE, Hoffberg S, Louha S, Garcia-De-Leon FJ, del Rio Portilla MA, Adapterama I. universal stubs and primers for thousands of dual-indexed Illumina libraries (iTru & iNext) BioRxiv. 2016:049114. doi: 10.7717/peerj.7755. [DOI] [PMC free article] [PubMed] [Google Scholar]
- 20.Lefever DE, Xu J, Chen Y, Huang G, Tamas N, Guo TL. TCDD modulation of gut microbiome correlated with liver and immune toxicity in streptozotocin (STZ)-induced hyperglycemic mice. Toxicol Appl Pharmacol. 2016;304:48–58. doi: 10.1016/j.taap.2016.05.016. [DOI] [PMC free article] [PubMed] [Google Scholar]
- 21.Caporaso JG, Kuczynski J, Stombaugh J, Bittinger K, Bushman FD, Costello EK, Fierer N, Pena AG, Goodrich JK, Gordon JI, et al. QIIME allows analysis of high-throughput community sequencing data. Nat Methods. 2010;7(5):335–6. doi: 10.1038/nmeth.f.303. [DOI] [PMC free article] [PubMed] [Google Scholar]
- 22.Core Team R. R: A language and environment for statistical computing. 2013 [Google Scholar]
- 23.Lozupone CA, Knight R. Species divergence and the measurement of microbial diversity. FEMS Microbiol Rev. 2008;32(4):557–78. doi: 10.1111/j.1574-6976.2008.00111.x. [DOI] [PMC free article] [PubMed] [Google Scholar]
- 24.Brown CT, Davis-Richardson AG, Giongo A, Gano KA, Crabb DB, Mukherjee N, Casella G, Drew JC, Ilonen J, Knip M, et al. Gut Microbiome Metagenomics Analysis Suggests a Functional Model for the Development of Autoimmunity for Type 1 Diabetes. Plos One. 2011;6(10):9. doi: 10.1371/journal.pone.0025792. [DOI] [PMC free article] [PubMed] [Google Scholar]
- 25.Qi CJ, Zhang Q, Yu M, Xu JP, Zheng J, Wang T, Xiao XH. Imbalance of Fecal Microbiota at Newly Diagnosed Type 1 Diabetes in Chinese Children. Chinese medical journal. 2016;129(11):1298. doi: 10.4103/0366-6999.182841. [DOI] [PMC free article] [PubMed] [Google Scholar]
- 26.Murri M, Leiva I, Gomez-Zumaquero JM, Tinahones FJ, Cardona F, Soriguer F, Queipo-Ortuno MI. Gut microbiota in children with type 1 diabetes differs from that in healthy children: a case-control study. Bmc Medicine. 2013;11:12. doi: 10.1186/1741-7015-11-46. [DOI] [PMC free article] [PubMed] [Google Scholar]
- 27.Furet JP, Kong LC, Tap J, Poitou C, Basdevant A, Bouillot JL, Mariat D, Corthier G, Doré J, Henegar C. Differential adaptation of human gut microbiota to bariatric surgery–induced weight loss links with metabolic and low-grade inflammation markers. Diabetes. 2010;59(12):3049–57. doi: 10.2337/db10-0253. [DOI] [PMC free article] [PubMed] [Google Scholar]
- 28.Schwab C, Berry D, Rauch I, Rennisch I, Ramesmayer J, Hainzl E, Heider S, Decker T, Kenner L, Muller M, et al. Longitudinal study of murine microbiota activity and interactions with the host during acute inflammation and recovery. ISME J. 2014;8(5):1101–14. doi: 10.1038/ismej.2013.223. [DOI] [PMC free article] [PubMed] [Google Scholar]
- 29.Yang C, Fei Y, Qin Y, Luo D, Yang S, Kou X, Zi Y, Deng T, Jin M. Bacterial Flora Changes in Conjunctiva of Rats with Streptozotocin-Induced Type I Diabetes. PLoS One. 2015;10(7):e0133021. doi: 10.1371/journal.pone.0133021. [DOI] [PMC free article] [PubMed] [Google Scholar]
- 30.Ravussin Y, Koren O, Spor A, LeDuc C, Gutman R, Stombaugh J, Knight R, Ley RE, Leibel RL. Responses of gut microbiota to diet composition and weight loss in lean and obese mice. Obesity (Silver Spring) 2012;20(4):738–47. doi: 10.1038/oby.2011.111. [DOI] [PMC free article] [PubMed] [Google Scholar]
- 31.American Diabetes Association [Internet] Arlington, VA: 1995-2016. [cited 2017 Jan 17]. Available from: http://www.diabetes.org/diabetes-basics/statistics/-sthash.PYQeTWTX.dpuf. [Google Scholar]
- 32.Hilakivi-Clarke L, Andrade JE, Helferich W. Is Soy Consumption Good or Bad for the Breast? Journal of Nutrition. 2010;140(12):2326s–34s. doi: 10.3945/jn.110.124230. [DOI] [PMC free article] [PubMed] [Google Scholar]
- 33.Purchiaroni F, Tortora A, Gabrielli M, Bertucci F, Gigante G, Ianiro G, Ojetti V, Scarpellini E, Gasbarrini A. The role of intestinal microbiota and the immune system. Eur Rev Med Pharmacol Sci. 2013;17(3):323–33. [PubMed] [Google Scholar]
- 34.Giongo A, Gano KA, Crabb DB, Mukherjee N, Novelo LL, Casella G, Drew JC, Ilonen J, Knip M, Hyoty H, et al. Toward defining the autoimmune microbiome for type 1 diabetes. Isme Journal. 2011;5(1):82–91. doi: 10.1038/ismej.2010.92. [DOI] [PMC free article] [PubMed] [Google Scholar]
- 35.de Goffau MC, Luopajarvi K, Knip M, Ilonen J, Ruohtula T, Harkonen T, Orivuori L, Hakala S, Welling GW, Harmsen HJ, et al. Fecal Microbiota Composition Differs Between Children With beta-Cell Autoimmunity and Those Without. Diabetes. 2013;62(4):1238–44. doi: 10.2337/db12-0526. [DOI] [PMC free article] [PubMed] [Google Scholar]
- 36.Dietert RR. The microbiome in early life : self-completion and microbiota protection as health priorities. Birth Defects Res B Dev Reprod Toxicol. 2014;101(4):333–40. doi: 10.1002/bdrb.21116. [DOI] [PubMed] [Google Scholar]
- 37.Weigt C, Hertrampf T, Flenker U, Hulsemann F, Kurnaz P, Fritzemeier KH, Diel P. Effects of estradiol, estrogen receptor subtype-selective agonists and genistein on glucose metabolism in leptin resistant female Zucker diabetic fatty (ZDF) rats. J Steroid Biochem Mol Biol. 2015;154:12–22. doi: 10.1016/j.jsbmb.2015.06.002. [DOI] [PubMed] [Google Scholar]
- 38.Mejía-León ME, Petrosino JF, Ajami NJ, Domínguez-Bello MG, de La Barca AMC. Fecal microbiota imbalance in Mexican children with type 1 diabetes. Scientific reports. 2014;4:3814. doi: 10.1038/srep03814. [DOI] [PMC free article] [PubMed] [Google Scholar]
- 39.Hansen CHF, Krych L, Nielsen DS, Vogensen FK, Hansen LH, Sorensen SJ, Buschard K, Hansen AK. Early life treatment with vancomycin propagates Akkermansia muciniphila and reduces diabetes incidence in the NOD mouse. Diabetologia. 2012;55(8):2285–94. doi: 10.1007/s00125-012-2564-7. [DOI] [PubMed] [Google Scholar]
- 40.Hu YJ, Peng J, Tai NW, Hu CY, Zhang XJ, Wong FS, Wen L. Maternal Antibiotic Treatment Protects Offspring from Diabetes Development in Nonobese Diabetic Mice by Generation of Tolerogenic APCs. Journal of Immunology. 2015;195(9):4176–84. doi: 10.4049/jimmunol.1500884. [DOI] [PMC free article] [PubMed] [Google Scholar]
- 41.Patterson E, Marques TM, O'Sullivan O, Fitzgerald P, Fitzgerald GF, Cotter PD, Dinan TG, Cryan JF, Stanton C, Ross RP. Streptozotocin- induced type-1-diabetes disease onset in Sprague-Dawley rats is associated with an altered intestinal microbiota composition and decreased diversity. Microbiology-Sgm. 2015;161:182–93. doi: 10.1099/mic.0.082610-0. [DOI] [PubMed] [Google Scholar]
- 42.Markle JG, Frank DN, Mortin-Toth S, Robertson CE, Feazel LM, Rolle-Kampczyk U, von Bergen M, McCoy KD, Macpherson AJ, Danska JS. Sex differences in the gut microbiome drive hormone-dependent regulation of autoimmunity. Science. 2013;339(6123):1084–8. doi: 10.1126/science.1233521. [DOI] [PubMed] [Google Scholar]
- 43.Ichikawa M, Koh CS, Inaba Y, Seki C, Inoue A, Itoh M, Ishihara Y, Bernard CCA, Komiyama A. IgG subclass switching is associated with the severity of experimental autoimmune encephalomyelitis induced with myelin oligodendrocyte glycoprotein peptide in NOD mice. Cell Immunol. 1999;191(2):97–104. doi: 10.1006/cimm.1998.1414. [DOI] [PubMed] [Google Scholar]
- 44.Ismail NA, Abd El Baky AN, Ragab S, Hamed M, Hashish MA, Shehata A. Monocyte chemoattractant protein 1 and macrophage migration inhibitory factor in children with type 1 diabetes. J Pediatr Endocr Met. 2016;29(6):641–5. doi: 10.1515/jpem-2015-0340. [DOI] [PubMed] [Google Scholar]
- 45.Bhattacharya P, Budnick I, Singh M, Thiruppathi M, Alharshawi K, Elshabrawy H, Holterman MJ, Prabhakar BS. Dual Role of GM-CSF as a Pro-Inflammatory and a Regulatory Cytokine: Implications for Immune Therapy. J Interf Cytok Res. 2015;35(8):585–99. doi: 10.1089/jir.2014.0149. [DOI] [PMC free article] [PubMed] [Google Scholar]
- 46.Barthson J, Germano CM, Moore F, Maida A, Drucker DJ, Marchetti P, Gysemans C, Mathieu C, Nuñez G, Jurisicova A. Cytokines tumor necrosis factor-α and interferon-γ induce pancreatic β-cell apoptosis through STAT1-mediated Bim protein activation. Journal of Biological Chemistry. 2011;286(45):39632–43. doi: 10.1074/jbc.M111.253591. [DOI] [PMC free article] [PubMed] [Google Scholar]
- 47.Matos M, Park R, Mathis D, Benoist C. Progression to islet destruction in a cyclophosphamide-induced transgenic model: a microarray overview. Diabetes. 2004;53(9):2310–21. doi: 10.2337/diabetes.53.9.2310. [DOI] [PubMed] [Google Scholar]
- 48.Navarro-Gonzalez JF, Mora-Fernandez C. The role of inflammatory cytokines in diabetic nephropathy. J Am Soc Nephrol. 2008;19:433–42. doi: 10.1681/ASN.2007091048. [DOI] [PubMed] [Google Scholar]
- 49.Lewis EC, Blaabjerg L, Storling J, Ronn SG, Mascagni P, Dinarello CA, Mandrup-Poulsen T. The oral histone deacetylase inhibitor ITF2357 reduces cytokines and protects islet beta cells in vivo and in vitro. Mol Med. 2011;17(5-6):369–77. doi: 10.2119/molmed.2010.00152. [DOI] [PMC free article] [PubMed] [Google Scholar]
- 50.Schirmer M, Smeekens SP, Vlamakis H, Jaeger M, Oosting M, Franzosa EA, Jansen T, Jacobs L, Bonder MJ, Kurilshikov A, et al. Linking the Human Gut Microbiome to Inflammatory Cytokine Production Capacity. Cell. 2016;167(4):1125–36 e8. doi: 10.1016/j.cell.2016.10.020. [DOI] [PMC free article] [PubMed] [Google Scholar]
- 51.Guo TL, McCay JA, Zhang LX, Brown RD, You L, Karrow NA, Germolec DR, White KL. Genistein modulates immune responses and increases host resistance to B16F10 tumor in adult female B6C3F1 mice. The Journal of nutrition. 2001;131(12):3251–8. doi: 10.1093/jn/131.12.3251. [DOI] [PubMed] [Google Scholar]
- 52.Guo TL, Chi RP, Hernandez DM, Auttachoat W, Zheng JF. Decreased 7, 12-dimethylbenz [a] anthracene-induced carcinogenesis coincides with the induction of antitumor immunities in adult female B6C3F1 mice pretreated with genistein. Carcinogenesis. 2007;28(12):2560–6. doi: 10.1093/carcin/bgm223. [DOI] [PMC free article] [PubMed] [Google Scholar]
- 53.Barrett JR. The science of soy: what do we really know? Environmental Health Perspectives. 2006;114(6):A352. doi: 10.1289/ehp.114-a352. [DOI] [PMC free article] [PubMed] [Google Scholar]
- 54.Liu S, Kilic G, Meyers MS, Navarro G, Wang Y, Oberholzer J, Mauvais-Jarvis F. Oestrogens improve human pancreatic islet transplantation in a mouse model of insulin deficient diabetes. Diabetologia. 2013;56(2):370–81. doi: 10.1007/s00125-012-2764-1. [DOI] [PMC free article] [PubMed] [Google Scholar]
- 55.Fu Z, Zhang W, Zhen W, Lum H, Nadler J, Bassaganya-Riera J, Jia Z, Wang Y, Misra H, Liu D. Genistein induces pancreatic β-cell proliferation through activation of multiple signaling pathways and prevents insulin-deficient diabetes in mice. Endocrinology. 2010;151(7):3026–37. doi: 10.1210/en.2009-1294. [DOI] [PMC free article] [PubMed] [Google Scholar]
- 56.Liu D, Zhen W, Yang Z, Carter JD, Si H, Reynolds KA. Genistein acutely stimulates insulin secretion in pancreatic β-cells through a cAMP-dependent protein kinase pathway. Diabetes. 2006;55(4):1043–50. doi: 10.2337/diabetes.55.04.06.db05-1089. [DOI] [PubMed] [Google Scholar]
- 57.Soyucen E, Gulcan A, Aktuglu-Zeybek AC, Onal H, Kiykim E, Aydin A. Differences in the gut microbiota of healthy children and those with type 1 diabetes. Pediatrics International. 2014;56(3):336–43. doi: 10.1111/ped.12243. [DOI] [PubMed] [Google Scholar]
- 58.Todd I, Davenport C, Topping JH, Wood PJ. IgG2a antibodies non-specifically delay the onset of diabetes in NOD mice. Autoimmunity. 1998;27:209–11. doi: 10.3109/08916939808993832. [DOI] [PubMed] [Google Scholar]
- 59.Hodgson E, Levi PE. A textbook of modern toxicology. Wiley Online Library; 2010. [Google Scholar]
- 60.Hooper LV, Macpherson AJ. Immune adaptations that maintain homeostasis with the intestinal microbiota. Nature Reviews Immunology. 2010;10(3):159–69. doi: 10.1038/nri2710. [DOI] [PubMed] [Google Scholar]