

Abstract
The lack of hepatitis C virus (HCV) diagnostic tests designed for use in decentralized settings is a major obstacle for providing access to treatment and prevention services particularly in low and middle income countries. Here we describe the development and validation of two building blocks of the HCV Quant Assay, a test in development for point-of-care use: 1) an RT-qPCR assay with noncompetitive internal control that equivalently detects the 6 major HCV genotypes and 2) an automated sample prep method using immiscible phase filter technology. This novel assay has wide dynamic range of HCV quantification and a limit of detection of 30 IU/ml with 200 μl specimen volume. In a preliminary study of 61 clinical specimens, the HCV Quant Assay demonstrated 100% sensitivity and specificity and gave comparable viral load results across 4 logs of IU/ml when compared to the Abbott RealTime HCV Assay.
Keywords: HCV, viral load monitoring, RT-qPCR, sample prep
1. Introduction
Globally, approximately 115 million people have serological evidence of current or past hepatitis C virus (HCV) with 80 million of those having active chronic infection as evidenced by detectable viral RNA [1]. HCV infection is frequently asymptomatic and therefore the majority of those infected are unaware of their illness. Untreated HCV infection causes chronic inflammation and scarring of the liver which in turn leads to chronic liver disease and potentially hepatocellular carcinoma. It is estimated that 703,800 die annually as a result of HCV infection [2].
Until recently, the treatment regime for HCV infection was complex, could take up to one year, had significant toxicity, and relatively poor efficacy [3]. HCV treatment is undergoing a dramatic transformation as new oral direct acting antivirals (DAA) are becoming available with high treatment success rates, treatment durations as short as 8 weeks and more manageable side effects [1, 4–6]. In 2014, the World Health Organization released its first set of global guidelines for HCV treatment including recommendations for the use of DAAs [4–6]. Experts have predicted that HCV infection can be eliminated by using screen and treat strategies combined with transmission prevention services [7, 8]. Recently, it was reported that after one year of unrestricted DAA availability in the Netherlands, the incidence of new HCV infection in a high risk of infection population, HIV positive men who have sex with men (MSM), decreased by 52% demonstrating that treatment as prevention may indeed avert new infections [9].
Generic forms of DAAs have been made available in some low and middle income countries (LMICs) reducing the cost per patient and leading dramatically to a need for the scale-up of treatment services. To bridge the gap from undiagnosed HCV infections to treatment and cure, affordable, point of care (POC) diagnostic tests are urgently required [10]. Currently, estimates show that less than 1% of the global population is aware of their status [1]. Serological tests are frequently used in POC settings, but their impact is limited because they cannot be used to detect newly acquired infections as antibodies may not be detected for 2–3 months nor can they be used to distinguish patients with active infections from those that have spontaneously cleared the infection [11].
Nucleic acid tests, however, can detect HCV in the acute phase of infection and can also be used in monitoring the effectiveness of antiviral therapy [12]. Until recently, HCV viral load monitoring has been confined to central laboratories, but recent reports describe potential for the use of dried blood spots to store and transport specimens without refrigeration to central laboratories for testing [13]. We propose to develop a platform for POC settings where patients present for diagnosis and treatment eliminating the need for sample transfer and the associated delay in delivering results to patients allowing for immediate treatment decisions thus reducing patient loss to follow-up [10].
Detection of HCV is performed by isolating viral RNA from a plasma sample and performing reverse transcription quantitative polymerase chain reaction (RT-qPCR). HCV, like many other RNA viruses, is genetically variable due to its error-prone RNA polymerase; strains are classified into 6 major genotypes which share 70 to 80% nucleotide identity with numerous subtypes [14]. In an infected individual, a population of closely related HCV variants with less than 10% variance at the nucleotide level can be detected [15]. If such polymorphisms occur in the primer and/or probe sequences the nucleotide binding affinity may be reduced resulting in decreased analytical sensitivity and accuracy. Therefore, the RT-qPCR assay conditions must be designed to tolerate the viral genetic diversity [16].
A second impediment to HCV testing at the POC is the complex and labor-intensive sample prep required for nucleic acid testing [17]. Genetic targets present in plasma or serum must be concentrated and separated from contaminants that may interfere with qPCR. The isolation of nucleic acids via a solid phase coated with silica was first introduced by Boom [18], and this method has evolved over the years into the use of silica coated paramagnetic particles (PMPs) incorporated into many commercial nucleic acid extraction systems [19]. In this method, clinical specimens are exposed to chaotrope and alcohol to drive nucleic acids onto the silica coating of PMPs. Many commercial nucleic acid extraction systems process samples in a single well by repeatedly pelleting PMPs, aspirating the liquid, and adding the next solution. Numerous wash steps are often required to remove cell debris and other amplification inhibitors that adhere to tube surfaces, become entrapped in the magnetically-aggregated PMPs, or remain in the residual volume after the supernatant is removed by aspiration [20].
Recently, our lab [20, 21] and others [22–27] have shown that instead of pipetting liquids in and out of a tube that contains the PMPs, there is an advantage to using stationary microfluidics whereby different buffers needed for extraction are located in fixed positions, and an external magnet transfers the PMPs between the fluids through an immiscible phase filter (IPF) made up of a layer of oil or liquid wax that is immiscible with both aqueous solutions. In addition to eliminating the need for fluid pumping or pipetting, moving PMPs instead of fluids simplifies the instrumentation and consumable test cartridge required for nucleic acid extraction. This concept of “stationary microfluidics” [26] allows for the development of an integrated system that automatically performs cell lysis and purification of nucleic acids and subsequent qPCR amplification in a closed cartridge.
In this report, we describe the development of our HCV Quant Assay that combines IPF HCV sample prep with an RT-qPCR assay that equivalently quantifies genotypes 1–6. HCV Quant Assay achieved a similar limit of detection and precision to commercial tests used in reference laboratories. The clinical performance of our HCV Quant Assay was verified by testing 61 clinical specimens yielding 100% sensitivity and 100% specificity, and good correlation (r2=0.91) was observed between our HCV Quant Assay and the Abbott RealTime HCV Assay. The development of a simple and cost effective POC HCV viral load test would allow HCV treatment and monitoring to be extended into remote areas where advanced laboratory infrastructure is not available.
2. Materials and Methods
2.1 Viral strains and sample sources
HCV- and HIV-negative plasma was obtained from ProMedDx (Norton, MA). HCV nucleic acid-positive, antibody-negative samples with known viral load and genotype were requested from the American Red Cross (Gaithersburg, MD). Genotype 1b sample (024GJ66260) was used as a reference for some of the following studies. The HCV Worldwide AccuSet™ Performance Panel was purchased from SeraCare Life Sciences (Milford, MA). Forty plasma samples were obtained from the A5294/BIRTH trial [A Prospective, Phase III, Open-Label Study of Boceprevir, Pegylated-Interferon Alfa 2b, and Ribavirin in HCV/HIV Coinfected Subjects of the AIDS Clinical Trials Group (ACTG)]. We requested 10 samples with viral loads (VL) between 100 and 1000; 10 with VL between 1000 and 10,000; 10 with VL between 10,000 and 100,000 and 10 with VL between 100,000 and 1,000,000. Twenty-one negative controls (blood plasma from HCV negative individuals) were acquired from Evanston Hospital.
2.2 Cloning of amplicon sequences and RNA transcript preparation
HCV genotype variation was analyzed by aligning 80 genome-representative sequences from the Los Alamos Hepatitis C Database [28] The HCV Sequence Alignments Genotype Reference tool (https://hcv.lanl.gov/content/sequence/NEWALIGN/align.html) was used to create an alignment of the highly conserved 5′UTR genomic region of approximately 4 representative DNA sequences from each genomic clade. From the alignment, 4 sequences were selected: Genbank sequence NC_004102.1 representing genotypes (GTs) 1, 5, and 6; D10077.1 representing GT 2; D28917.1 representing GT 3; and DQ295833.1 representing GT 4. The first 400 nucleotides of reference genotype NC_004102.1 were cloned into pIDTBlue plasmid (IDT; Corvallis, IA), with genotype-specific modifications in the target amplicon region only, nucleotides 60–180. An additional sequence representing GT 6, D37841.1, was later cloned following the same procedure in order to test a polymorphism in the qPCR probe-binding region.
RNA transcripts were synthesized from the pIDTBlue plasmids using the MEGAshortscript kit (Applied Biosystems; Foster City, CA). Briefly, linearized plasmid DNA containing sequences described above were mixed with 10× reaction buffer, enzyme mix, and NTPs following the kit instructions and incubated at 37 °C for 3 hours. Then, 1 μl of TURBO DNase from the kit was added to each reaction and incubated at 37 °C for 20 min to degrade parental DNA. The ~470 nucleotide transcripts were isolated via gel extraction. Samples (diluted 1:2 in 2× TBE-Urea Sample Buffer) were run in a 10% Novex TBE-Urea Gel (Thermo Fisher Scientific; Waltham, MA) for 2 hours at 180 V. After staining the gel with SYBR Green II Gel Stain (Thermo Fisher Scientific) for 30 min with gentle agitation, the gel was visualized with UV light and bands of the expected size were excised and placed in RNA gel elution buffer (20 mM Tris-HCL pH 7.5, 0.25 M sodium acetate, 1 mM EDTA pH 8, 0.25% SDS) [29]. The tubes were frozen in dry ice for 15 min and then left at room temperature overnight to allow for the RNA to diffuse from the gel slice. The following day, tubes were centrifuged for 10 min at maximum speed in a tabletop centrifuge, and the supernatant was placed in a clean microcentrifuge tube. RNA was extracted with 1 volume of 1:10 phenol:chloroform and precipitated with 2 volumes 100% ethanol. Finally, RNA was resuspended in 10 mM Tris pH 7.5 and quantified using NanoDrop 1000 Spectrophotometer (Thermo Fisher Scientific). Isolation of a single product was confirmed by gel electrophoresis.
2.3 RT-qPCR primer and probe selection and PCR conditions
Primers were selected in the region of the 5′UTR with the least sequence variation in order to minimize differences in quantification of the different genotypes. In lieu of primer sequences, the clarified MIQE guidelines [30] allow publication of the reference sequence, anchor nucleotide (defined as a nucleotide located in the probe sequence), and amplicon length for each assay. For the HCV Quant Assay, this PCR amplicon context is: NC_004102.1, 145, 115.
2.4 Exogenous internal control
The noncompetitive internal control (IC) assay targeting the bacteriophage MS2 (Zeptometrix, Buffalo, NY or Franklin, MA) was adapted from Beck, et al. [31]. Standard curves of plasma containing HCV were run with and without the primers, probe and MS2 bacteriophage to demonstrate the suitability of the IC. Samples that tested negative for the HCV assay and had a failed IC were considered invalid. Samples that tested positive for HCV with a failed IC were considered positive.
2.5 Reverse Transcription Quantitative PCR
PCR master mix for a 25 μl total reaction volume consisted of: 62.5 μg/ml bovine serum albumin (BSA; Life Technologies Corporation; Grand Island, NY), 0.032% Tween-20 (ThermoFisher Scientific, Worcester MA), 138 mM trehalose (Sigma; St. Louis, MO), 10% glycerol (Affymetrix; Santa Clara, CA), 62.5 mM bicine pH 8 (Affymetrix), 135 mM potassium acetate pH 7.5 (Affymetrix), 2.5 mM manganese chloride (Sigma), 0.325 mM each dNTP (Life Technologies Corporation), 25 mM Tris pH 8.0 (Invitrogen, Carlsbad CA), 5.6 U RMS Z05 DNA polymerase (Roche Molecular Systems, Inc., Branchburg, NJ), and sequence-specific oligonucleotides (IDT, Corvallis, IA).
Freeze-dried qPCR master mix was used in the limit of detection study, the intra-and inter-assay variability study, and the laboratory validation study using samples from the ACTG. BSA, Tween-20, trehalose, dNTPs, Z05 polymerase, and oligonucleotides were lyophilized together. Resuspension buffer consisted of bicine, Tris pH 8.0, potassium acetate, glycerol, and manganese chloride, and final concentrations of all components of freeze-dried qPCR master mix were the same as described above for freshly prepared master mixes.
Amplification was performed in a 5-plex Qiagen (Hilden, Germany) Rotor-Gene Q thermocycler, with the following cycling conditions: 1.70 °C 2:00; 2. 62 °C 20:00; 3. 95 °C 0:30; 4. 95 °C 0:15; 5: 60 °C 0:45; 6: repeat steps 4 and 5 49 times. The program was set to acquire in green and red channels, and the Qiagen Rotor-Gene Q Series Software package was used for analysis.
2.6 Extraction cartridge design and manufacturing
To support assay development, an automated lab-scale extraction system that utilizes immiscible phase filter (IPF) and a disposable cartridge was developed (Figures 1a and 1b). Six of the systems were produced to support development of the HCV viral load assay and others. The system contains 3 major elements: a sonicator for mixing, a magnetic station to manipulate PMPs and a heating station (Figure 1a). The cartridge moves between workstations on a computer controlled stage. Using the automated extraction system, the required specimen volume, the PMP size and nucleic acid binding chemistry for RNA isolation and purification for HCV were optimized. These instruments perform all nucleic acid extraction and purification steps in open cartridges filled by pipets. The cartridge contains 4 chambers used for extraction processing: lysis chamber, 2 wash chambers and an elution chamber (Figure 1b). Liquid wax overlays the volumes of chambers 2, 3 and 4 creating an immiscible phase filter between these extraction steps [20]. Researchers program all steps using netbook computers that allow control over all operations. As process modules are improved and verified, they are retrofitted onto all existing systems [32].
Figure 1.
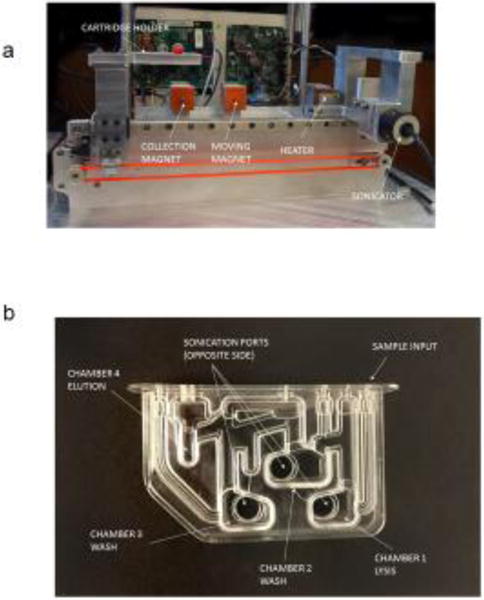
Immiscible phase extraction prototype and cartridge (a) Sample preparation device with 3 axis movement, sonication mixing, paramagnetic bead collection and movement magnets and closed loop heater; (b) Four chamber sample preparation cartridge with injection molded polycarbonate body and heat welded polycarbonate film.
2.7 RNA extraction and amplification using KingFisher Duo Magnetic Particle Processor
In order to validate the performance of the HCV Quant Assay across HCV genotypes, the HCV Worldwide AccuSet Performance Panel consisting of 20 HCV-positive plasma specimens was obtained from SeraCare (Milford, MA, cat. number 0810-0173). Genotypes 1, 2, 3, 4, 5, and 6 with varying subtypes are represented in the panel. Viral RNA was extracted using Dynabeads Silane Viral NA kit (Invitrogen, Carlsbad CA) and the KingFisher Duo Magnetic Particle Processor (ThermoFisher Scientific, Worcester MA). Lysis followed Dynabeads protocol except that the volume of Lysis/Binding Buffer concentrate and isopropanol was increased from 450 μl to 700 μl, the volume of paramagnetic particles (PMPs) was reduced to 7.5 μl, and all lysis components were added to a KingFisher deep-well plate, heated to 45 °C and mixed for 5 minutes in the KingFisher. Two washes utilizing Wash Buffer 1 and two washes utilizing Wash Buffer 2 were performed as per manufacturer’s instructions. The drying step was extended to 25 minutes. RNA was eluted in 25 μl 10 mM Tris pH=7.5, 10% glycerol and 0.01% Tween 20 by heating to 70 C for 5 minutes with mixing in the KingFisher.
To quantify the viral load in each sample, RNA was extracted from the 5th World Health Organization (WHO) International Standard (IS) for HCV NAT [code 14–150 from the National Institute for Biological Standards and Control (NIBSC); England] [33]. The IS was resuspended to 10,000 IU/ml as recommended, and two tenfold serial dilutions were made. RNA was extracted using the KingFisher protocol described above, and a standard curve generated from the data was used to quantify a higher-titer sample obtained from the American Red Cross (GT 1b, whole blood number 024GJ66260). This sample was determined to contain 1.17E7 IU/ml, and a 5-point standard curve generated from tenfold serial dilutions of this sample was used to calculate viral loads of the SeraCare panel (equation: y = − 3.414x+36.531).
2.8 RNA extraction in IPF extraction prototype
The Dynabeads Silane Viral NA kit protocol was adapted for use with IPF automated extraction. The specimen, 1.5 mg proteinase K, and Lysis Buffer were mixed in a 1.5 ml microcentrifuge tube. 7.5 μl MyOne SILANE PMPs were pipetted into the sample input port of the cartridge (Figure 1). The specimen in Lysis/Binding Buffer was added immediately afterwards to rinse all PMPs into lysis chamber. 1500 μl of Wash Buffer 1 was added to W1 chamber, and 25 μl of elution buffer was added to elution chamber. 1000 μl Wash Buffer 2 was then pipetted into W2 chamber, and approximately 1000 μl of liquid wax was added to cover all chambers. Extraction was performed in the cartridge following the Dynal protocol with the following modifications: sonication was used for mixing, the PMPs were dragged using an external magnet from one chamber to another through a layer of liquid wax and only 2 washes (one Wash 1 and one Wash 2) were used.
2.9 Limit of detection and intra-and inter-assay reproducibility
Samples for the LOD and variability studies were contrived by spiking GT 1b HCV virus (American Red Cross sample 024GJ66260) into HCV negative citrate plasma and extracted following the IPF protocol. The positive control was 1,000 IU/ml spiked into HCV negative citrate plasma, and the negative control was HCV negative plasma alone (both including the exogenous internal control). Samples for the reproducibility study were contrived by spiking 6 replicates of 1,000 and 1,000,000 IU/ml into HCV negative plasma on 3 experimental days. The same protocol for extraction and amplification was used as in the LOD determination, and standard deviation (in log IU/ml) and coefficient of variation (CV) were calculated.
2.10 Laboratory validation study
The specimens were acquired from ACTG, and each specimen was provided with a Roche COBAS Ampliprep/COBAS Taqman HCV Test v2.0 viral load value. A 200 μl specimen was tested with the HCV Quant Assay, and RNA was quantified by standard curve using the GT1b (American Red Cross 024GJ66260) sample as a reference, in 1E6 to 1E2 IU/ml dilutions (equation: y = −3.5805x + 40.154). Samples were also quantified by the Abbott RealTime HCV Assay (Abbott Molecular Inc., Des Plaines, IL) on the m2000 following manufacturer’s recommendations. Two hundred μl of each specimen was diluted 1:4 to bring the volume up to the required 800 μl for the m2000sp. The instrument volume input was 500 μl with 300 μl as dead volume resulting in 125 μl of specimen used in the test.
2.11 Statistical methods
Cq values were plotted against log (copy number) using Qiagen’s RGQ software to obtain standard curves. Slope parameters were estimated by linear regression of Cq values vs log copy number; the 95% Confidence Intervals of slope estimates were calculated in (XL Stat 2016; Addinsoft, New York, New York). Test sensitivity, confidence intervals and two-tailed student t tests were calculated using Vassar Stats online statistical package (www.vassarstats.net/index.html). PCR efficiency was calculated from the slope of the standard curve, Eff% = −1+10(−1/slope). Limit of detection was determined using probit analysis (XL Stat). Pearson correlation tests were used to generate R2 values to evaluate correlations between the HCV Quant and Abbot RealTime HCV Assay. Differences between the two tests were also examined graphically according to Bland & Altman [34]. Plots were generated with the difference in log copy number between the Abbott RealTime HCV Assay and the HCV Quant Assay on the y axis and the mean log copy number on the x axis. The log copy number of viral IU was calculated from the quantification cycle (Cq) using the equation of the standard curve. The mean difference and the standard deviation of the differences were calculated, and lines were drawn corresponding to the mean and the mean ± 2 standard deviations. Each plot was examined for evidence of non-uniform variance and outliers before performing a t-test with the null hypothesis of a mean difference equal to zero (www.vassarstats.net/index.html). A p-value less than 0.05 was considered statistically significant.
3. Results
3.1 HCV Quant Assay equivalently detects HCV genotypes
The RT-qPCR assay was demonstrated to be linear across 6 logs of concentration from 500,000 to 5 copies of transcript of GT1a (Figure 2a). Five transcripts representing genotypes 1–6 were tested at 5000 copies (3.70 log) and the quantification was compared (Figure 2b). The mean log copy number detected was subtracted from 3.70 copies. The log copy number difference ranged from −0.10 to 0.27 indicating equivalent quantification across the 6 genotypes represented in this study.
Figure 2.
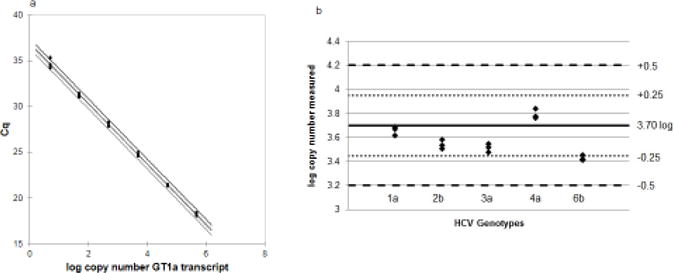
(a) Standard curve of Genotype 1a RNA transcript standard curve. N=6. Equation of line y=−3.29x+36.86 [95% CI: −3.34, −3.24; p<0.0001] R2=0.99. qPCR efficiency = 101%. (b) Quantification of 5000 copy input (3.70 log IU/ml) of 5 different transcripts representing different genotypes. N=3. Average IU quantification: GT1a=3.66 IU/ml; GT2b=3.54 IU/ml; GT3a=3.51 IU/ml; GT4a=3.79 IU/ml; and GT6b=3.40 IU/ml. Horizontal black line is input of 3.70 log IU/ml (5000 copies); small dotted lines show ±0.25 log from 3.70 log and larger dotted lines show ±0.5 log from 3.70 log.
3.2 Testing RT-qPCR assay with genotype panel
The broad spectrum reactivity of the novel HCV RT-qPCR assay was assessed by extracting and amplifying a 20 member panel of HCV genotypes 1–6 acquired from SeraCare. Viral RNA was extracted using the Dynabeads Silane Viral NA kit and the KingFisher Duo Magnetic Particle Processor. A standard curve generated from a high-titer secondary standard, itself quantified by the WHO International Standard, was used to quantify the yield of each panel member, and these results were compared to the data provided with the panel from Roche COBAS®TaqMan®HCV Test v. 2.0, Siemens Versant HCV RNA 3.0 Assay (bDNA), and Abbott RealTime HCV m 2000 Assay (Table 1). Because the clinical specimens acquired from ACTG discussed below have Roche COBAS®TaqMan®HCV Test v. 2.0 test results associated with them, the Roche test results were treated as the gold standard.
Table 1.
SeraCare panel results of viral RNA extracted using the Dynabeads Silane Viral NA kit and the KingFisher Duo Magnetic Particle Processor. Differences from Roche test >0.5 log are highlighted in dark shaded area. Data in light shaded columns were provided by SeraCare Datasheet Rev. 3.
| Roche COBAS Ampliprep/COBAS Taqman HCV Test v2.0 | Siemens Versant HCV RNA 3.0 Assay (bDNA) | Abbott Realtime HCV m2000 Assay | HCV Quant Assay | ||
|---|---|---|---|---|---|
| Panel member | genotype | Log IU/mL | Log IU/mL | Log IU/mL | Log IU/mL |
| 1 | 1b | 5.5 | 5.5 | 5.5 | 5.7 |
| 2 | 1b | 5.2 | 5.0 | 5.2 | 5.4 |
| 3 | 1a | 6.3 | 6.1 | 6.4 | 6.4 |
| 4 | 1a | 5.0 | 5.0 | 5.1 | 5.3 |
| 5 | 2a | 5.2 | 4.9 | 5.1 | 4.8 |
| 6 | 2a | 6.6 | 6.2 | 6.5 | 6.2 |
| 7 | 2b | 4.1 | 4.0 | 4.1 | 4.2 |
| 8 | 3a | 6.7 | 6.2 | 6.5 | 6.3 |
| 9 | 3b | 4.7 | 4.2 | 4.5 | 4.3 |
| 10 | 3a | 6.8 | 6.2 | 6.5 | 6.3 |
| 11 | 4acd | 4.1 | 4.1 | 4.2 | 4.0 |
| 12 | 4acd | 3.9 | 3.9 | 3.9 | 3.7 |
| 13 | 4acd | 5.5 | 5.1 | 5.4 | 5.0 |
| 14 | 4acd | 6.5 | 6.2 | 6.5 | 5.8 |
| 15 | 5a | 5.6 | 5.4 | 5.4 | 5.4 |
| 16 | 5a | 3.9 | 3.7 | 3.6 | 3.3 |
| 17 | 5a | 4.5 | 4.4 | 4.2 | 3.9 |
| 18 | 6 | 6.7 | 6.5 | 6.6 | 6.8 |
| 19 | 6 | 5.3 | 5.0 | 4.9 | 5.2 |
| 20 | 6 | 5.5 | 5.0 | 5.1 | 4.9 |
| Average difference from Roche COBAS | 0.2±0.2 | 0.1±0.1 | 0.2±0.3 | ||
Sixteen of the 20 panel members tested by the HCV Quant assay had log IU/ml yields that were less than 0.5 log different from the Roche COBAS test (Table 1). Four panel members had log IU/ml yields that were more than 0.5 log but less than 1.0 log different from the Roche COBAS test: panel number 14 (GT 4acd) was 0.64 log different, panel numbers 16 and 17 (GT 5a) were 0.59 and 0.54 log IU/ml different respectively, and panel number 20 (GT 6) was 0.6 log IU/ml different. We averaged the difference of the 20 panel members from Roche COBAS test and HCV Quant, Abbott and Siemens tests. For Abbott the average difference was 0.1 log IU/ml, for Siemens the average difference was 0.2 log IU/ml, and for the Quant HCV Assay the average difference was 0.2 log IU/ml. This study demonstrated that the Quant HCV Assay using RNA extraction with the KingFisher Duo Magnetic Particle Processor has a broad spectrum reactivity to HCV viral specimens of genotypes 1–6 and is comparable to commercially available tests.
3.3 Performance Verification of Immiscible Phase Nucleic Acid Extraction
Next, the Dynabeads Silane Viral NA kit was adapted for use with IPF NA extraction prototype and its performance was compared to the KingFisher Duo Magnetic Particle Processor. Equivalent performance was observed when testing a serial dilution series of 5 concentrations of GT 1b HCV virus (ARC sample 024GJ66260) from 32 IU/ml to 325,000 IU/ml extracted on either the IPF NA extraction prototype or the KingFisher (Figures 3a and 3b). PCR efficiencies were calculated from the slope of the standard curves (Figure 3b) to be 96% and 100%, respectively indicating that the RNA isolated was free from PCR inhibitors. Eight negative specimens (citrate plasma alone) were also tested and no amplification was observed. The Bland-Altman plot compares the performance of the IPF and KingFisher methods (Figure 3c). A paired t-test (mean = 0.011, SD = 0.29, DF = 29) showed the mean difference was not statistically significant (p=0.83). One out of the 30 samples extracted by IPF system had a low yield which we believe may have been due to experimental error. From this study, it was determined that the IPF prototype delivers similar HCV RNA yield and purity as the KingFisher and will be used in all following studies.
Figure 3.
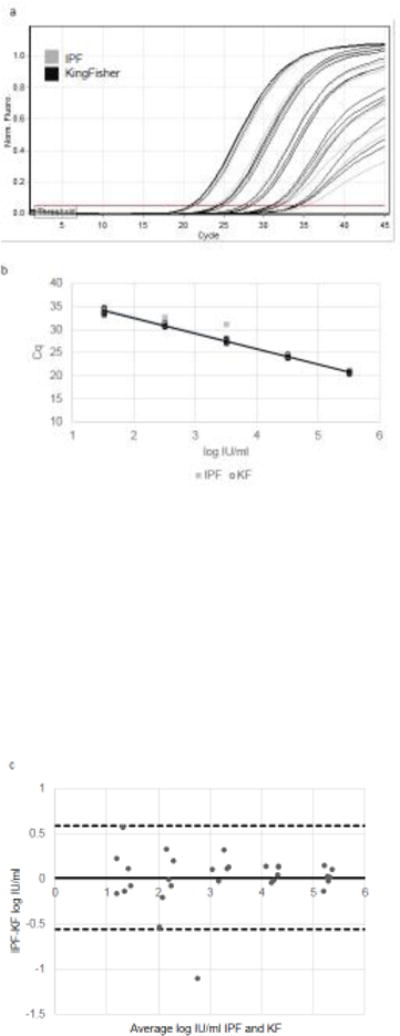
Comparison of RNA extraction of GT 1b HCV virus (American Red Cross sample 024GJ66260) using KingFisher versus IPF extraction prototype. (a) qPCR curves of 10-fold serial dilution series of 325,000 IU/ml to 33 IU/ml. N=6. qPCR cycle number (x-axis) plotted against fluorescence generated (y-axis). (b) Standard curve of log IU/ml concentration (x-axis) versus Cq (y-axis). KF= open black circles; equation of line y=−3.33x+39.11 [95% CI: −3.44, −3.22; p<0.0001] R2=0.99; qPCR efficiency= 100%; IPF=gray squares; equation of line y=−3.42x+39.61 [95% CI: −3.65,−3.18; p<0.0001] R2=0.97; qPCR efficiency = 96%. (c) Mean values obtained for each sample with IPF and KF extraction (x-axis) plotted against the difference between IPF and KF extractions (y-axis). Horizontal black solid line = mean difference between methods (0.011). Horizontal dashed black lines= ± 2 standard deviations of mean difference (0.59, −0.56). Range of agreement = −1.1 to 0.57 log IU/ml.
3.4 Limit of detection and reproducibility of HCV Quant Assay
To monitor for the efficiency of RNA extraction and the presence of amplification inhibitors, a noncompetitive internal control (IC) was added to the HCV assay. Primers and probe targeting the bacteriophage MS2 were developed, and the assay was multiplexed with the HCV assay. Standard curves of plasma containing HCV were run with and without the IC primers, probe and MS2 bacteriophage to demonstrate the consistency of the HCV assay. Samples that tested negative for the HCV assay and that had a failed IC were considered invalid.
The limit of detection (LOD) of the HCV Quant Assay was established by testing known numbers of IU/ml of HCV virus Genotype 1b (American Red Cross sample 024GJ66260) in plasma. By probit analysis, it was calculated that the LOD was 29.5 IU/ml (95% CI, 23 to 49) using 200 μl plasma input (Figure 4).
Figure 4.
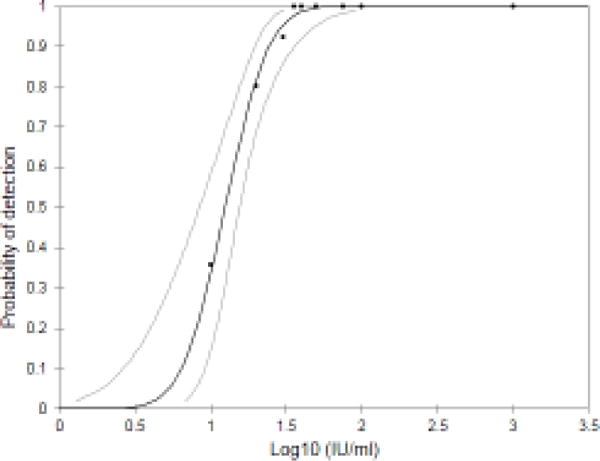
Limit of detection of HCV Quant Assay. GT 1b HCV virus (American Red Cross sample 024GJ66260) was spiked into HCV negative plasma to final concentrations of 10 (N=14), 20 (N=20), 30 (N=13), 36 (N=6), 40 (N=20), 50 (N=2), 75 (N=2), 100 (N=5), and 1000 (N=18) and then processed using IPF extraction. The percentage of assays where HCV was detected was then plotted for each concentration of virus. As determined by logistic regression, there was a 95% probability of detecting HCV in samples containing at least 1.48 log IU/ml (30 IU/ml; 95% CI, 23 to 49) with sample volume of 200 μl.
Six samples of HCV virus Genotype 1b as used above were prepared at two different concentrations, 1000 IU/ml and 1,000,000 IU/ml, tested on 3 different days and the variation of performance was analyzed (Table 2). The intra-assay reproducibility study showed that CVs of the novel assay were 1–3% for specimens with 1,000,000 IU/ml and 4–6% for specimens with 1000 IU/ml. The CVs for the inter-assay reproducibility study were 2% for 1,000,000 IU/ml and 5% for 1000 IU/ml. The intra-assay and inter-assay variation were acceptable for the HCV Quant Assay at its current state of development.
Table 2.
Results of reproducibility testing of HCV Quant Assay using IPF extraction of GT 1b HCV virus (American Red Cross sample 024GJ66260) from 3 different days at 1000 and 1,000,000 IU/ml.
| 103 IU/ml input | 106 IU/ml input | N for each conc. | |||||
|---|---|---|---|---|---|---|---|
| Ave.log(10) | SD | CV (%) | Ave.log(10) | SD | CV (%) | ||
| Day 1 | 2.89 | 0.17 | 6 | 6.01 | 0.12 | 2 | 6 |
| Day 2 | 3.08 | 0.13 | 4 | 5.88 | 0.16 | 3 | 6 |
| Day 3 | 2.98 | 0.15 | 5 | 6.00 | 0.07 | 1 | 6 |
| Combined | 2.98 | 0.16 | 5 | 5.96 | 0.13 | 2 | 18 |
3.5 Clinical verification of test performance
Forty HCV positive clinical samples acquired from A5294/BIRTH (Boceprevir, Interferon, Ribavirin to Treat HCV/HIV Coinfected Subjects Trial) study provided by ACTG with viral loads ≥100 IU/ml and 21 negative specimens were tested using the HCV Quant Assay, and the results were compared to the gold standard assay COBAS®TaqMan®HCV Test v. 2.0 (Table 3). All 40 HCV+ specimens were positive (100% sensitivity; 95% CI= 89–100%) and all 21 negative samples were negative (100% specificity; 95% CI=81–100%).
Table 3.
Clinical performance of HCV Quant Assay using IPF extraction verified with 61 specimens from the A5294/BIRTH trial (40 positives >100 IU/ml; 21 negatives) compared to Roche COBAS Ampliprep/COBAS Taqman HCV Test v2.0.
| Roche COBAS Ampliprep/COBAS Taqman HCV Test v2.0 | ||||
|---|---|---|---|---|
| Positive | Negative | |||
| HCV Quant Assay | Positive | 40 | 0 | 100% Sensitivity (95% CI: 89–100%) |
| Negative | 0 | 21 | 100% Specificity (95% CI: 81–100%) | |
| Total | 40 | 21 | 61 specimens | |
3.6 HCV Quant Viral Load Performance Compared to Abbott RealTime Assay
The 40 HCV positive ACTG specimens (see above) were tested with the Abbott RealTime HCV Assay to compare the values to the HCV Quant results. One of the samples was detected but the Cq value was outside the dynamic quantification range and was therefore not considered in this analysis. As shown in Figure 5a, HCV RNA values of the 39 samples quantified by Abbott RealTime HCV Assay and the HCV Quant Assay were highly correlated (R2=0.91). Agreement between the two tests was also evaluated by the Bland-Altman method [34] (Figure 5b) in which the differences between the log IU/ml quantified are plotted against the mean of the two results. The mean log difference between the HCV Quant Assay and the Abbott Assay was −0.25±0.33 log IU/ml. A single sample t-test in which the significance of the difference between the observed mean of the sample and a hypothetical mean of the population was performed (mean = 0.25, SD = 0.33, DF = 38) showed the mean difference was statistically significant (p<0.001). However, in practice, a difference of 0.1 – 0.2 log units is usually considered to be due to experimental errors and only differences of greater than 0.5 log are judged practically significant [35]. This value was very similar to what was observed between the Abbott and Roche COBAS tests [36], and we therefore concluded that the HCV Quant Assay had similar performance to the Abbott RealTime HCV Assay.
Figure 5.
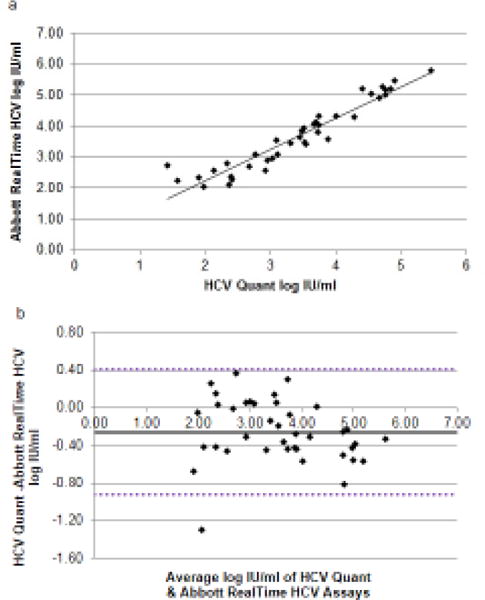
(a) Correlation between the two methods for HCV RNA determination. Log IU/ml quantified by HCV Quant Assay (x) plotted versus Abbott RealTime HCV Assay (y). R2=0.91. (b) Bland-Altman Plot. Mean values obtained for each sample with Abbott RealTime and HCV Quant assays (x-axis) plotted against the difference between Abbott RealTime HCV Assay and HCV Quant Assay determination (y-axis). Horizontal black solid line = mean difference between methods (−0.26). Horizontal dashed black lines= ± 2 standard deviations of mean difference (0.41,−0.92). Range of agreement −1.29 to 0.38 log IU/ml.
4. Discussion
Hepatitis C virus is one of the most common blood-borne pathogens worldwide with 80 million people estimated to have active chronic hepatitis C infection [1]. The burden of disease is disproportionately high in Central and East Asia and North Africa/Middle East. In spite of the high prevalence of disease and new opportunities for access to direct acting antiviral treatment, most people are unaware of their infection [37]. The presence of HCV RNA in peripheral blood is a reliable diagnostic marker for HCV infection; it can be detected prior to seroconversion to diagnose acute infection, distinguish active from resolved infections, and identify patients with chronic HCV that lack an antibody response such as patients on hemodialysis or those co-infected with HIV [38–40].
In this study, we developed and verified the performance of two building blocks for an integrated molecular diagnostic system: a highly sensitive RT-qPCR assay and an automated sample prep method. Equivalent detection of the 6 major HCV genotypes by RT-qPCR was achieved by targeting a highly conserved genetic region of the 5′UTR and an exogenous internal control that monitored RNA extraction and amplification efficiency. The sample prep method described here included the use of PMPs moved through an immiscible phase filter by external permanent magnets. Advantages of this automated magnetic system include reducing the number of wash steps by half while still isolating RNA that may be amplified without qPCR inhibition. The IPF extraction method utilizes a stationary microfluidic design that is conceived to be seamlessly integrated into a projected sample-to-answer qPCR system. A limitation of our study is that although the IPF sample prep method described is automated, the extraction prototypes are still in quite an early stage of development and operating them requires a highly skilled technician, and there is more variability in performance. The next design iteration will provide more precise results while requiring a lower skill level for operation.
The analytical sensitivity of the HCV Quant Assay was determined by spiking plasma with known concentrations of virus in 200 μl HCV-negative plasma. The LOD of 30 IU/ml is equivalent to the LOD of Abbott RealTime HCV Assay of 12 IU/ml for a 500 μl specimen. This high analytical sensitivity was a strong predictor for the high clinical sensitivity observed. In a small laboratory study performed on 40 HCV positive specimens with viral loads above 100 IU/ml and 21 HCV negative specimens, we demonstrated 100% clinical sensitivity and specificity and there was a strong level of agreement between viral loads measured by the HCV Quant and the Abbott RealTime HCV assays.
One of the obstacles of diagnostic testing of blood specimens in low resource settings is the lack of trained phlebotomists [41]. Capillary blood sampling by fingerstick is an alternative collection method that requires little training and does not have the expense of venipuncture supplies. However, the volume of blood that can be consistently obtained is limited compared to venipuncture. We recently reported that it is feasible to collect 150 μl of whole blood from a fingerstick [42], from which we estimate that 50 μl of plasma can be reliably collected even if the hematocrit is as high as 55%. Based upon the LOD of the HCV Quant Assay established by testing 200 μl plasma, the LOD from 50 μl plasma would be estimated to be 120 IU/ml, i.e. 4-times higher. Recently, a high-priority target product profile (TPP) for hepatitis C diagnosis in decentralized settings was published, identifying the optimal analytical sensitivity to be 200 IU/ml. This optimal LOD will allow >99% of infected patients to be detected [10, 43]. Therefore, the HCV Quant Assay has the potential to meet the TPP requirements using plasma collected from capillary blood supporting the use of this test at the point-of-care.
To the best of our knowledge, this is the first study that advances immiscible phase magnetic bead separation techniques like IPF beyond the proof of concept stage of model assays and contrived specimens toward a test that accurately quantifies viral copy numbers from clinical specimens. The next phase of this project will be to integrate the IPF extraction and RT-qPCR amplification into a singled closed cartridge containing all reagents required for sample prep, amplification and detection. In conjunction, we will develop an analyzer that performs all functions required for sample-to-answer testing with the goal of meeting the POC testing requirements of portability, minimal operator input, high sensitivity, multi-target detection and fast turnaround times.
Highlights.
A novel HCV RT-qPCR assay that equivalently detects genotypes 1–6 was developed.
RNA was isolated by automated immiscible phase filter extraction.
The limit of quantification was 30 IU/ml with 200 μl plasma sample volume.
Laboratory validation of 61 specimens demonstrated 100% sensitivity and specificity.
Acknowledgments
This study was supported by the National Cancer Institute grant Active Viral Hepatitis Diagnostics to Support Prevention/Treatment of HCC UH2 CA189965-01. The funder had no role in the study design; in the collection, analysis and interpretation of data; in the writing of the report; or in the decision to submit the article for publication. Thanks to K. Abravaya and D. Toolsie of Abbott Molecular Inc., Des Plaines, IL for testing the ACTG specimens with the Abbott RealTime HCV Assay. Clinical specimens from A5294/BIRTH study provided by ACTG. Adult HCV negative blood was provided by Core Lab, NorthShore University HealthSystems, Evanston, Illinois.
Abbreviations
- HCV
hepatitis C virus
- GT
genotype
- IPF
immiscible phase filter
- KF
KingFisher
- LOD
limit of detection
- IC
internal control
- NA
nucleic acid
Footnotes
Publisher's Disclaimer: This is a PDF file of an unedited manuscript that has been accepted for publication. As a service to our customers we are providing this early version of the manuscript. The manuscript will undergo copyediting, typesetting, and review of the resulting proof before it is published in its final citable form. Please note that during the production process errors may be discovered which could affect the content, and all legal disclaimers that apply to the journal pertain.
References
- 1.Gower E, et al. Global epidemiology and genotype distribution of the hepatitis C virus infection. J Hepatol. 2014;61(1 Suppl):S45–57. doi: 10.1016/j.jhep.2014.07.027. [DOI] [PubMed] [Google Scholar]
- 2.Mortality, G.C.C. Global, regional, and national age-sex specific all-cause and cause-specific mortality for 240 causes of death, 1990–2013: a systematic analysis for the Global Burden of Disease Study 2013. Lancet. 2015;385(9963):117–71. doi: 10.1016/S0140-6736(14)61682-2. [DOI] [PMC free article] [PubMed] [Google Scholar]
- 3.Cohn J, et al. Simplified diagnostic monitoring for hepatitis C, in the new era of direct-acting antiviral treatment. Curr Opin HIV AIDS. 2015;10(5):369–73. doi: 10.1097/COH.0000000000000180. [DOI] [PubMed] [Google Scholar]
- 4.Ford N, et al. Simplification of antiviral hepatitis C virus therapy to support expanded access in resource-limited settings. J Hepatol. 2014;61(1 Suppl):S132–8. doi: 10.1016/j.jhep.2014.09.019. [DOI] [PubMed] [Google Scholar]
- 5.WHO. Guidelines for the screening, care and treatment of persons with hepatitis C infection. 2014 [PubMed] [Google Scholar]
- 6.WHO. New Recommendations in the Updated Who Guidelines for the Screening, Care and Treatment of Persons with Chronic Hepatitis C Infection. 2016 [PubMed] [Google Scholar]
- 7.Martin NK, et al. Hepatitis C virus treatment for prevention among people who inject drugs: Modeling treatment scale-up in the age of direct-acting antivirals. Hepatology. 2013 doi: 10.1002/hep.26431. [DOI] [PMC free article] [PubMed] [Google Scholar]
- 8.Wedemeyer H, et al. Strategies to manage hepatitis C virus (HCV) disease burden. J Viral Hepat. 2014;21(Suppl 1):60–89. doi: 10.1111/jvh.12249. [DOI] [PubMed] [Google Scholar]
- 9.Boerekamps A, et al. Substantial Decline in Acute HCV Infections among Dutch HIV+MSM after DAA Roll Out, in CROI. Seattle, WA: 2017. [Google Scholar]
- 10.Trianni A, Paneer N, Denkinger C. High-priority target product profile for hepatitis C diagnosis in decentralized settings: Report of a consensus meeting 2015, FIND [Google Scholar]
- 11.Easterbrook PJ, et al. Diagnosis of viral hepatitis. Curr Opin HIV AIDS. 2017;12(3):302–314. doi: 10.1097/COH.0000000000000370. [DOI] [PMC free article] [PubMed] [Google Scholar]
- 12.Busch MP, Shafer KA. Acute-phase hepatitis C virus infection: implications for research, diagnosis, and treatment. Clin Infect Dis. 2005;40(7):959–61. doi: 10.1086/428583. [DOI] [PubMed] [Google Scholar]
- 13.Greenman J, et al. Dried blood spot in the genotyping, quantification and storage of HCV RNA: a systematic literature review. J Viral Hepat. 2015;22(4):353–61. doi: 10.1111/jvh.12345. [DOI] [PMC free article] [PubMed] [Google Scholar]
- 14.Kuiken C, Simmonds P. Nomenclature and numbering of the hepatitis C virus. Methods Mol Biol. 2009;510:33–53. doi: 10.1007/978-1-59745-394-3_4. [DOI] [PubMed] [Google Scholar]
- 15.Simmonds P. Genetic diversity and evolution of hepatitis C virus–15 years on. J Gen Virol. 2004;85(Pt 11):3173–88. doi: 10.1099/vir.0.80401-0. [DOI] [PubMed] [Google Scholar]
- 16.Cloherty G, et al. Sequence conservation of the region targeted by the Abbott RealTime HCV viral load assay. J Clin Microbiol. 2014;52(4):1220–1. doi: 10.1128/JCM.02661-13. [DOI] [PMC free article] [PubMed] [Google Scholar]
- 17.Dineva MA, MahiLum-Tapay L, Lee H. Sample preparation: a challenge in the development of point-of-care nucleic acid-based assays for resource-limited settings. Analyst. 2007;132(12):1193–9. doi: 10.1039/b705672a. [DOI] [PubMed] [Google Scholar]
- 18.Boom R, et al. Rapid purification of hepatitis B virus DNA from serum. J Clin Microbiol. 1991;29(9):1804–11. doi: 10.1128/jcm.29.9.1804-1811.1991. [DOI] [PMC free article] [PubMed] [Google Scholar]
- 19.Troiano D, Deraney RN, Tripathi A. Effect of surfactants on carryover liquid volume in immiscible phase magnetic bead separation. Colloids and Surfaces A: Physicochemical and Engineering Aspects. 2017;513:188–195. [Google Scholar]
- 20.Sur K, et al. Immiscible phase nucleic acid purification eliminates PCR inhibitors with a single pass of paramagnetic particles through a hydrophobic liquid. J Mol Diagn. 2010;12(5):620–8. doi: 10.2353/jmoldx.2010.090190. [DOI] [PMC free article] [PubMed] [Google Scholar]
- 21.Kelso DM, Sur K, Parpia Z. Barriers for facilitating biological reactions. Google Patents; 2012. [Google Scholar]
- 22.Beebe DJ, Barry SM. Device for and method of extracting a fraction from a biological sample. Google Patents; 2013. [Google Scholar]
- 23.Beebe DJ, et al. Device for and method of extracting a fraction from a biological sample. Google Patents; 2014. [Google Scholar]
- 24.Berry SM, Alarid ET, Beebe DJ. One-step purification of nucleic acid for gene expression analysis via Immiscible Filtration Assisted by Surface Tension (IFAST) Lab Chip. 2011;11(10):1747–53. doi: 10.1039/c1lc00004g. [DOI] [PMC free article] [PubMed] [Google Scholar]
- 25.Berry SM, Maccoux LJ, Beebe DJ. Streamlining immunoassays with immiscible filtrations assisted by surface tension. Anal Chem. 2012;84(13):5518–23. doi: 10.1021/ac300085m. [DOI] [PubMed] [Google Scholar]
- 26.den Dulk RC, et al. Magneto-capillary valve for integrated purification and enrichment of nucleic acids and proteins. Lab Chip. 2013;13(1):106–18. doi: 10.1039/c2lc40929a. [DOI] [PubMed] [Google Scholar]
- 27.Uehara M, et al. A Rapid and Automated Device for Purifying Nucleic Acids. Anal Sci. 2016;32(3):371–4. doi: 10.2116/analsci.32.371. [DOI] [PubMed] [Google Scholar]
- 28.Kuiken C, et al. The Los Alamos hepatitis C sequence database. Bioinformatics. 2005;21(3):379–84. doi: 10.1093/bioinformatics/bth485. [DOI] [PubMed] [Google Scholar]
- 29.Nilsen TW. Gel Purification of RNA. Cold Spring Harbor Protocols. 2013;2013(2) doi: 10.1101/pdb.prot072942. p. pdb.prot072942. [DOI] [PubMed] [Google Scholar]
- 30.Bustin SA, et al. Primer sequence disclosure: a clarification of the MIQE guidelines. Clin Chem. 2011;57(6):919–21. doi: 10.1373/clinchem.2011.162958. [DOI] [PubMed] [Google Scholar]
- 31.Beck ET, et al. Development of a Rapid Automated Influenza A, Influenza B, and Respiratory Syncytial Virus A/B Multiplex Real-Time RT-PCR Assay and Its Use during the 2009 H1N1 Swine-Origin Influenza Virus Epidemic in Milwaukee, Wisconsin. J Mol Diagn. 2010;12(1):74–81. doi: 10.2353/jmoldx.2010.090095. [DOI] [PMC free article] [PubMed] [Google Scholar]
- 32.Cramer AD, et al. Device for isolating an analyte from a sample, and methods of use. Google Patents; 2013. [Google Scholar]
- 33.Morris C, Prescott G, Hockley J. Collaborative Study to Evaluate the WHO ECBS Report. WHO Expert Committee on Biological Standardization; 2015. Proposed 5th WHO International Standard for Hepatitis C Virus (HCV) for Nucleic Acid AmplificationTechnology (NAT)-Based Assays. [Google Scholar]
- 34.Bland JM, Altman DG. Statistical methods for assessing agreement between two methods of clinical measurement. Lancet. 1986;1(8476):307–10. [PubMed] [Google Scholar]
- 35.Jagodzinski LL, et al. Use of calibrated viral load standards for group M subtypes of human immunodeficiency virus type 1 to assess the performance of viral RNA quantitation tests. J Clin Microbiol. 2000;38(3):1247–9. doi: 10.1128/jcm.38.3.1247-1249.2000. [DOI] [PMC free article] [PubMed] [Google Scholar]
- 36.Worlock A, et al. Analytical characteristics and comparative evaluation of Aptima HCV quant Dx assay with the Abbott RealTime HCV assay and Roche COBAS AmpliPrep/COBAS TaqMan HCV quantitative test v2.0. Virol J. 2017;14(1):017–0727. doi: 10.1186/s12985-017-0727-3. [DOI] [PMC free article] [PubMed] [Google Scholar]
- 37.Easterbrook PJ. Who to test and how to test for chronic hepatitis C infection – 2016 WHO testing guidance for low- and middle-income countries. Journal of Hepatology. 2016;65(1, Supplement):S46–S66. doi: 10.1016/j.jhep.2016.08.002. [DOI] [PubMed] [Google Scholar]
- 38.Cobb B, et al. HCV RNA Viral Load Assessments in the Era of Direct-Acting Antivirals. Am J Gastroenterol. 2013;108(4):471–475. doi: 10.1038/ajg.2012.248. [DOI] [PubMed] [Google Scholar]
- 39.Firdaus R, et al. Current molecular methods for the detection of hepatitis C virus in high risk group population: A systematic review. World J Virol. 2015;4(1):25–32. doi: 10.5501/wjv.v4.i1.25. [DOI] [PMC free article] [PubMed] [Google Scholar]
- 40.Mukherjee R, et al. Diagnosis and Management of Hepatitis C Virus Infection. J Lab Autom. 2015;20(5):519–38. doi: 10.1177/2211068214563794. [DOI] [PubMed] [Google Scholar]
- 41.Fiscus SA, et al. HIV-1 viral load assays for resource-limited settings. PLoS Med. 2006;3(10) doi: 10.1371/journal.pmed.0030417. [DOI] [PMC free article] [PubMed] [Google Scholar]
- 42.Maiers TJ, et al. An investigation of fingerstick blood collection for point-of-care HIV-1 viral load monitoring in South Africa. S Afr Med J. 2015;105(3):228–31. doi: 10.7196/samj.7799. [DOI] [PubMed] [Google Scholar]
- 43.Glynn SA, et al. Dynamics of viremia in early hepatitis C virus infection. Transfusion. 2005;45(6):994–1002. doi: 10.1111/j.1537-2995.2005.04390.x. [DOI] [PubMed] [Google Scholar]