

Abstract
Background
A relationship has been established between socioeconomic status and hypertension. The aim of this study was to determine the prevalence of hypertension and to explore the links between hypertension and socioeconomic factors in the adult population of Malta.
Methods
A national representative cross-sectional health examination study was performed between 2014 and 2016. Sociodemographic and medical history data was gathered by validated questionnaires while blood pressure was measured. Prevalence rates of known hypertension, newly hypertension, and global hypertension were calculated. Associations between sociodemographic characteristics and hypertension were identified through logistic regression models.
Results
Hypertension contributed to 30.12% (CI 95%: 28.71–31.57) of the study population, with a male preponderance. The majority was known hypertensive (73.59% CI 95%: 71.01–76.02), with only three-quarters on medication. Multivariant analyses showed that increasing age and body mass index, male gender, and living in Gozo, Western district, and Northern Harbour district were associated with having hypertension.
Conclusion
Hypertension is a problem in Malta especially in the male population and with increasing age and body mass index. Education did not exhibit any associated risk for having hypertension, which is inconsistent with the literature, while habitat localities played a role in hypertension development.
1. Introduction
High blood pressure is a serious public health concern, with the World Health Organization (WHO) reporting a hypertension global mortality rate of 13% [1]. Hypertension is estimated to contribute to 25% of all European myocardial infarctions [2]. In fact, the WHO European Region document Health 2020 Policy gave hypertension high priority in order to tackle the epidemic and to reduce its prevalence [3]. High blood pressure is a preventable disease and has been associated directly with lifestyle habits, including tobacco smoking, a lack of physical activity, and alcohol consumption [2]. In fact, the relationship between hypertension and socioeconomic status has been well established [4].
Socioeconomic status (SES) is a complex term combining a number of variables, including employment status, educational level, income, and wealth as well as place of residence. SES is a well-established cardiovascular risk factor and means for predicting behaviour [5, 6]. The educational level has been established as the best marker of SES since it offers the most stable measure at an individual level and does not have the problem of reverse causation such as income and wealth status [6].
Malta is a Mediterranean island at crossroads between Europe and Africa, with 40.1% of the mortality rate attributed to cardiovascular disease [7]. Considering the small size of this island and its crucial location, a representative adult health examination cross-sectional study was considered feasible to provide much needed information on health effects. The aim of this study was to determine the prevalence of hypertension and to explore the links between hypertension and socioeconomic factors in the adult population of Malta.
2. Method
A cross-sectional study was conducted by the University of Malta between November 2014 and January 2016, with the survey name of “SAHHTEK” (your health). The detailed survey methodology was described elsewhere [8]. In summary, a randomized stratified sample, by age (18 to 70 years) and gender, representing approximately 1% of the total population from each Maltese town, was invited to participate in the health examination survey. A validated sociodemographic and medical history questionnaire was filled in during the survey [8]. The health examination consisted of three consecutive blood pressure readings after a 20-minute rest (sitting down), besides anthropometric measurements. The average of the three blood pressure readings was recoded and used for this study. Informed consent was obtained from every participant. Ethical and data protection approvals were granted from the University of Malta Research Ethical Committee (UREC) and the Information and Data Protection Commissioner, respectively.
The population reporting a history of hypertension or who was on antihypertensive medication was labeled as “known hypertensive.” Participants with a systolic blood pressure over 140 mmHg or a diastolic blood pressure above 90 mmHg and who were not known hypertensives were labeled as “newly hypertensive.” Those reporting to suffer from known hypertension but did not report to be on treatment and were found to have a normal blood pressure during health examination were labeled as normotensive. All population with no history of hypertension and a normal blood pressure during health examination was also labeled as normotensive.
The known hypertensive and the newly hypertensive subpopulations were considered collectively as the global hypertension population for this study. The prevalence rates of known hypertension, newly hypertension, and the global hypertension population were calculated. The study population was age-stratified by 10-year age groups (20 to 69 years), and considering the representative prevalence rates in these age groups, an estimate of the total Maltese adult population suffering from hypertension was calculated.
The links between self-reported sociodemographic, lifestyle variables (residing district, highest educational level, employment status, smoking habits, alcohol consumption habits, and physical activity levels), body mass index (BMI), and hypertension were explored. Univariate and multiple variant logistic regression models were performed to assess any associations between these sociodemographic characteristics and hypertension.
3. Results
The survey response rate was of 49% (n = 3947), out of which 30.12% (CI 95%: 28.71–31.57) contributed to the hypertension population (n = 1189). Hypertensive males accounted for 35.04% (CI 95%: 32.97–37.15) of the total study male population, while hypertensive females accounted for 25.09% (CI 95%: 23.21–27.06) of the total female study population. On age and gender stratification, a male predominance was present throughout all age groups, as seen in Figure 1. With increasing age in the 20- to 39-year bracket, males had higher blood pressure levels, while the female population actually had slightly lowered prevalence with increasing age in this bracket. However, from the age of 40 years, a higher prevalence rate of hypertension was exhibited for both genders with every age increase. On applying the prevalence rates for each age group and gender to the total Maltese population by age and gender [9], an estimated distribution of hypertension within the Maltese population was established, as seen in Table 1.
Figure 1.
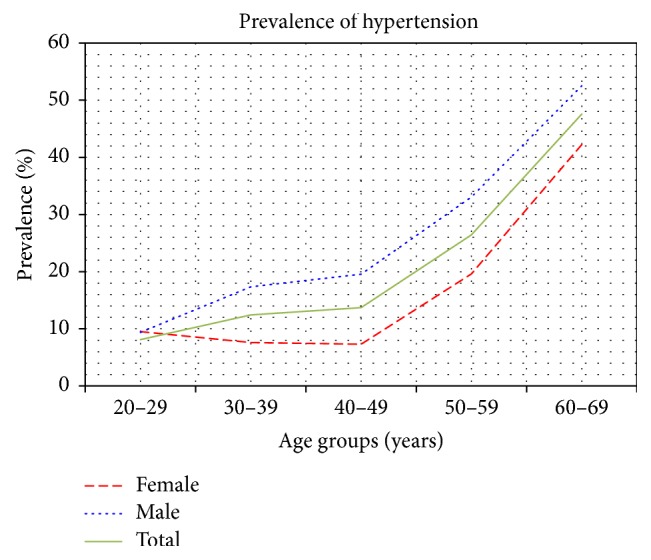
Distribution of hypertension prevalence by age groups and gender.
Table 1.
Distribution of the estimated Maltese hypertension population, by age groups and gender.
(a).
| Total Maltese population by age∗ | Total population with hypertension | Percentage with hypertension, by age | |
|---|---|---|---|
| 20–29 | 55,218 | 5,345 | 9.68% |
| 30–39 | 56,184 | 7,193 | 12.80% |
| 40–49 | 48,406 | 6,466 | 13.36% |
| 50–59 | 57,291 | 15,223 | 26.57% |
| 60–69 | 55,986 | 26,395 | 47.15% |
|
| |||
| Total | 273,085 | 60,622 | |
(b).
| Total male Maltese population by age∗ | Male with hypertension | Percentage with hypertension, by age | |
|---|---|---|---|
| 20–29 | 28,228 | 2,646 | 9.38% |
| 30–39 | 28,837 | 5,005 | 17.36% |
| 40–49 | 24,546 | 4,796 | 19.54% |
| 50–59 | 28,822 | 9,529 | 33.06% |
| 60–69 | 27,388 | 14,384 | 52.52% |
|
| |||
| Total | 137,821 | 36,360 | |
(c).
| Total female Maltese population by age∗ | Female with hypertension | Percentage with hypertension, by age | |
|---|---|---|---|
| 20–29 | 26,990 | 2,699 | 10.00% |
| 30–39 | 27,347 | 2,188 | 8.00% |
| 40–49 | 23,860 | 1,670 | 7.00% |
| 50–59 | 28,469 | 5,694 | 20.00% |
| 60–69 | 28,598 | 12,011 | 42.00% |
|
| |||
| Total | 135,264 | 24,262 | |
∗Demographic data 2013.
The majority of the hypertension population consisted of known hypertensives (73.59% CI 95%: 71.01–76.02), with the male prevalence of 71.29% (CI 95%: 67.82–74.52) and a female prevalence of 76.89% (CI 95%: 72.95–80.42). Among the known hypertensives, 85.60% (CI 95%: 83.11–87.78) were on medication. However, 5.34% (CI 95%: 3.93–7.21) were found to have uncontrolled systolic blood pressure (>140 mmHg) while 1.20% (CI 95%: 0.60–2.30) had uncontrolled diastolic blood pressure (>90 mmHg) during the health examination survey. Out of those reporting to suffer from hypertension, 5.52% (CI 95%: 4.19–7.23) did not report to be on treatment and were found to have a normal blood pressure during the health examination. This subgroup may have exhibited an error in their medical history recall and were therefore considered to be normotensive.
The newly hypertensive population contributed to 26.41% (CI 95%: 23.98–28.99) of the hypertension population. The majority (64.01% CI 95%: 58.56–69.13) of the newly diagnosed hypertensives were male. Table 2 demonstrates different hypertension characteristics by gender. The Maltese males tend to be more likely to have an elevated blood pressure, be unaware of their hypertension, be untreated, or have uncontrolled blood pressure.
Table 2.
Demonstrating hypertension characteristics, by gender.
| Hypertension characteristics | Male (%) [n = 1998] | Female (%) [n = 1949] | Total (%) [n = 3947] |
|---|---|---|---|
| Normotensive | 1298 (64.96) | 1460 (74.91) | 2758 (69.88) |
| Hypertensive (global hypertension) | 700 (35.04) | 489 (25.09) | 1189 (30.12) |
| Unaware (newly hypertensive) | 201 (10.06) | 113 (5.80) | 314 (7.96) |
| Aware (known hypertensive) | 499 (24.97) | 376 (19.29) | 875 (22.17) |
| Untreated | 81 (4.05) | 45 (2.31) | 126 (3.19) |
| Treated | 418 (20.92) | 331 (16.98) | 749 (18.98) |
| Uncontrolled | 32 (1.60) | 15 (0.77) | 47 (1.19) |
| Controlled | 386 (19.32) | 316 (16.21) | 702 (17.79) |
|
| |||
| Total with elevated blood pressure | 668 (33.43) | 474 (24.32) | 1142 (28.93) |
4. Hypertension Population and Sociodemographic Characteristics
On comparing the sociodemographic characteristics and lifestyle factors to the hypertensive and normotensive populations, significant differences were observed. These differences are outlined in Table 3.
Table 3.
Distribution of the sociodemographic characteristics in the normotensive and the hypertensive populations by gender.
| Hypertensive (total) | Normotensive | p value∗ | Hypertensive | p value∗ | |||
|---|---|---|---|---|---|---|---|
| Male (n = 729) | Female (n = 529) | ||||||
| Locality | Southern Harbour | 585 | 215 | 0.0001 | 124 | 91 | 0.0001 |
| Northern Harbour | 731 | 340 | 195 | 145 | |||
| Southeastern | 382 | 220 | 122 | 97 | |||
| Western | 360 | 186 | 109 | 77 | |||
| Northern | 423 | 163 | 91 | 72 | |||
| Gozo | 208 | 134 | 87 | 46 | |||
|
| |||||||
| Education | Low educational level | 361 | 273 | 0.0001 | 160 | 201 | 0.0001 |
| Medium educational level | 497 | 1034 | 284 | 213 | |||
| High educational level | 399 | 1382 | 285 | 114 | |||
|
| |||||||
| Employment status | Employed | 625 | 1898 | 0.0001 | 473 | 153 | 0.0001 |
| Not in employment | 632 | 791 | 256 | 376 | |||
|
| |||||||
| Smoking habit | Smoking | 268 | 691 | 0.003 | 192 | 76 | 0.001 |
| Nonsmoking | 990 | 1999 | 537 | 453 | |||
|
| |||||||
| Alcohol consumption | Alcohol consumption | 1487 | 625 | 0.001 | 458 | 167 | 0.0001 |
| No-alcohol consumption | 1203 | 633 | 271 | 361 | |||
|
| |||||||
| Physical activity | No activity | 290 | 98 | 0.015 | 45 | 53 | 0.084 |
| Walk | 522 | 230 | 138 | 91 | |||
| Moderate activity | 1585 | 783 | 458 | 325 | |||
| Vigorous activity | 292 | 147 | 88 | 59 | |||
∗Chi-square.
Multivariant analyses showed that increasing age and increasing BMI, the male gender, physical activity, and living in Gozo, Western district, and Northern Harbour were associated with the development of hypertension (Table 4).
Table 4.
Demonstrates the crude and adjusted sociodemographic independent variables for the development of hypertension.
| Sociodemographic factors | Crude analysis | Adjusted analysis | ||||
|---|---|---|---|---|---|---|
| OR | CI | p value | OR | CI | p value | |
| Male | 1.521 | 1.332–1.737 | 0.0001 | 1.83 | 1.544–2.168 | 0.0001 |
| Female∗ | Reference | Reference | ||||
|
| ||||||
| High educational level | 0.218 | 0.181–0.264 | 0.0001 | 0.935 | 0.731–1.195 | 0.592 |
| Medium educational level | 0.369 | 0.307–0.445 | 0.0001 | 0.923 | 0.741–1.149 | 0.471 |
| Low educational level∗ | Reference | Reference | ||||
|
| ||||||
| No-alcohol use | 1.247 | 1.093–1.423 | 0.001 | 1.018 | 0.866–1.197 | 0.827 |
| Alcohol use∗ | Reference | Reference | ||||
|
| ||||||
| Nonsmoking | 1.285 | 1.097–1.505 | 0.002 | 0.981 | 0.815–1.181 | 0.839 |
| Smoking∗ | Reference | Reference | ||||
|
| ||||||
| Vigorous activity | 1.433 | 1.065–1.929 | 0.018 | 1.492 | 1.057–2.104 | 0.023 |
| Moderate activity | 1.41 | 1.111–1.789 | 0.005 | 1.341 | 1.023–1.758 | 0.034 |
| Walk | 1.264 | 0.965–1.655 | 0.09 | 1.143 | 0.842–1.553 | 0.391 |
| No activity∗ | Reference | Reference | ||||
|
| ||||||
| Gozo | 1.727 | 1.329–2.245 | 0.0001 | 1.771 | 1.303–2.408 | 0.0001 |
| Northern | 1.032 | 0.817–1.304 | 0.794 | 1.124 | 0.857–1.474 | 0.399 |
| Western | 1.424 | 1.125–1.802 | 0.003 | 1.473 | 1.121–1.937 | 0.005 |
| Southeastern | 1.541 | 1.229–1.9332 | 0.0001 | 1.674 | 1.287–2.178 | 0.0001 |
| Northern Harbour | 1.241 | 1.02–1.51 | 0.031 | 1.204 | 0.961–1.509 | 0.107 |
| Southern Harbour∗ | Reference | Reference | ||||
|
| ||||||
| Not in employment | 2.421 | 2.114–2.772 | 0.0001 | 1.181 | 0.974–1.432 | 0.091 |
| Employed∗ | Reference | Reference | ||||
|
| ||||||
| BMI | 1.127 | 1.113–1.141 | 0.0001 | 1.104 | 1.088–1.210 | 0.0001 |
|
| ||||||
| Age | 1.07 | 1.07–1.08 | 0.0001 | 1.066 | 1.058–1.073 | 0.0001 |
∗Reference category.
Alcohol consumption, smoking habit, education level, and employment status were not found to have a significant associated risk on hypertension after adjustment for all sociodemographic and lifestyle habits.
5. Discussion
Hypertension is one of the leading causes of cardiovascular disease and mortality worldwide [10]. The prevalence of hypertension varies from one global region to another, with the highest prevalence being in the African region (46%) and the lowest in America (35%), with the European region prevalence rate reported to be somewhere in between these two continents [11, 12]. The male gender, in our study, exhibited the highest hypertension prevalence, which is consistent with what is normally found within high-income countries [13].
On comparing the hypertension prevalence found in our study to a Pan-European study conducted in 5 European countries, Malta exhibited the highest hypertension prevalence [14]. This Pan-European study had reported that Germany had the highest hypertension prevalence among UK, Italy, France, and Spain. Malta showed higher prevalence rates for each gender (Germany male: 25.1%, female: 22.9%; Malta male: 36.49%, female: 27.14%), although one needs to keep in mind that different age bands (Malta study: 18 to 70 years, Pan-European study: 20–79 years) were examined in both studies [14]. Conversely, our study population reported Maltese hypertensives having a higher antihypertensive pharmacological prescription frequency when compared to the average European prescription frequency [15, 16]. Nonadherence to antihypertensive medication is a global issue and leads to loss of clinical efficacy as well as to loss of economic efficiency resulting in an increase in hospitalization costs [16].
Hypertension determinants are well established and include age, gender, sociodemographic factors, obesity, smoking, excess alcohol, and sedentary lifestyle [17, 18]. On univariant analysis, education level, which is considered as the most stable determinant of socioeconomic status, was found to exhibit an associated protective effect against having hypertension in our study. This effect was lost on adjusting for age and gender, which could be the result of a change in education opportunities over time and more females are continuing their education. This finding is inconsistent with other association reports where the level of education was found to have an inverse association with blood pressure [19, 20].
The female gender in our study was found to exhibit an associated protective effect on hypertension. This is partially consistent with findings from other studies within other high-income countries [21]. However, this protective effect exhibited by our female population was previously reported in middle-income countries and not high-income countries like Malta [22–24].
Intense physical activity was found to increase the risk of having hypertension in our study, which is not consistent with the literature [25]. A possible reason to this finding follows the fact that the Maltese population is well known to be at high risk of metabolic diseases. A proportion of the population follows lifestyle interventions to try to halt the development of these noncommunicable diseases, which may have led to this finding.
A link was established between three different districts (Gozo, Western, and Northern Harbour) and having hypertension. Further research is required to assess whether an environmental or a genetic cause may be contributing to this relationship. However, a possible explanation for the link between the Northern Harbour and hypertension could result from the fact that the majority of the Maltese population lives in this district.
A link has been reported between alcohol consumption and blood pressure, with chronic drinkers having a longer impact on blood pressure outcomes [26]. A linear relationship had been reported between alcohol intake and blood pressure [27]. This was not the case in our study, where nonalcohol drinkers were found to be at risk of having hypertension. However, this associated effect of alcohol consumption on hypertension development was lost once various confounder factors were adjusted for, suggesting that no direct link between alcohol and hypertension was evident in our population.
6. Study Limitations and Strengths
The response rate for the health examination was rather low due to the invasive blood measurement required, which may have affected the results. The demographic data and lifestyle habits were self-reported by participants. This predisposes the risk of human bias or inaccurate recollection of information. Blood pressure measurement is very sensitive; accuracy may have been affected by the behaviour of the participant, the environment of the setup, and the aneroid sphygmomanometer device used even though sphygmomanometers were calibrated regularly. Auscultation fieldworker observer errors may have occurred including systematic error in auscultation method if the observer did not hear well enough or had slow reactions to auditory and visual cues, even though fieldworkers were trained and their readings double checked with other experienced blood pressure measurers prior to initiation of the fieldwork. Measurement of blood pressure was taken after 20 minutes of sitting down; this avoided any blood pressure fluctuations. All participants were asked to sit up straight with both feet touching the floor and their arms resting at the heart level, where these techniques were found to enable more accurate readings. The study was a cross-sectional study, which does not adjust for changes in behaviour after the diagnoses of hypertension or other diseases. There is thus great difficulty in linking exposures with outcomes from this study in any causative way.
7. Conclusion
Approximately a third of the adult population in Malta (mostly males) suffered from hypertension. Aging males, increase in BMI, and living in Gozo, Western district, and Northern Harbour exhibited a higher associated risk to develop hypertension. Education levels were not found to be associated with the hypertension development.
Acknowledgments
The authors are extremely grateful for the strong support forthcoming from the University of Malta (through the Medical School and Research Innovative Development Trust Department) and from the Alfred Mizzi Foundation as major sponsors, as well as that of a host of others, including Atlas Health Insurance (Malta). The in-kind support and encouragement of the Parliamentary Secretariat for Health of the Government of Malta are also gratefully acknowledged.
Disclosure
The funding body had no influence on the protocol of the survey or on the data analysis. No author received any personal funding.
Conflicts of Interest
The authors declare that they have no conflicts of interest.
References
- 1.WHO. Global Health Risks: Mortality And Burden of Disease Attributable to Selected Major Risks. Geneva, Switzerland: WHO; 2009. [Google Scholar]
- 2.WHO. High Blood Pressure – Country Experience And Effective Interventions Utilized across The European Region. Copenhagen, Denmark: WHO; 2013. [Google Scholar]
- 3.WHO. Health 2020: A European Policy Framework Supporting Action across Government And Society for Health And Well-Being. Copenhagen, Denmark: WHO; 2012. [Google Scholar]
- 4.Leng B., Jin Y., Li G., Chen L., Jin N. Socioeconomic status and hypertension: a meta-analysis. Journal of Hypertension. 2015;33(2):221–229. doi: 10.1097/HJH.0000000000000428. [DOI] [PubMed] [Google Scholar]
- 5.Lam C. S. P. The socioeconomics of hypertension: How $50 000 may buy a drop in blood pressure. Hypertension. 2011;58(2):140–141. doi: 10.1161/HYPERTENSIONAHA.111.175984. [DOI] [PubMed] [Google Scholar]
- 6.Minor D., Wofford M., Wyatt S. B. Does socioeconomic status affect blood pressure goal achievement? Current hypertension reports. 2008;10(5):390–397. doi: 10.1007/s11906-008-0073-3. [DOI] [PubMed] [Google Scholar]
- 7.Department of Health Information and Research. Annual Mortality Report National Mortality Registry. Gwardamangia. Gwardamangia, Malta: Department of Health Information and Research; 2013. [Google Scholar]
- 8.Cuschieri S., Vassallo J., Calleja N., Pace N., Mamo J. Diabetes, pre-diabetes and their risk factors in malta: a study profile of national cross-sectional prevalence study. Global Health, Epidemiology and Genomics. 2016;1 doi: 10.1017/gheg.2016.18. [DOI] [PMC free article] [PubMed] [Google Scholar]
- 9.NSO. Demographic Review 2013. Valletta, Malta: NSO: National Statistics Office; 2015. [Google Scholar]
- 10.Tao L., Pu C., Shen S., Fang H., Wanf X., Xuan Q. Tendency for age-specific mortality with hypertension in the European Union from 1980 to 2011. International Journal of Clinical and Experimental Medicine. 2015;8(2):1611–1623. [PMC free article] [PubMed] [Google Scholar]
- 11.Stevens G., Mascarenhas M., Mathers C. Global health risks: progress and challenges. Bulletin of the World Health Organization. 2009;87(9):p. 646. doi: 10.2471/BLT.09.070565. [DOI] [PMC free article] [PubMed] [Google Scholar]
- 12.Wolf-Maier K., Cooper R. S., Banegas J. R., et al. Hypertension prevalence and blood pressure levels in 6 European countries, Canada, and the United States. The Journal of the American Medical Association. 2003;289(18):2363–2369. doi: 10.1001/jama.289.18.2363. [DOI] [PubMed] [Google Scholar]
- 13.Mills K. T., Bundy J. D., Kelly T. N., et al. Global disparities of hypertension prevalence and control. Circulation. 2016;134(6):441–450. doi: 10.1161/CIRCULATIONAHA.115.018912. [DOI] [PMC free article] [PubMed] [Google Scholar]
- 14.Eichmann F., Potthoff P., Schmidt M. PCV115 burden of hypertension in selected EU countries: 2010-2025. Value in Health. 2012;15(7):p. A383. doi: 10.1016/j.jval.2012.08.1058. [DOI] [Google Scholar]
- 15.Breitscheidel L., Ehlken B., Kostev K., Oberdiek M. S. A., Sandberg A., Schmieder R. E. Real-life treatment patterns, compliance, persistence, and medication costs in patients with hypertension in Germany. Journal of Medical Economics. 2012;15(1):155–165. doi: 10.3111/13696998.2011.635229. [DOI] [PubMed] [Google Scholar]
- 16.Mennini F. S., Marcellusi A., von der Schulenburg J. M., et al. Cost of poor adherence to anti-hypertensive therapy in five European countries. The European Journal of Health Economics. 2015;16(1):65–72. doi: 10.1007/s10198-013-0554-4. [DOI] [PubMed] [Google Scholar]
- 17.Joffres M., Falaschetti E., Gillespie C., et al. Hypertension prevalence, awareness, treatment and control in national surveys from England, the USA and Canada, and correlation with stroke and ischaemic heart disease mortality: a cross-sectional study. BMJ Open. 2013;3(8) doi: 10.1136/bmjopen-2013-003423.e003423 [DOI] [PMC free article] [PubMed] [Google Scholar]
- 18.Vasan R. S., Larson M. G., Leip E. P., Kannel W. B., Levy D. Assessment of frequency of progression to hypertension in non-hypertensive participants in the Framingham Heart Study: a cohort study. The Lancet. 2001;358(9294):1682–1686. doi: 10.1016/S0140-6736(01)06710-1. [DOI] [PubMed] [Google Scholar]
- 19.Wang Y., Chen J., Wang K., Edwards C. L. Education as an important risk factor for the prevalence of hypertension and elevated blood pressure in Chinese men and women. Journal of Human Hypertension. 2006;20(11):898–900. doi: 10.1038/sj.jhh.1002086. [DOI] [PubMed] [Google Scholar]
- 20.Brummett B. H., Babyak M. A., Siegler I. C., et al. Systolic blood pressure, socioeconomic status, and biobehavioral risk factors in a nationally representative us young adult sample. Hypertension. 2011;58(2):161–166. doi: 10.1161/HYPERTENSIONAHA.111.171272. [DOI] [PMC free article] [PubMed] [Google Scholar]
- 21.Colhoun H. M., Hemingway H., Poulter N. R. Socio-economic status and blood pressure: an overview analysis. Journal of Human Hypertension. 1998;12(2):91–110. doi: 10.1038/sj.jhh.1000558. [DOI] [PubMed] [Google Scholar]
- 22.Fleischer N. L., Diez Roux A. V., Alazraqui M., Spinelli H., De Maio F. Socioeconomic gradients in chronic disease risk factors in middle-income countries: Evidence of effect modification by urbanicity in Argentina. American Journal of Public Health. 2011;101(2):294–301. doi: 10.2105/AJPH.2009.190165. [DOI] [PMC free article] [PubMed] [Google Scholar]
- 23.Cois A., Ehrlich R. Analysing the socioeconomic determinants of hypertension in South Africa: a structural equation modelling approach. BMC Public Health. 2014;14, article 414 doi: 10.1186/1471-2458-14-414. [DOI] [PMC free article] [PubMed] [Google Scholar]
- 24.World Bank. Malta, 2016, Available at: http://data.worldbank.org/country/malta.
- 25.Diaz K. M., Shimbo D. Physical activity and the prevention of hypertension. Current Hypertension Reports. 2013;15(6):659–668. doi: 10.1007/s11906-013-0386-8. [DOI] [PMC free article] [PubMed] [Google Scholar]
- 26.Marmot M. G., Elliott P., Shipley M. J., et al. Alcohol and blood pressure: the INTERSALT study. British Medical Journal. 1994;308(6939):1263–1267. doi: 10.1136/bmj.308.6939.1263. [DOI] [PMC free article] [PubMed] [Google Scholar]
- 27.Saunders J. B., Beevers D. G., Paton A. Alcohol-induced hypertension. The Lancet. 1981;318(8248):653–656. doi: 10.1016/S0140-6736(81)90995-8. [DOI] [PubMed] [Google Scholar]