

Abstract
Obesity is associated with chronic low-grade inflammation, and metabolic regulators linking obesity to inflammation have therefore received much attention. Secreted C1q/TNF-related proteins (CTRPs) are one such group of regulators that regulate glucose and fat metabolism in peripheral tissues and modulate inflammation in adipose tissue. We have previously shown that expression of CTRP6 is up-regulated in leptin-deficient mice and, conversely, down-regulated by the anti-diabetic drug rosiglitazone. Here, we provide evidence for a novel role of CTRP6 in modulating both inflammation and insulin sensitivity. We found that in obese and diabetic humans and mouse models, CTRP6 expression was markedly up-regulated in adipose tissue and that stromal vascular cells, such as macrophages, are a major CTRP6 source. Overexpressing mouse or human CTRP6 impaired glucose disposal in peripheral tissues in response to glucose and insulin challenge in wild-type mice. Conversely, Ctrp6 gene deletion improved insulin action and increased metabolic rate and energy expenditure in diet-induced obese mice. Mechanistically, CTRP6 regulates local inflammation and glucose metabolism by targeting macrophages and adipocytes, respectively. In cultured macrophages, recombinant CTRP6 dose-dependently up-regulated the expression and production of TNF-α. Conversely, CTRP6 deficiency reduced circulating inflammatory cytokines and pro-inflammatory macrophages in adipose tissue. CTRP6-overexpressing mice or CTRP6-treated adipocytes had reduced insulin-stimulated Akt phosphorylation and glucose uptake. In contrast, loss of CTRP6 enhanced insulin-stimulated Akt activation in adipose tissue. Together, these results establish CTRP6 as a novel metabolic/immune regulator linking obesity to adipose tissue inflammation and insulin resistance.
Keywords: adipose tissue, inflammation, insulin resistance, macrophage, obesity
Introduction
Obesity is associated with chronic low-grade inflammation in fat depots (1, 2). Inflammatory cytokines, such as TNF-α, produced by adipose tissue macrophages promote insulin resistance by antagonizing insulin action (3–6). The recruitment and activation of adipose tissue macrophages in obesity, therefore, is an important contributor to the pathogenesis of obesity-linked metabolic dysfunction.
To discover novel metabolic regulators, we characterized a conserved family of secretory proteins of the C1q family, the C1q/TNF-related proteins (CTRP1–15)2 (7–15). We and others have shown that multiple CTRPs modulate energy metabolism in vivo by directly regulating glucose and fat metabolism in peripheral tissues (10, 14, 16–25), modulating food intake via a central mechanism (15, 26), or by indirectly modulating inflammatory processes in adipose tissue (27) or adipocyte differentiation (12).
Among the CTRP family, little is known about the function of CTRP6 (9). Recent studies have shown that CTRP6 regulates immune complement activation, and its deficiency exacerbates joint pathology in mouse models of rheumatoid arthritis (28). In vitro studies have highlighted a role for CTRP6 in regulating adipogenesis (29), fat oxidation (30), cytokine expression (31), and fibrogenesis (32). In mice, Ctrp6 is expressed in multiple tissues, including adipose tissue (9). Expression of Ctrp6 in the visceral (epididymal) adipose tissue is up-regulated in leptin-deficient ob/ob mice, a genetic model of severe obesity and insulin resistance (9). Conversely, the expression of Ctrp6 in ob/ob mice is down-regulated by the administration of rosiglitazone, an anti-diabetic drug (9). Mice lacking adiponectin, an insulin-sensitizing adipokine, also have higher serum levels of CTRP6 (9). A meta-analysis of genome-wide association studies also implicates human CTRP6/C1QTNF6 as a candidate gene that confers susceptibility to type 1 diabetes (33).
In the present studies, we aimed to uncover the metabolic role of CTRP6 using gain- and loss-of-function mouse models. We provide here the first genetic and physiological evidence that CTRP6 functions as a secreted regulator of glucose metabolism and inflammation in vivo.
Results
Increased adipose expression of CTRP6 in obesity
Similar to the mouse gene (9), human CTRP6 is relatively broadly expressed in adult tissues, including adipose tissue (Fig. 1A). To address whether adipose expression of CTRP6 is altered in human obesity, we measured its mRNA levels in visceral (omental) and subcutaneous fat depots. Expression of CTRP6 in both omental and subcutaneous fat depots was positively correlated with body mass index (BMI) (Fig. 1, B and C). Compared with lean controls, CTRP6 expression was strikingly up-regulated in both the visceral and subcutaneous fat depots of obese individuals with and without type 2 diabetes (Fig. 1, D and E).
Figure 1.
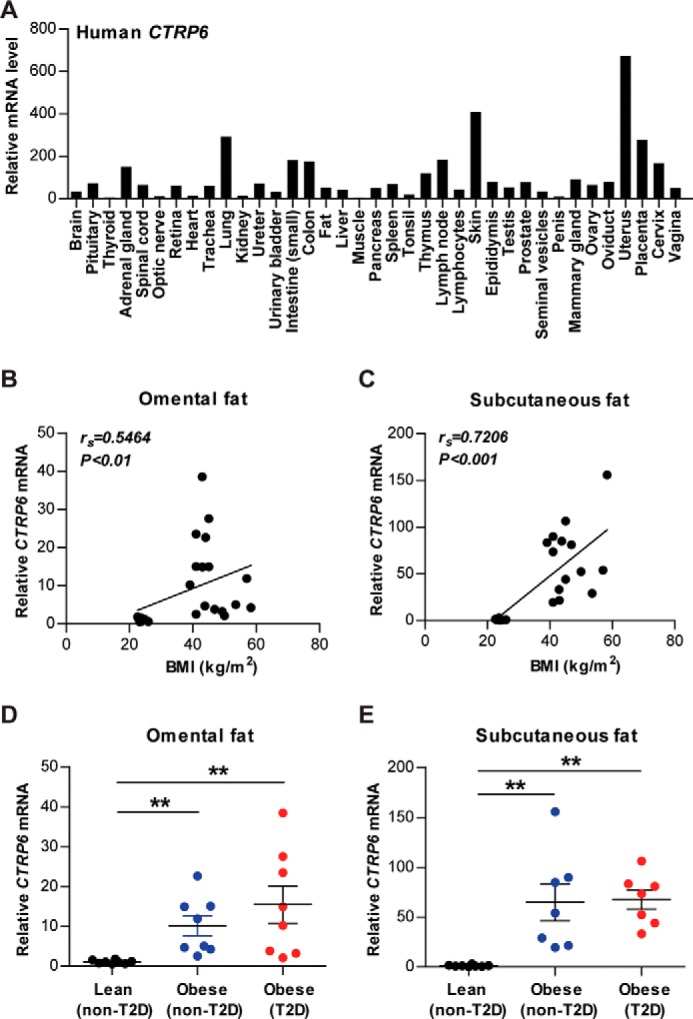
CTRP6 is broadly expressed in human tissues and up-regulated in obese humans. A, real-time PCR analysis of human CTRP6 expression in adult tissues using the TissueScanTM array (OriGene). Expression level of CTRP6 in each tissue was normalized to GAPDH (provided by the manufacturer). Expression in each tissue represents the average of pooled human samples to minimize individual variation. B–E, real-time PCR analysis of CTRP6 in omental and subcutaneous adipose tissue of human abdominal surgery subjects. Expression of CTRP6 in both fat depots is positively correlated with BMI (B and C). Expression levels of CTRP6 in both fat depots are significantly higher in obese individuals with or without type 2 diabetes relative to lean controls (D and E; n = 7–8/group). Expression levels were normalized to β-actin in each sample. **, p < 0.01. Error bars, S.E.
We next addressed whether our observations in humans hold true for diet-induced obese mouse models. Parallel to human data, expression of mouse Ctrp6 was significantly up-regulated in both the visceral (epididymal) and subcutaneous (inguinal) white adipose tissue of obese mice fed a high-fat diet (HFD) relative to lean controls fed a matched control low-fat diet (LFD) (Fig. 2A). Although Ctrp6 is also expressed in interscapular brown adipose tissue (BAT), its levels were not different between HFD-fed and LFD-fed mice (Fig. 2A).
Figure 2.

Ctrp6 expression is up-regulated in diet-induced obese (DIO) mouse models and in RAW264.7 macrophages exposed to high glucose. A, real-time PCR analysis of Ctrp6 expression in visceral eWAT, subcutaneous iWAT, and interscapular brown adipose tissue (BAT) from mice fed an LFD (n = 11) or an HFD (n = 11). B, real-time PCR analysis of Ctrp6 expression in isolated primary adipocytes (Adipo) and SVF cells from eWAT and iWAT of mice fed an LFD or HFD (n = 4/group). C, real-time PCR analysis of Ctrp6 in RAW264.7 macrophages exposed to low glucose (5.5 mm), low glucose + 19.5 mm mannitol (osmotic control), or low glucose + 19.5 mm glucose (high glucose, 25 mm) for 6, 24, and 48 h, respectively (n = 3/group). Expression levels were normalized to β-actin in each sample. *, p < 0.05; ***, p < 0.001. Error bars, S.E.
To identify which cell population within the fat depot contributes to changes in Ctrp6 expression in response to obesity, we examined Ctrp6 mRNA levels in isolated adipocytes and cells of the stromal vascular fraction (SVF). Whereas both adipocytes and SVF cells express Ctrp6 transcript, its expression was significantly higher in SVF cells in both visceral and subcutaneous fat depots of HFD-fed mice relative to LFD-fed controls (Fig. 2B). SVF contains immune cells, such as macrophages, as well as endothelial cells and smooth muscle cells. Given that large numbers of macrophages are known to infiltrate the fat pad in the obese state (1, 2), elevated CTRP6 in obesity could be produced by adipose tissue macrophages. In support of this finding, when cultured macrophages (RAW264.7) were exposed to high glucose, mimicking the diabetic state, expression of Ctrp6 was significantly induced (Fig. 2C). Mannitol is not metabolized by cells and thus serves as an osmotic control.
Increased energy expenditure in HFD-fed Ctrp6 KO mice
A genetic loss-of-function mouse model was used to interrogate the metabolic role of Ctrp6 (Fig. 3A). Two sets of primers were designed to amplify a sequence within intron 2 of the WT allele and a sequence spanning the downstream deletion site in the lacZ gene to confirm the genotype of WT and KO mice, respectively (Fig. 3B). As expected from targeted disruption of the gene, Ctrp6 mRNA was absent from epididymal white adipose tissue (eWAT), inguinal white adipose tissue (iWAT), liver, skeletal muscle, and primary bone marrow-derived macrophages (BMM) of KO mice (Fig. 3C). The Ctrp6 gene is not required for development, although it is expressed throughout embryogenesis (9). Ctrp6 KO mice were born at the expected Mendelian ratio and appeared normal with no gross developmental abnormalities.
Figure 3.

Generation of Ctrp6 KO mice. A, schematic showing the gene targeting strategy used to generate Ctrp6 KO mice. B, PCR genotyping results showing the successful generation of wild-type (WT; +/+), heterozygous (+/−), and homozygous knock-out (−/−) mice using the indicated primer pairs as shown in A. C, the absence of Ctrp6 mRNA in eWAT, iWAT, liver, skeletal muscle, and BMM of KO mice was confirmed by real-time PCR using primer pairs (Ctrp6-Ex2/3 forward and reverse) specific for Ctrp6. WT, n = 6; KO, n = 6. Error bars, S.E. ND, not detected.
To determine the contribution of CTRP6 to systemic energy metabolism in the normal and obese states, Ctrp6 WT and KO male mice were fed an HFD or a control LFD for 20 weeks, beginning at 4 weeks of age. On an LFD, we observed no differences in body weight, body composition (fat and lean mass), food intake, metabolic rate, energy expenditure, or physical activity level between Ctrp6 WT and KO mice (Fig. 4). When challenged with an HFD, Ctrp6 WT and KO mice also did not differ in body weight (Fig. 5A), body composition (Fig. 5B), or food intake (Fig. 5C). However, metabolic rate as measured by the rates of oxygen consumption (V̇O2) and carbon dioxide production (V̇CO2) were much higher in Ctrp6 KO mice compared with WT littermates (Fig. 5, D and E). Respiratory exchange ratios (RER) were not different between the two groups (Fig. 5F), indicating comparable oxidation of fat and carbohydrates as a fuel source. The increased metabolic rate seen in Ctrp6 KO mice also resulted in enhanced energy expenditure relative to WT controls (Fig. 5G). No differences, however, were observed in physical activity or postprandial thermogenesis (Fig. 5, H and I).
Figure 4.

No differences in metabolic rate and energy expenditure in Ctrp6 KO male mice fed an LFD. A, body weight of WT and KO mice fed an LFD over time. B, total fat and lean mass in WT and KO mice quantified by NMR (Echo-MRI) at 20 weeks of age. C, food intake in WT and KO mice (22 weeks of age) during the light and dark cycle. D–H, oxygen consumption (VO2), CO2 production (VCO2), RER, EE, and total activity were measured by CLAMS for WT and KO mice. VO2, VCO2, and EE data were normalized to lean body mass. WT, n = 8; KO, n = 9. Error bars, S.E.
Figure 5.

Increased metabolic rate and energy expenditure in Ctrp6 KO male mice fed an HFD. A, body weight of WT and KO mice fed an HFD over time. B, total fat and lean mass in WT and KO mice quantified by NMR (Echo-MRI) at 20 weeks of age. C, food intake in WT and KO mice (22 weeks of age) during the light and dark cycle. D–H, oxygen consumption (VO2), CO2 production (VCO2), RER, EE, and total activity were measured by CLAMS for WT and KO mice. VO2, VCO2, and EE data were normalized to lean body mass. For WT versus KO, *** indicates p < 0.001 (in D, E, and G); two-way ANOVA. I, rectal temperature of WT and KO mice. WT, n = 8; KO, n = 7. Error bars, S.E.
Reduced serum TNF-α, MCP-1, and blood monocytes in HFD-fed Ctrp6 KO mice
Diet-induced obesity is known to alter circulating adipokines and inflammatory cytokines. Loss of CTRP6 did not alter serum adiponectin and leptin levels in response to HFD (Fig. 6, A and B). In contrast, circulating pro-inflammatory cytokines, TNF-α and MCP-1, were significantly lower in Ctrp6 KO mice relative to WT littermates (Fig. 6, C and F). Serum IL-1β and IL-6 levels were not different between WT and KO mice (Fig. 6, D and E). Interestingly, white blood cell, especially monocyte, numbers were reduced in Ctrp6 KO mice (Fig. 6G). Two phenotypic and functional subsets of mature blood monocytes have been described: Ly6Chi and Ly6Clo (34, 35). The Ly6Chi blood monocytes are thought to be the source of macrophages that get recruited to sites of inflammation in tissues. The circulating levels of monocytes and neutrophils were assessed by flow cytometry (Fig. 6H). Ctrp6 KO mice have reduced Ly6Chi monocytes compared with WT mice (Fig. 6I). No differences were observed in Ly6Clo monocytes and neutrophils between the two groups (Fig. 6, J and K). These results suggest a better systemic inflammatory profile in CTRP6-deficient animals.
Figure 6.

Circulating levels of pro-inflammatory cytokines, adiponectin, leptin, and immune cells in Ctrp6 KO mice fed an HFD. A and B, serum adiponectin and leptin levels in WT and KO mice. C–F, serum TNF-α, IL-1β, IL-6, and MCP-1 in WT and KO mice. WT, n = 9; KO, n = 8. G, decreased total white blood cell count and monocytes in KO mice. WT, n = 8; KO, n = 6. H–K, circulating monocyte levels were assessed by flow cytometry by gating on all live CD11b+ cells. Representative pseudocolor flow cytometry plot of Ly6C expression in WT and KO mice. Shown is quantification of the percentage of circulating Ly6Chi monocytes (I), Ly6Clo monocytes (J), and neutrophils (K). WT, n = 6; KO, n = 8. *, p < 0.05; **, p < 0.01. Error bars, S.E.
Decreased adipose macrophage infiltration in HFD-fed Ctrp6 KO mice
We next determined whether local inflammatory profiles within adipose tissue differ between Ctrp6 WT and KO mice. Although adipose tissue weight was not different between WT and KO mice (Fig. 7A), histology revealed a striking reduction in adipose tissue macrophages infiltrating the visceral fat pad and their associated crownlike structures (Fig. 7, B and C). Crownlike structures consist of macrophages surrounding dying or dead adipocytes. When we examined the cell size distribution, WT mice had significantly greater numbers of small adipocytes (<500 μm2) corresponding to dead cells compared with Ctrp6 KO mice (Fig. 7D). In support of the histology data, mRNA expression of pro-inflammatory M1 macrophage marker genes Cd11c and TNF-α were markedly reduced in eWAT of Ctrp6 KO mice relative to WT controls (Fig. 7E). The expression of the pan-macrophage marker gene, F4/80, however, was not different between the two groups. These results suggest that CTRP6 deficiency dampens the local inflammatory milieu within adipose tissue in response to high-fat feeding.
Figure 7.

Reduced pro-inflammatory adipose tissue macrophages in Ctrp6 KO male mice fed an HFD. A, tissue wet weight of eWAT and iWAT from WT and KO mice. WT, n = 9; KO, n = 7. B and C, representative H&E staining for eWAT from WT and KO mice showing CLSs formed by the localization of macrophages around a single adipocyte, as indicated by an asterisk in the photographs. Scale bar, 100 μm. Quantification of crownlike structures is shown in B, and their presence was significantly reduced in KO mice compared with WT littermates. n = 4 mice/group. D, cell size distribution of adipocytes in eWAT of WT and KO mice. E, real-time PCR analysis of pan-macrophage marker gene (F4/80) and pro-inflammatory macrophage marker genes (Cd11c and TNF-α) in eWAT of WT and KO mice. Expression levels were normalized to β-actin levels in each sample. WT, n = 8; KO, n = 6. *, p < 0.05; **, p < 0.01. Error bars, S.E.
CTRP6 induces TNF-α production in macrophages
To determine whether reduced TNF-α expression in eWAT is causally linked to CTRP6, we treated cultured mouse macrophages (RAW264.7) with recombinant CTRP6 protein to test whether CTRP6 could directly induce TNF-α expression. With 6-h treatment, recombinant CTRP6 dose-dependently induced the mRNA expression and secreted protein levels of TNF-α (Fig. 8, A and B). Treatment of RAW264.7 macrophages with recombinant CTRP6 for a longer time course (24 h) had even stronger effects on inducing TNF-α mRNA and protein expression and secretion (Fig. 8, C and D). To further confirm these observations, we repeated the same experiments in cultured primary macrophages obtained from the bone marrow. A significant increase in TNF-α mRNA and protein expression and secretion was also observed in primary macrophages treated with recombinant CTRP6 for 24 h (Fig. 8, E and F). These results indicate that CTRP6 can directly modulate pro-inflammatory cytokine gene expression in macrophages and that its absence in the KO mice reduced TNF-α in eWAT in response to high-fat feeding.
Figure 8.
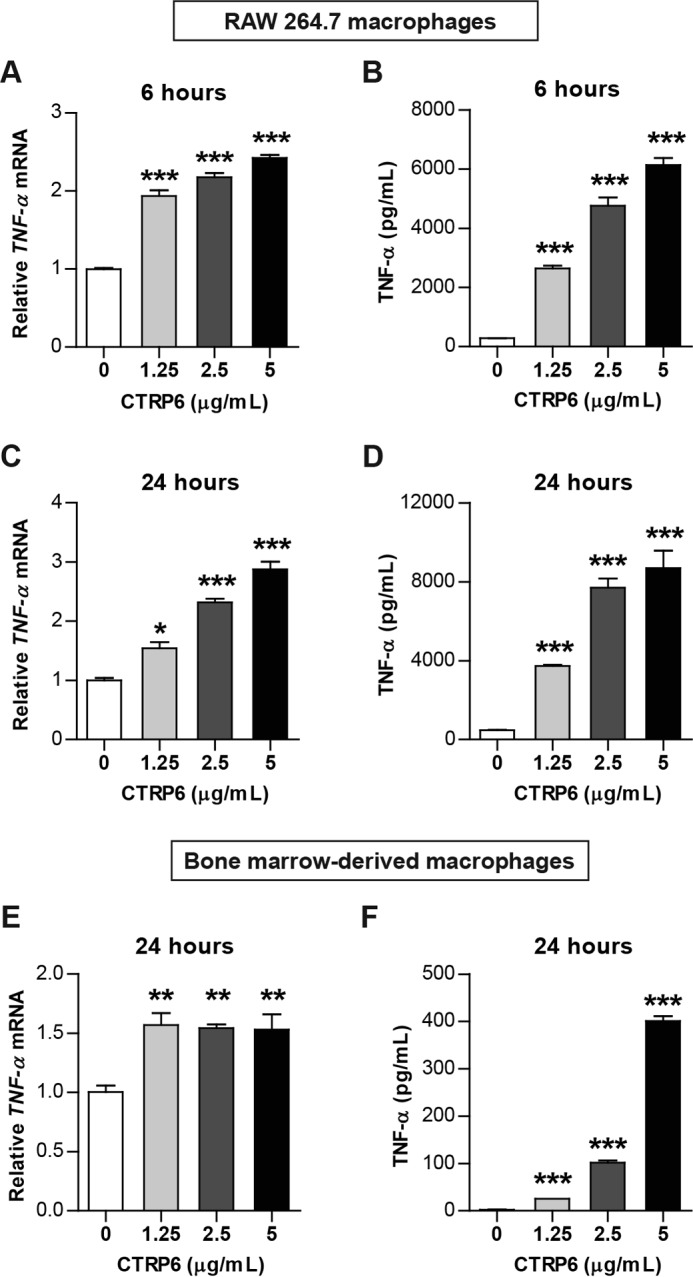
CTRP6 induces TNF-α expression and production in macrophages. A and B, increased TNF-α mRNA (A) and secreted protein (B) in RAW264.7 macrophage cell line treated with the indicated doses of recombinant CTRP6 for 6 h (n = 3/group). ***, p < 0.001 versus 0 μg/ml group. C and D, increased TNF-α mRNA (C) and secreted protein (D) in a macrophage cell line treated with the indicated doses of recombinant CTRP6 for 24 h (n = 3/group). E and F, increased TNF-α mRNA (E) and secreted protein (F) in primary BMM treated with the indicated doses of recombinant CTRP6 for 24 h (n = 4/group). *, p < 0.05; **, p < 0.01; ***, p < 0.001 versus control group. Error bars, S.E.
Altered insulin sensitivity in CTRP6-overexpressing and KO mice
We next sought to determine whether reduced adipose tissue inflammation in Ctrp6 KO mice affects systemic insulin sensitivity. When challenged with a bolus of insulin, the rate of insulin-stimulated glucose clearance in peripheral tissues was significantly greater in Ctrp6 KO mice compared with WT littermates (Fig. 9, A and B). Consistent with enhanced insulin sensitivity, the rate of glucose disposal in response to glucose infusion was also significantly greater in Ctrp6 KO mice (Fig. 9, C and D).
Figure 9.

Altered glucose and insulin tolerance in CTRP6-overexpressing and KO male mice. A–D, blood glucose levels at the indicated time points during ITT and GTT in WT and Ctrp6 KO mice fed an HFD. Area under the curve (AUC) was calculated and shown as a percentage in B and D. WT, n = 8; KO, n = 6. E, Western blot analysis of FLAG epitope-tagged mouse CTRP6 in serum from mice injected with expression plasmid encoding CTRP6 via the HTV injection method. Serum from mice expressing control pcDNA3.1 plasmid (Invitrogen) was used as a negative control. Western blotting was carried out using anti-FLAG M2 antibody (Sigma). F, to estimate the serum level of CTRP6 on day 1 after HTV injection, Western blotting was performed using purified protein as a standard with a 4-fold diluted serum sample. Band density was analyzed by ImageJ software. The level of CTRP6 in serum is ∼5.6 μg/ml. G–J, blood glucose levels at the indicated time points during ITT and GTT in chow-fed WT mice overexpressing pCDNA3 control plasmid (n = 9–10) or mouse CTRP6 (n = 9–10). AUC was calculated and shown as a percentage in H and J. K–N, blood glucose levels at the indicated time points during ITT and GTT in chow-fed WT mice overexpressing pCDNA3 control plasmid (n = 6) or human CTRP6 (n = 6). AUC was calculated and shown as a percentage in L and N. *, p < 0.05; **, p < 0.01. Error bars, S.E.
To determine whether CTRP6 could directly regulate insulin sensitivity independent of its effects on local inflammatory response within fat depots, we established a CTRP6 overexpression mouse model using hydrodynamic tail vein (HTV) injection (36). HTV injection of naked plasmid DNA is a simple, effective, and widely used method of in vivo gene delivery, leading to an overexpression of the encoded cDNA in liver (36). This method was used to induce mouse or human CTRP6 expression and secretion from the liver, enabling us to acutely increase the circulating levels of CTRP6 in mice to determine its metabolic consequences. First, we confirmed that the plasma levels of FLAG epitope-tagged mouse CTRP6 protein were significantly elevated on days 1 and 2 after plasmid injection (Fig. 9E). By using purified protein as standards, we were able to estimate the levels of CTRP6 protein on day 1 to be ∼5.6 μg/ml (Fig. 9F). Glucose and insulin tolerance tests were performed on day 2 in two separate cohorts of lean WT mice. Overexpressing mouse CTRP6 in non-diabetic lean mice reduced the rate of glucose clearance in response to insulin or glucose challenge (Fig. 9, G–J), indicating that CTRP6 has direct effects on insulin sensitivity in mice.
Human (NP_872292) and mouse (NP_082607) CTRP6 share 70 and 82% amino acid identity at the mature full-length protein and globular C1q domain, respectively. We next sought to determine whether human CTRP6 is functionally homologous to the mouse protein in the context of glucose metabolism. Overexpressing human CTRP6 in lean WT mice also significantly impaired glucose disposal in peripheral tissues in response to glucose challenge (Fig. 9, M and N). Insulin tolerance, however, was only minimally affected by human CTRP6 overexpression (Fig. 9, K and L). Together, these results indicate that CTRP6 has direct effects on glucose metabolism.
CTRP6 regulates glucose uptake and insulin signaling in adipocytes
Consistent with the glucose and insulin tolerance data, insulin-stimulated Akt phosphorylation, a metric of insulin signaling, was enhanced in the adipose tissue of CTRP6-deficient mice (Fig. 10, A and B). Conversely, insulin-stimulated Akt phosphorylation in adipose tissue was reduced in mice overexpressing CTRP6 (Fig. 10C). Based on these results, we next determined whether CTRP6 acts directly on adipocytes. We treated mature mouse 3T3-L1 adipocytes with recombinant CTRP6 protein and performed a glucose uptake assay and found that CTRP6 treatment significantly reduced insulin-stimulated glucose uptake in adipocytes (Fig. 10F). In accordance with the functional readout, CTRP6 treatment also decreased Akt phosphorylation in adipocytes (Fig. 10, D and E).
Figure 10.

CTRP6 modulates insulin-stimulated Akt phosphorylation. A, Western blot analysis of insulin-stimulated Akt phosphorylation (Ser-473) in eWAT of WT (n = 3) and Ctrp6 KO (n = 3) male mice fed an HFD. B, quantification of phosphorylated to total Akt ratio as shown in A using ImageJ software. C, Western blot analysis of insulin-stimulated Akt phosphorylation in eWAT of mice injected with control pcDNA3.1 plasmid or mouse CTRP6. D, insulin-stimulated Akt phosphorylation in 3T3-L1 adipocytes stimulated with vehicle control (n = 3) or 5 μg/ml recombinant mouse CTRP6 (n = 3). E, quantification of phosphorylated to total Akt ratio as shown in D. F, insulin-stimulated glucose uptake in 3T3-L1 adipocytes pretreated with vehicle control (n = 4) or 5 μg/ml recombinant mouse CTRP6 (n = 4) for 36 h. *, p < 0.05; **, p < 0.01. Error bars, S.E.
Discussion
Prior to this study, the in vivo metabolic role of CTRP6 was uncertain. We provide here the first physiological evidence, using gain- and loss-of-function mouse models, establishing CTRP6 as a novel secreted regulator of systemic glucose metabolism through both autocrine and paracrine action to modulate insulin sensitivity and pro-inflammatory responses within adipose tissue.
Several novel and important findings were noted among our results. CTRP6 expression in obesity is conserved between humans and mice, highlighting the clinical relevance of the studies and the usefulness of mouse models in understanding the function of CTRP6 in a disease context. In obese humans, with or without type 2 diabetes, the expression of CTRP6 is strikingly up-regulated in both the visceral (omental; ∼10–15-fold) and subcutaneous (∼65–70-fold) fat depots relative to lean controls. In a dietary mouse model of obesity, the expression of Ctrp6 is likewise significantly up-regulated in both the visceral (epididymal) and subcutaneous (inguinal) fat depots. The major source of Ctrp6 in the context of obesity is SVF cells, such as macrophages, within the fat pad. Large numbers of macrophages are known to infiltrate the adipose compartment in the obese state (1, 2, 37). Ctrp6 is indeed expressed in cultured macrophages (RAW264.7) and was significantly up-regulated when cells were exposed to high glucose mimicking the diabetic state. These observations, coupled with our previous findings (9) showing down-regulation of Ctrp6 expression by the anti-diabetic drug rosiglitazone in a genetic model of severe obesity (leptin-deficient ob/ob), suggest a functionally relevant role for CTRP6 within adipose tissue. Two limitations, however, are noted. First, despite robust changes in CTRP6 between obese individuals and lean controls, the sample size for each group was small; further confirmation in a larger cohort of human samples is warranted. Second, whether changes in mRNA levels seen in tissue and cells correspond to changes in secreted protein levels remains to be determined. Technical limitations precluded the quantification of plasma CTRP6 levels. To date, no ELISA exists that can reliably quantify CTRP6 protein in humans or mice whose specificity can be validated in the Ctrp6 KO mice.
In the non-obese state when mice were fed a control low-fat diet, the Ctrp6 gene was largely dispensable for whole-body metabolic control. None of the metabolic parameters measured (body weight and composition, food intake, metabolic rate, or physical activity) were different between Ctrp6 WT and KO male mice. Whether this holds true for female mice remains to be determined, because they were not included in the study. Despite comparable physical activity, loss of CTRP6 significantly enhanced whole-body metabolic rate and energy expenditure, as indicated by increased oxygen consumption and CO2 production. No shift in substrate (carbohydrate versus fat) fuel usage was noted in the respiratory exchange ratio of WT or Ctrp6 KO mice. Rectal temperatures between the two groups of mice also did not differ, suggesting that increased energy expenditure was not due to enhanced thermogenesis. Whereas leptin has previously been shown to increase skeletal muscle fat oxidation (38), its circulating levels were not different between Ctrp6 WT and KO mice. Thus, the underlying mechanism by which CTRP6 affects whole-body energy expenditure remains to be elucidated.
Two other major phenotypes were noted in the CTRP6 loss-of-function mouse model. In the absence of CTRP6, obesity-linked local and systemic inflammatory response was significantly dampened. Circulating levels, as well as local adipose expression, of inflammatory cytokines (e.g. TNF-α) were markedly reduced in CTRP6-deficient mice fed an HFD. The numbers of circulating Ly6Chi monocytes and pro-inflammatory macrophages that infiltrated adipose tissue in response to high-fat feeding were also greatly reduced in CTRP6-deficient animals. In the obese state, chronic low-grade inflammation within the fat compartment promoted adipocyte cell death; the number of these apoptotic adipocytes (<500 μm2) was notably less in CTRP6-deficient mice (6 versus 19% in WT). Apoptotic adipocytes are surrounded by macrophages, forming the crownlike structures (39). The number of quantified crownlike structures was ∼4 times less in the Ctrp6 KO adipose tissue compared with WT controls. Reduced local and systemic inflammatory response probably contributed, at least in part, to the improvement in insulin sensitivity seen in HFD-fed Ctrp6 KO mice relative to WT controls.
Given that adipose tissue macrophages are a likely source of CTRP6 in the context of obesity, we addressed whether CTRP6 could act in an autocrine manner to affect macrophage inflammatory response. Indeed, in an established mouse macrophage cell line and primary macrophages, recombinant CTRP6 treatment markedly induced the expression and secretion of TNF-α in a dose-dependent manner, suggesting that macrophages are likely targets of CTRP6 within the fat pad. Given the known paracrine role of TNF-α in impairing adipocyte insulin sensitivity (3, 40), the autocrine action of macrophage-derived CTRP6 may amplify the inflammatory response within adipose tissue in the context of obesity. Future studies involving transplanting WT and CTRP6-deficient bone marrow cells into mice will provide further evidence that macrophage-derived CTRP6 is indeed causally linked to adipose tissue inflammation and insulin resistance.
Interestingly, in a chicken type-II collagen-induced rheumatoid arthritis mouse model, loss of CTRP6 exacerbates inflammatory joint pathology due to a greater infiltration of B220+ B-cells into the synovium (28). Conversely, intraarticular injection of recombinant human CTRP6 reverses the arthritic phenotype. CTRP6 was found to suppress the alternative complement pathway by competing with factor B for C3 binding. For the rheumatoid arthritis mouse model, only female mice were used due to their greater propensity to develop inflammatory joint disease. In our current metabolic studies, only male mice were utilized due to their greater propensity to develop obesity and glucose intolerance. Thus, depending on sex and pathophysiological context, CTRP6 may play either protective or adverse roles. Another example of context-dependent roles is adiponectin, a beneficial insulin-sensitizing adipokine that appears to play an adverse role in inflammatory joint disease (41).
The improvements in insulin action in Ctrp6 KO mice, as indicated by enhanced glucose and insulin tolerance, are also partly attributable to the direct action of CTRP6 on adipocytes. In an established 3T3-L1 adipocyte cell model, recombinant CTRP6 treatment reduced insulin-stimulated Akt phosphorylation, a metric of insulin-induced signaling; this correlated with a functional reduction in insulin-stimulated glucose uptake. Consistent with the in vitro data, mice overexpressing CTRP6 had reduced Akt phosphorylation in adipose tissue and impaired insulin-stimulated glucose disposal. Conversely, loss of CTRP6 enhanced insulin-stimulated Akt phosphorylation in adipose tissue and augmented insulin-stimulated glucose uptake in peripheral tissues.
Based on our findings, we propose a model for CTRP6 function in the context of obesity (Fig. 11). Diet-induced obesity promotes the recruitment of pro-inflammatory macrophages into the fat pad, and subsequently, infiltrated adipose tissue macrophages produce and secrete CTRP6, as well as other pro-inflammatory cytokines. In an autocrine manner, CTRP6 further stimulates and augments the production of pro-inflammatory cytokines (e.g. TNF-α) in adipose tissue. In a paracrine manner, CTRP6 acts on adipocytes to antagonize insulin signaling. These autocrine and paracrine actions of CTRP6 promote and exacerbate a chronic state of low-grade inflammation within the fat compartment, leading to dampening of insulin sensitivity in adipocytes. Thus, strategies aimed at antagonizing CTRP6 action may confer beneficial clinical outcomes in the context of obesity and insulin resistance.
Figure 11.
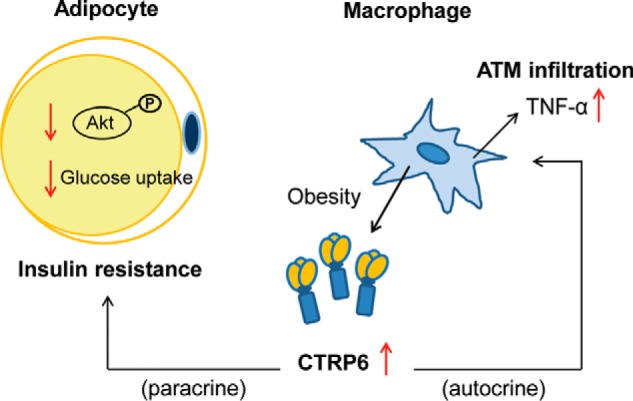
Model of CTRP6 function in obesity. Diet-induced obesity up-regulates the expression and production of CTRP6 from pro-inflammatory macrophages that infiltrate the adipose tissue. Secreted CTRP6 could act in an autocrine manner to induce pro-inflammatory TNF-α expression and production from macrophages that in turn led to chronic low-grade inflammation in the fat depots. The secreted CTRP6 could also act in a paracrine manner to promote insulin resistance in adipocytes by dampening insulin-stimulated Akt phosphorylation and glucose uptake. ATM, adipose tissue macrophages.
Experimental procedures
Human tissue samples
Human CTRP6/C1QTNF6 expression profiling was performed using the TissueScanTM human major tissue qPCR array (OriGene); tissue samples were pooled from multiple individuals. Visceral (omental) and subcutaneous adipose tissues were obtained from the Adipose Biology Core of the National Institutes of Health-funded Mid-Atlantic Nutrition Obesity Research Center at the University of Maryland. Study protocols were approved by the Institutional Review Board for Human Subjects Research at the University of Maryland. Informed consent was obtained from all human subjects. Type 2 diabetes (T2D) is defined in subjects with a hemoglobin A1c value of ≥6.5% according to World Health Organization criteria. Characteristics of the lean (non-T2D), obese (non-T2D), and obese with T2D individuals have been described previously (23).
Mouse models
To generate the diet-induced obesity model, 6-week-old C57BL/6J male mice were fed an HFD (60% kcal derived from fat, D12492; Research Diets) or a matched control LFD (10% kcal derived from fat, D12450B; Research Diets) for 8 weeks. The Ctrp6 KO mouse strain used for this project, B6;129S5-C1qtnf6tm1Lex/Mmucd (stock number 031616-UCD), was obtained from the Mutant Mouse Regional Resource Center and was donated to the Mutant Mouse Regional Resource Center by Genentech, Inc. To generate Ctrp6 KO mice, parts of exon 2 and intron 2 (396 bp on chromosome 15) were replaced with a targeting cassette containing a β-galactosidase reporter gene, lacZ. Genotyping primers for the Ctrp6 WT allele were P-18 (5′-GATGTCCTCTGATGATACGG-3′) and P-19 (5′-CCACATTTTGGATTCCAGGG-3′). The expected size of the WT band was 351 bp. Primers for the KO allele were Neo3A (5′-GCAGCGCATCGCCTTCTATC-3′) and P-19. The expected size of the KO band was 263 bp. Real-time PCR was used to confirm the absence of Ctrp6 mRNA resulting from the deletion of the Ctrp6 gene. Primers used were Ctrp6-Ex2/3-F (5′-TTATGTCCTGCCTGAAGTCAGGCCG-3′) and Ctrp6-Ex2/3-R (5′-CAGAGAAGGCTGAGTAATGTGTCTG-3′). Ctrp6 KO mice were initially generated on a mixed (129/Sv × C57BL/6) genetic background. We backcrossed the mice onto a C57BL/6J genetic background for >6 generations. For each cohort of mice, at least 10 breeding pairs (one heterozygous male and two heterozygous female mice) were set up at the same time. Only homozygous KO mice (−/−) and WT littermates (+/+) with close date of birth were used in our experiments. Body weights of Ctrp6 WT and KO male mice were measured weekly. Body temperature was measured by a rectal probe thermometer (BAT-12, Physitemp). All mice were housed in polycarbonate cages under a 12-h/12-h light/dark photocycle and had access to water ad libitum throughout the study period. All animal experiments were approved by the Animal Care and Use Committee of The Johns Hopkins University School of Medicine.
Isolation of adipocytes and SVF cells from fat pad
Visceral (epididymal; eWAT) and subcutaneous (inguinal; iWAT) white adipose tissue were harvested from C57BL/6J male mice fed an LFD or HFD for 8 weeks. Isolated adipose tissues were minced and incubated with 1 mg/ml collagenase type II (Life Technologies, Inc.) at 37 °C with gentle agitation for 1 h. The cell suspension was then passed through a 100-μm cell strainer (Thermo Fisher Scientific) and centrifuged at 200 × g for 1 min. The floating mature adipocytes were collected. The remaining cell suspension was centrifuged at 500 × g for 10 min. The pelleted cells (SVF) were resuspended in ACK Lysing Buffer (Quality Biological Inc.), incubated at room temperature for 3 min, and centrifuged at 500 × g for 5 min. For mRNA isolation, adipocytes and SVF were resuspended in TRIzol® reagent (Life Technologies).
RNA isolation and quantitative real-time PCR
Total RNA was isolated from tissue or cells using TRIzol® reagent, and 2 μg of RNA were reverse transcribed using GoScriptTM reverse transcriptase (Promega). 2 ng/μl cDNA from each sample was used in real-time PCR analysis, using SYBR Green PCR master mix on a CFX ConnectTM system (Bio-Rad). Results were analyzed using the 2−ΔΔCT method (42). Primer sequences are listed in Table 1.
Table 1.
Primers for real-time PCR
| Gene | Forward (5′–3′) | Reverse (5′–3′) |
|---|---|---|
| Human CTRP6 | GAAAGGGTCTTTGTGAACCTTGA | CTGCGCGTACAGGATGACAG |
| Human β-actin | CCTCGCCTTTGCCGATCC | CGCGGCGATATCATCATC |
| Mouse Ctrp6 | ATCACAGACATGGGCCAAGG | TCAACTCACAGACCCCGGAC |
| Mouse β-actin | AGTGTGACGTTGACATCCGTA | GCCAGAGCAGTAATCTCCTTCT |
| F4/80 | CCCCAGTGTCCTTACAGAGTG | GTGCCCAGAGTGGATGTCT |
| Cd11c | CTGGATAGCCTTTCTTCTGCTG | GCACACTGTGTCCGAACTCA |
| TNF-α | ATGCTGGGACAGTGACCTGG | CCTTGATGGTGGTGCATGAG |
Body composition analysis
Body composition of Ctrp6 WT and KO mice (20 weeks old) was determined using a quantitative NMR instrument (Echo-MRI-100, Echo Medical Systems LLC) at The Johns Hopkins University School of Medicine mouse phenotyping core facility. Echo-MRI analyses measure total fat mass, lean mass, and water content.
Indirect calorimetry
Ctrp6 WT and KO mice fed an HFD for 22 weeks were used for simultaneous assessments of daily body weight change, food intake (corrected for spillage), physical activity, and whole-body metabolic profile in an open flow indirect calorimeter (CLAMS (Comprehensive Laboratory Animal Monitoring System), Columbus Instruments). Data were collected for 3 days to confirm that mice were acclimated to the calorimetry chambers (indicated by stable body weights, food intake, and diurnal metabolic patterns), and data were analyzed from the fourth day. Rates of oxygen consumption (V̇O2) and carbon dioxide production (V̇CO2) in each chamber were measured throughout the studies. RER (V̇CO2/V̇O2) was calculated by CLAMS software (version 4.02) to estimate relative oxidation of carbohydrates (RER = 1.0) versus fats (RER = 0.7), not accounting for protein oxidation. Energy expenditure (EE) was calculated as EE = V̇O2 × (3.815 + (1.232 × RER)). V̇O2, V̇CO2, and EE data were also normalized to lean body mass. Physical activities were measured by infrared beam breaks in the metabolic chamber. Average metabolic values were calculated per subject and averaged across subjects for statistical analysis.
Blood chemistry analysis
For complete blood count, blood samples from the lateral saphenous vein were collected from 20-week-old mice and analyzed at The Johns Hopkins University School of Medicine mouse phenotyping core facility. For cytokine analysis, blood samples were allowed to clot on ice and then centrifuged for 10 min at 10,000 × g. Serum samples were aliquoted and stored at −80 °C. Serum adiponectin (R&D Systems), leptin (Millipore), TNF-α (Millipore), IL-1β (R&D Systems), IL-6 (Millipore), and MCP-1 (R&D Systems) were measured by ELISA according to the manufacturer's instructions.
Flow cytometry
Blood samples from the lateral saphenous vein were collected in EDTA-coated tubes (Microvette® 100 K3E, Sarstedt AG Co., Nümbrecht, Germany) from 20-week-old mice. 100 μl of whole blood sample were incubated for 30 min with fluorophore-conjugated antibodies: Ly6C-FITC (eBioscience) and CD11b-PE-Cy7 (eBioscience). Then 2 ml of 1× 1-step Fix/Lyse Solution (eBioscience) were added and incubated at 4 °C overnight. After washing three times with FACS buffer (PBS, 0.5% BSA, 0.1% NaN3), blood cells were analyzed using an LSRII machine in the Ross flow cytometry core facility. All data were analyzed using FlowJo software.
Histology and analysis of crownlike structures (CLSs) of adipose tissue
After WT and KO mice (40 weeks old) were anesthetized with isoflurane, eWAT and iWAT were removed and weighed. Formalin-fixed, paraffin-embedded eWAT was stained with H&E at The Johns Hopkins University School of Medicine Reference Histology Laboratory. Images were captured with an Axioplan upright microscope with an Axiocam color CCD camera (Carl Zeiss Microscopy). To quantify the CLSs, an RGB image (1378 μm × 1091.8 μm) with a set scale of 1000 pixels = 1060 μm was used. CLSs were identified as clusters of macrophages that had infiltrated the adipose tissue and formed ringlike structures. The number of CLSs was manually counted in five random fields for each section. Four mice in each group were sectioned and counted. Adipocyte size in Ctrp6 WT and KO mice was determined using ImageJ software from H&E-stained images of eWAT.
Recombinant CTRP6 production
Recombinant full-length mouse CTRP6 (mCTRP6) and human CTRP6 (hCTRP6), containing a C-terminal FLAG epitope tag (DYKDDDDK), was produced in HEK 293 cells (GripTiteTM, Invitrogen). First, cells were transfected with the expression plasmid (pcDNA-mCTRP6 or pcDNA-hCTRP6) using 1 mg/ml PEI (Polysciences, Inc.). Supernatants (Opti-MEM medium) from transfected cells were then collected and subjected to affinity chromatography using an anti-FLAG M2 affinity gel (Sigma) according to the manufacturer's protocol. Purified protein was dialyzed against 20 mm HEPES (pH 8.0) containing 135 mm NaCl and concentrated with a 10-kDa cut-off Amicon Ultra-15 centrifugal filter unit (Millipore). Protein concentration was determined using Bradford reagent (Sigma), and samples were aliquoted and stored at −80 °C.
Macrophage cell culture
BMM were isolated from the femurs of WT or KO mice and cultured on Petri dishes in RPMI 1640 medium supplemented with 20% FBS, 10 ng/ml recombinant macrophage colony-stimulating factor (eBioscience), 1% penicillin/streptomycin, and 2 mm l-glutamine. Differentiated cells were collected on day 7 for RNA extraction. Mouse RAW264.7 macrophages (ATCC) were cultured in DMEM (Invitrogen) supplemented with 10% FBS (Atlanta Biologicals) and antibiotics. Cells were treated with low-glucose (5.5 mm) DMEM, low-glucose DMEM with 19.5 mm mannitol (osmotic control), or high-glucose (25 mm) DMEM with 0.2% BSA for 6, 24, and 48 h, respectively. For the 48-h incubation period, we changed the medium once at 24 h to keep the glucose level high in the medium. After treatment, cells were washed with PBS and used for RNA extraction. For CTRP6 treatment, cells were treated with HEPES vehicle control or different doses of purified CTRP6 protein in DMEM with 0.2% BSA for 6 and 24 h, respectively. Similarly, BMM obtained from WT mice were plated on day 7 and treated with control or CTRP6 protein in RPMI 1640 with 0.2% BSA for 24 h. Supernatant was collected to measure TNF-α by ELISA (Millipore). Cells were then washed with PBS and used for RNA extraction.
HTV injection
Mammalian expression plasmids pcDNA3.1 (control), pcDNA-mCTRP6, and pcDNA-hCTRP6 were delivered into mice by HTV injection (36). After induction of anesthesia with ketamine (80 mg/kg) and xylazine (6 mg/kg), 10-week-old mice (weighing 20–25 g) were put into the mouse tail illuminator (Braintree Scientific, Inc.); the bottom side of the tail was warmed by light for 5 min to dilate the vein. Tail vein injection was carried out using a 27-gauge, 0.5-inch needle (BD Pharmingen, catalogue no. 305109). To achieve hydrodynamics-based gene transfer to the liver, 180 μg of plasmid dissolved in 2.0–2.5 ml (10% of body weight) normal saline was injected into mice via tail vein in 5–10 s. Several days after successful injection, blood was collected, and the presence of epitope-tagged CTRP6 protein in serum was confirmed by Western blotting using anti-FLAG M2 antibody (Sigma).
Glucose and insulin tolerance tests
HFD-fed Ctrp6 KO mice and WT littermates (19–20-week-old mice), as well as WT mice injected (HTV) with pcDNA control or CTRP6 constructs, were subjected to intraperitoneal glucose tolerance tests (GTT) and insulin tolerance tests (ITT). For GTT, mice were fasted overnight before injection with glucose (1 g/kg body weight). For ITT, food was removed 2 h before insulin injection (1 units/kg). Blood glucose was measured at the indicated time points using a glucometer (BD Pharmingen). To examine insulin signaling in adipose tissue, mice were injected with insulin (1 units/kg); 15 min after insulin delivery, eWAT was quickly removed and snap-frozen in liquid nitrogen for protein extraction.
3T3-L1 adipocyte cell culture
Mouse 3T3-L1 cells were cultured in DMEM (Invitrogen) supplemented with 10% FBS and penicillin/streptomycin (Thermo Fisher Scientific). Two days after cells reached confluence, adipocyte differentiation was induced with DMEM supplemented with 0.5 mm methylisobutylxanthine, 1 μm dexamethasone, and 4 μg/ml insulin for 3 days and 4 μg/ml insulin for an additional 2 days. Cells were then maintained in DMEM (with 10% FBS) for an additional 3 days, by which time >90% of the cells differentiated into mature adipocytes laden with lipid droplets. For the glucose uptake assay, adipocytes were treated with vehicle or CTRP6 (5 μg/ml) in DMEM with 0.2% BSA for 36 h. After cells were serum-starved in low-glucose DMEM for 2 h, they were treated with insulin (100 nm) for 20 min. The cells were then incubated with uptake medium containing 0.5 curies/ml 2-deoxy-d-[1-14C]glucose in Krebs–Ringer–HEPES buffer (25 mm HEPES–NaOH, pH 7.4, 120 mm NaCl, 5 mm KCl, 1.2 mm MgSO4, 1.3 mm CaCl2, 1.3 mm KH2PO4) supplemented with 0.5% BSA for 10 min. Uptake was stopped by aspirating the medium and extensive washing with ice-cold PBS. The cells were then lysed with lysis buffer (20 mm Tris–HCl, 150 mm NaCl, 1 mm EDTA, 0.5% Nonidet P-40, and 10% glycerol). Radioactivity of cell lysates was counted in an Ecoscint scintillation mixture (National Diagnostics) using a Beckman LS-6000 liquid scintillation counter. An aliquot of cell lysate from each sample was obtained for protein content analysis using a BCA assay kit (Pierce). Radioactivity in each sample was normalized against protein content. For the insulin signaling study, cells were treated with CTRP6 and stimulated with insulin as in the glucose uptake assay, and then cells were washed with PBS and lysed with lysis buffer containing PhosSTOP phosphatase inhibitor mixture (Roche Applied Science) and protease inhibitor mixture (Sigma). Cell lysates were used for Western blot analyses using anti-phospho-Akt (Ser-473; CST, catalog no. 4060) and anti-Akt (CST, catalog no. 9272) antibodies. Band intensities in blot images were quantified using ImageJ software.
Statistical analysis
Spearman's correlation coefficient analysis was used to analyze the associations between adipose expression of CTRP6 and BMI. Kruskal–Wallis analysis of variance with pairwise comparisons was used to determine differences among the three groups (lean, obese without T2D, and obese with T2D). Two-way ANOVA was used to compare differences of body weight over time between WT and KO mice. Other comparisons were made using either a two-tailed Student's t test for two groups or one-way ANOVA for multiple groups. Values reported are means ± S.E. p < 0.05 was considered statistically significant.
Author contributions
G. W. W. and X. L. conceived and coordinated the study and wrote the paper. X. L., M. M. S., H. C. L., and N. C. performed and analyzed the experiments. T. K. provided technical and intellectual input on the project. All authors reviewed the results and approved the final version of the manuscript.
Acknowledgment
We thank Susan Aja for help with indirect calorimetry.
This work was supported by National Institutes of Health Grant DK084171 (to G. W. W.) and American Heart Association post-doctoral fellowship POST17070119 (to X. L.). The authors declare that they have no conflicts of interest with the contents of this article. The content is solely the responsibility of the authors and does not necessarily represent the official views of the National Institutes of Health.
- CTRP
- C1q/TNF-related protein
- BMI
- body mass index
- HFD
- high-fat diet
- LFD
- low-fat diet
- SVF
- stromal vascular fraction
- eWAT
- epididymal white adipose tissue
- iWAT
- inguinal white adipose tissue
- BMM
- bone marrow-derived macrophage(s)
- RER
- respiratory exchange ratio(s)
- HTV
- hydrodynamic tail vein
- T2D
- type 2 diabetes
- EE
- energy expenditure
- CLS
- crownlike structure
- mCTRP6
- mouse CTRP6
- hCTRP6
- human CTRP6
- GTT
- glucose tolerance test(s)
- ITT
- insulin tolerance test(s)
- ANOVA
- analysis of variance
- AUC
- area under the curve.
References
- 1. Xu H., Barnes G. T., Yang Q., Tan G., Yang D., Chou C. J., Sole J., Nichols A., Ross J. S., Tartaglia L. A., and Chen H. (2003) Chronic inflammation in fat plays a crucial role in the development of obesity-related insulin resistance. J. Clin. Invest. 112, 1821–1830 [DOI] [PMC free article] [PubMed] [Google Scholar]
- 2. Weisberg S. P., McCann D., Desai M., Rosenbaum M., Leibel R. L., and Ferrante A. W. Jr. (2003) Obesity is associated with macrophage accumulation in adipose tissue. J. Clin. Invest. 112, 1796–1808 [DOI] [PMC free article] [PubMed] [Google Scholar]
- 3. Hotamisligil G. S., Shargill N. S., and Spiegelman B. M. (1993) Adipose expression of tumor necrosis factor-α: direct role in obesity-linked insulin resistance. Science 259, 87–91 [DOI] [PubMed] [Google Scholar]
- 4. Uysal K. T., Wiesbrock S. M., Marino M. W., and Hotamisligil G. S. (1997) Protection from obesity-induced insulin resistance in mice lacking TNF-α function. Nature 389, 610–614 [DOI] [PubMed] [Google Scholar]
- 5. Moller D. E. (2000) Potential role of TNF-α in the pathogenesis of insulin resistance and type 2 diabetes. Trends Endocrinol. Metab. 11, 212–217 [DOI] [PubMed] [Google Scholar]
- 6. Hotamisligil G. S. (1999) Mechanisms of TNF-α-induced insulin resistance. Exp. Clin. Endocrinol. Diabetes 107, 119–125 [DOI] [PubMed] [Google Scholar]
- 7. Wong G. W., Wang J., Hug C., Tsao T. S., and Lodish H. F. (2004) A family of Acrp30/adiponectin structural and functional paralogs. Proc. Natl. Acad. Sci. U.S.A. 101, 10302–10307 [DOI] [PMC free article] [PubMed] [Google Scholar]
- 8. Wong G. W., Krawczyk S. A., Kitidis-Mitrokostas C., Ge G., Spooner E., Hug C., Gimeno R., and Lodish H. F. (2009) Identification and characterization of CTRP9, a novel secreted glycoprotein, from adipose tissue that reduces serum glucose in mice and forms heterotrimers with adiponectin. FASEB J. 23, 241–258 [DOI] [PMC free article] [PubMed] [Google Scholar]
- 9. Wong G. W., Krawczyk S. A., Kitidis-Mitrokostas C., Revett T., Gimeno R., and Lodish H. F. (2008) Molecular, biochemical and functional characterizations of C1q/TNF family members: adipose-tissue-selective expression patterns, regulation by PPAR-gamma agonist, cysteine-mediated oligomerizations, combinatorial associations and metabolic functions. Biochem. J. 416, 161–177 [DOI] [PMC free article] [PubMed] [Google Scholar]
- 10. Wei Z., Peterson J. M., Lei X., Cebotaru L., Wolfgang M. J., Baldeviano G. C., and Wong G. W. (2012) C1q/TNF-related protein-12 (CTRP12), a novel adipokine that improves insulin sensitivity and glycemic control in mouse models of obesity and diabetes. J. Biol. Chem. 287, 10301–10315 [DOI] [PMC free article] [PubMed] [Google Scholar]
- 11. Wei Z., Peterson J. M., and Wong G. W. (2011) Metabolic regulation by C1q/TNF-related protein-13 (CTRP13): activation OF AMP-activated protein kinase and suppression of fatty acid-induced JNK signaling. J. Biol. Chem. 286, 15652–15665 [DOI] [PMC free article] [PubMed] [Google Scholar]
- 12. Wei Z., Seldin M. M., Natarajan N., Djemal D. C., Peterson J. M., and Wong G. W. (2013) C1q/tumor necrosis factor-related protein 11 (CTRP11), a novel adipose stroma-derived regulator of adipogenesis. J. Biol. Chem. 288, 10214–10229 [DOI] [PMC free article] [PubMed] [Google Scholar]
- 13. Peterson J. M., Wei Z., and Wong G. W. (2009) CTRP8 and CTRP9B are novel proteins that hetero-oligomerize with C1q/TNF family members. Biochem. Biophys. Res. Commun. 388, 360–365 [DOI] [PubMed] [Google Scholar]
- 14. Seldin M. M., Peterson J. M., Byerly M. S., Wei Z., and Wong G. W. (2012) Myonectin (CTRP15), a novel myokine that links skeletal muscle to systemic lipid homeostasis. J. Biol. Chem. 287, 11968–11980 [DOI] [PMC free article] [PubMed] [Google Scholar]
- 15. Byerly M. S., Petersen P. S., Ramamurthy S., Seldin M. M., Lei X., Provost E., Wei Z., Ronnett G. V., and Wong G. W. (2014) C1q/TNF-related protein 4 (CTRP4) is a unique secreted protein with two tandem C1q domains that functions in the hypothalamus to modulate food intake and body weight. J. Biol. Chem. 289, 4055–4069 [DOI] [PMC free article] [PubMed] [Google Scholar]
- 16. Peterson J. M., Aja S., Wei Z., and Wong G. W. (2012) C1q/TNF-related protein-1 (CTRP1) enhances fatty acid oxidation via AMPK activation and ACC inhibition. J. Biol. Chem. 287, 1576–1587 [DOI] [PMC free article] [PubMed] [Google Scholar]
- 17. Peterson J. M., Seldin M. M., Tan S. Y., and Wong G. W. (2014) CTRP2 overexpression improves insulin and lipid tolerance in diet-induced obese mice. PLoS One 9, e88535. [DOI] [PMC free article] [PubMed] [Google Scholar]
- 18. Peterson J. M., Seldin M. M., Wei Z., Aja S., and Wong G. W. (2013) CTRP3 attenuates diet-induced hepatic steatosis by regulating triglyceride metabolism. Am. J. Physiol. Gastrointest. Liver Physiol. 305, G214–G224 [DOI] [PMC free article] [PubMed] [Google Scholar]
- 19. Peterson J. M., Wei Z., Seldin M. M., Byerly M. S., Aja S., and Wong G. W. (2013) CTRP9 transgenic mice are protected from diet-induced obesity and metabolic dysfunction. Am. J. Physiol. Regul. Integr. Comp. Physiol. 305, R522–R533 [DOI] [PMC free article] [PubMed] [Google Scholar]
- 20. Peterson J. M., Wei Z., and Wong G. W. (2010) C1q/TNF-related protein-3 (CTRP3), a novel adipokine that regulates hepatic glucose output. J. Biol. Chem. 285, 39691–39701 [DOI] [PMC free article] [PubMed] [Google Scholar]
- 21. Seldin M. M., Lei X., Tan S. Y., Stanson K. P., Wei Z., and Wong G. W. (2013) Skeletal muscle-derived myonectin activates the mTOR pathway to suppress autophagy in liver. J. Biol. Chem. 288, 36073–36082 [DOI] [PMC free article] [PubMed] [Google Scholar]
- 22. Wei Z., Lei X., Petersen P. S., Aja S., and Wong G. W. (2014) Targeted deletion of C1q/TNF-related protein 9 increases food intake, decreases insulin sensitivity, and promotes hepatic steatosis in mice. Am. J. Physiol. Endocrinol. Metab. 306, E779–E790 [DOI] [PMC free article] [PubMed] [Google Scholar]
- 23. Lei X., Rodriguez S., Petersen P. S., Seldin M. M., Bowman C. E., Wolfgang M. J., and Wong G. W. (2016) Loss of CTRP5 improves insulin action and hepatic steatosis. Am. J. Physiol. Endocrinol. Metab. 310, E1036–E1052 [DOI] [PMC free article] [PubMed] [Google Scholar]
- 24. Rodriguez S., Lei X., Petersen P. S., Tan S. Y., Little H. C., and Wong G. W. (2016) Loss of CTRP1 disrupts glucose and lipid homeostasis. Am. J. Physiol. Endocrinol. Metab. 311, E678–E697 [DOI] [PMC free article] [PubMed] [Google Scholar]
- 25. Petersen P. S., Lei X., Wolf R. M., Rodriguez S., Tan S. Y., Little H. C., Schweitzer M. A., Magnuson T. H., Steele K. E., and Wong G. W. (2017) CTRP7 deletion attenuates obesity-linked glucose intolerance, adipose tissue inflammation, and hepatic stress. Am. J. Physiol. Endocrinol. Metab. 312, E309–E325 [DOI] [PMC free article] [PubMed] [Google Scholar]
- 26. Byerly M. S., Swanson R., Wei Z., Seldin M. M., McCulloh P. S., and Wong G. W. (2013) A central role for C1q/TNF-related protein 13 (CTRP13) in modulating food intake and body weight. PLoS One 8, e62862. [DOI] [PMC free article] [PubMed] [Google Scholar]
- 27. Enomoto T., Ohashi K., Shibata R., Higuchi A., Maruyama S., Izumiya Y., Walsh K., Murohara T., and Ouchi N. (2011) Adipolin/C1qdc2/CTRP12 functions as an adipokine that improves glucose metabolism. J. Biol. Chem. 286, 34552–34558 [DOI] [PMC free article] [PubMed] [Google Scholar]
- 28. Murayama M. A., Kakuta S., Inoue A., Umeda N., Yonezawa T., Maruhashi T., Tateishi K., Ishigame H., Yabe R., Ikeda S., Seno A., Chi H. H., Hashiguchi Y., Kurata R., Tada T., et al. (2015) CTRP6 is an endogenous complement regulator that can effectively treat induced arthritis. Nat. Commun. 6, 8483. [DOI] [PMC free article] [PubMed] [Google Scholar]
- 29. Wu W. J., Mo D. L., Zhao C. Z., Zhao C., Chen Y. S., Pang W. J., and Yang G. S. (2015) Knockdown of CTRP6 inhibits adipogenesis via lipogenic marker genes and Erk1/2 signalling pathway. Cell Biol. Int. 39, 554–562 [DOI] [PubMed] [Google Scholar]
- 30. Lee W., Kim M. J., Park E. J., Choi Y. J., and Park S. Y. (2010) C1qTNF-related protein-6 mediates fatty acid oxidation via the activation of the AMP-activated protein kinase. FEBS Lett. 584, 968–972 [DOI] [PubMed] [Google Scholar]
- 31. Kim M. J., Lee W., Park E. J., and Park S. Y. (2010) C1qTNF-related protein-6 increases the expression of interleukin-10 in macrophages. Mol. Cells 30, 59–64 [DOI] [PubMed] [Google Scholar]
- 32. Fan R. H., Zhu X. M., Sun Y. W., Peng H. Z., Wu H. L., and Gao W. J. (2016) CTRP6 inhibits fibrogenesis in TGF-β1-stimulated human dermal fibroblasts. Biochem. Biophys. Res. Commun. 475, 356–360 [DOI] [PubMed] [Google Scholar]
- 33. Cooper J. D., Smyth D. J., Smiles A. M., Plagnol V., Walker N. M., Allen J. E., Downes K., Barrett J. C., Healy B. C., Mychaleckyj J. C., Warram J. H., and Todd J. A. (2008) Meta-analysis of genome-wide association study data identifies additional type 1 diabetes risk loci. Nat. Genet. 40, 1399–1401 [DOI] [PMC free article] [PubMed] [Google Scholar]
- 34. Sunderkötter C., Nikolic T., Dillon M. J., Van Rooijen N., Stehling M., Drevets D. A., and Leenen P. J. (2004) Subpopulations of mouse blood monocytes differ in maturation stage and inflammatory response. J. Immunol. 172, 4410–4417 [DOI] [PubMed] [Google Scholar]
- 35. Gordon S., and Taylor P. R. (2005) Monocyte and macrophage heterogeneity. Nat. Rev. Immunol. 5, 953–964 [DOI] [PubMed] [Google Scholar]
- 36. Zhang G., Budker V., and Wolff J. A. (1999) High levels of foreign gene expression in hepatocytes after tail vein injections of naked plasmid DNA. Hum. Gene Ther. 10, 1735–1737 [DOI] [PubMed] [Google Scholar]
- 37. Harman-Boehm I., Blüher M., Redel H., Sion-Vardy N., Ovadia S., Avinoach E., Shai I., Klöting N., Stumvoll M., Bashan N., and Rudich A. (2007) Macrophage infiltration into omental versus subcutaneous fat across different populations: effect of regional adiposity and the comorbidities of obesity. J. Clin. Endocrinol. Metab. 92, 2240–2247 [DOI] [PubMed] [Google Scholar]
- 38. Minokoshi Y., Kim Y. B., Peroni O. D., Fryer L. G., Müller C., Carling D., and Kahn B. B. (2002) Leptin stimulates fatty-acid oxidation by activating AMP-activated protein kinase. Nature 415, 339–343 [DOI] [PubMed] [Google Scholar]
- 39. Murano I., Barbatelli G., Parisani V., Latini C., Muzzonigro G., Castellucci M., and Cinti S. (2008) Dead adipocytes, detected as crown-like structures, are prevalent in visceral fat depots of genetically obese mice. J. Lipid Res. 49, 1562–1568 [DOI] [PubMed] [Google Scholar]
- 40. Hotamisligil G. S., Arner P., Caro J. F., Atkinson R. L., and Spiegelman B. M. (1995) Increased adipose tissue expression of tumor necrosis factor-α in human obesity and insulin resistance. J. Clin. Invest. 95, 2409–2415 [DOI] [PMC free article] [PubMed] [Google Scholar]
- 41. Ehling A., Schäffler A., Herfarth H., Tarner I. H., Anders S., Distler O., Paul G., Distler J., Gay S., Schölmerich J., Neumann E., and Müller-Ladner U. (2006) The potential of adiponectin in driving arthritis. J. Immunol. 176, 4468–4478 [DOI] [PubMed] [Google Scholar]
- 42. Schmittgen T. D., and Livak K. J. (2008) Analyzing real-time PCR data by the comparative C(T) method. Nat. Protoc. 3, 1101–1108 [DOI] [PubMed] [Google Scholar]