

Abstract
Sorafenib (Nexavar) is a broad-spectrum multikinase inhibitor that proves effective in treating advanced renal-cell carcinoma and liver cancer. Despite its well-characterized mechanism of action on several established cancer-related protein kinases, sorafenib causes variable responses among human tumors, although the cause for this variation is unknown. In an unbiased screening of an oncology drug library, we found that sorafenib activates recruitment of the ubiquitin E3 ligase Parkin to damaged mitochondria. We show that sorafenib inhibits the activity of both complex II/III of the electron transport chain and ATP synthase. Dual inhibition of these complexes, but not inhibition of each individual complex, stabilizes the serine-threonine protein kinase PINK1 on the mitochondrial outer membrane and activates Parkin. Unlike the protonophore carbonyl cyanide m-chlorophenylhydrazone, which activates the mitophagy response, sorafenib treatment triggers PINK1/Parkin-dependent cellular apoptosis, which is attenuated upon Bcl-2 overexpression. In summary, our results reveal a new mechanism of action for sorafenib as a mitocan and suggest that high Parkin activity levels could make tumor cells more sensitive to sorafenib's actions, providing one possible explanation why Parkin may be a tumor suppressor gene. These insights could be useful in developing new rationally designed combination therapies with sorafenib.
Keywords: apoptosis, mitochondria, mitophagy, parkin, PTEN-induced putative kinase 1 (PINK1)
Introduction
Targeted therapies have changed the landscape of advanced cancer treatment in part due to the fact they exhibit fewer yet more mechanism-based toxicities compared with conventional cytotoxic drugs (1). Cancer is recognized as a heterogeneous disease defined by different genetic and epigenetic changes. The efficacy of targeted drugs is strongly influenced by the specific molecular alterations in the tumor. Sorafenib (Nexavar), a broad-spectrum multikinase inhibitor drug, has been proven to be effective in treating advanced renal-cell carcinoma and liver cancer (2). Despite its well-characterized mechanism of action on several bona fide cancer-related protein kinases, the variable responses to this drug among human tumors are still poorly understood (3). Hence, there is a need to identify and characterize cell signaling pathways that are regulated by sorafenib and influence its cytostatic responses in tumor cells.
Parkin was initially identified as a gene implicated in autosomal recessive juvenile parkinsonism (4). Mutation in the Parkin gene and PINK1 are known to be associated with early-onset familial autosomal recessive Parkinson's disease (4). Parkin, a member of the RING-IBR-RING family of ubiquitin E3 ligases, works in tandem with PINK1, a mitochondrial serine-threonine protein kinase to control mitochondrial homeostasis in response to cellular stress signaling (5). The current paradigm suggests that if the mitochondrial membrane potential is intact, the serine-threonine kinase PINK1 is rapidly imported into the mitochondria and undergoes degradation via mitochondrial proteases followed by proteasomal degradation (5). If the mitochondrial membrane potential is dissipated, PINK1 accrues on the outer mitochondrial membrane in its 63-kDa full-length isoform to recruit cytosolic Parkin, an E3 ubiquitin ligase, which ubiquitylates numerous OMM proteins, including VDAC, Miro, and Mfn1, leading to autophagosome engulfment of the ubiquitin-tagged depolarized mitochondria and subsequent lysosomal degradation, i.e. mitophagy (5–9). Although depolarization of mitochondria triggers mitophagy, milder mitochondrial damage caused by relatively low levels of oxidative stress can be repaired through a recently discovered new pathway known as mitochondrion-derived vesicles (MDVs)3 (9). MDVs are 70–100-nm vesicles budded from damaged mitochondria and containing oxidized cargoes; they are transported to lysosomes to clear partially damaged mitochondrial components. Oxidative stress can activate PINK1 and elicit the formation of MDVs, which requires PINK1 and Parkin activities (9). Thus, tandem PINK1 and Parkin activities are required for both mitochondrial eliminations by mitophagy or mitochondrial repair by MDV formation. Exactly how PINK1/Parkin mediates a mutually exclusive cell-fate decision in response to different levels of cellular stress is unknown.
Besides the well-documented association of PINK1 and Parkin in neurodegenerative diseases (10), this pathway has also been linked to pathogenesis of other human diseases. In particular, Parkin has been implicated as a tumor suppressor protein (11–15). Parkin is located on the long arm of chromosome 6, a segment that has long been known to be altered or deleted in a wide variety of human cancers (16). Loss of the parkin gene has been reported in a subset of human CRC, HCC, and glioblastoma samples (14, 15). Parkin knock-out mice had enhanced hepatocyte proliferation and developed macroscopic hepatic tumors with the characteristics of hepatocellular carcinoma and resistance to apoptosis induced by cisplatin, doxorubicin, and etoposide (12). These studies suggest that Parkin is a tumor suppressor gene and that loss of Parkin may be associated with acquired chemoresistance in tumor cells.
In an unbiased effort to identify differential chemosensitivity of FDA-approved oncology drugs in HeLa cells with or without Parkin expression, we discovered that sorafenib induces cell death in a Parkin-dependent manner. To determine the mechanism of the accelerated Parkin-dependent cell death response, we discovered that sorafenib treatment induces rapid depolarization of mitochondria, stabilization of PINK1 on the outer mitochondrial membrane, and Parkin recruitment to the mitochondria. Activation of PINK1/Parkin is attributed to sorafenib's inhibitory activity against complex II/III and complex V of the electron transport chain. Parkin targets Bcl-2 family protein Mcl-1 for degradation. Parkin-dependent apoptosis induced by sorafenib can be reduced by overexpression of Bcl-2. Thus, sorafenib treatment can trigger PINK1/Parkin-dependent apoptosis according to the expression level of Bcl-2. These results may help inform the design of rationalized drug combination strategies that could enhance sorafenib anti-tumor activity depending on the status of the PINK1/Parkin pathway.
Results
Sorafenib induces mitochondrial relocalization of Parkin
Previous studies have shown that Parkin relocates from cytosol to outer mitochondrial membrane in response to treatment with the protonophore CCCP or the potassium ionophore valinomycin but not rotenone or paraquat (17). Our previous studies with HeLa cells stably expressing Venus–Parkin and RFP–Smac mitochondrial targeting signal (MTS) demonstrated that CCCP and valinomycin trigger different cellular responses (18). To further investigate differential cellular responses mediated by different chemicals, we performed a high content screening for Parkin mitochondrial recruitment response with the FDA-approved oncology drug set (http://dtp.nci.nih.gov/branches/dscb/oncology_drugset_explanation.html) (supplemental Table 1). HeLa cells expressing RFP–Smac and Venus–Parkin–WT were treated with 20 μm compounds, and images of RFP–Smac and Venus–Parkin were collected at 1.5, 3, and 8 h using an HCS microscope ImageXpress (Molecular Devices). Parkin mitochondrial recruitment was quantified by a Transfluor–Co-localization Application Module (supplemental Fig. 1, A–C), which scores the relative co-localization efficiency of Parkin with mitochondria. As a control, HeLa cells stably expressing RFP–Smac–MTS and Venus–Parkin–T240R, a patient-derived Parkin mutation that is defective in mitochondrial recruitment, were also screened at the same conditions. The only condition that was capable of activating wild-type Parkin from the screen was treatment of sorafenib. The effect of sorafenib on Parkin recruitment is specific, as Parkin T240R does not show mitochondrial recruitment under the same treatment.
To further characterize Parkin mitochondrial recruitment, we compared the sorafenib response to that of the well-established trigger chemical, CCCP. As shown in Fig. 1, A and B, both 10 μm CCCP and 20 μm sorafenib could trigger Parkin to mitochondria. Time-course studies showed Parkin translocation to mitochondria triggered by sorafenib is slower than that triggered by CCCP (70-min delay), but it reaches maximum levels at about 2 h (Fig. 1C and supplemental Movie 1). Different doses of sorafenib were also tested in a time-course experiment, and the result showed that the Parkin mitochondrial translocation induced by 25 μm sorafenib is comparable with 10 μm CCCP (supplemental Movie 1).
Figure 1.
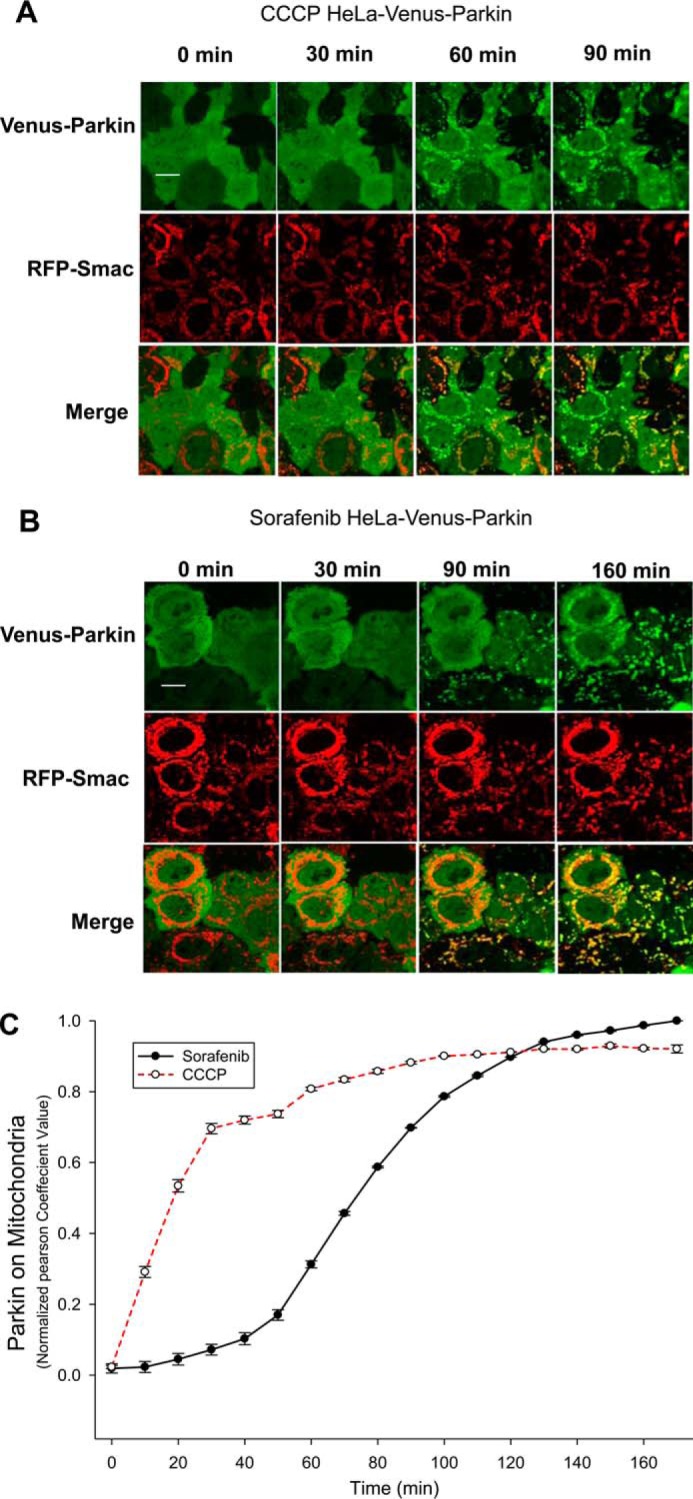
Sorafenib induces Parkin mitochondrial relocalization in HeLa cells. A–C, HeLa cells expressing RFP–Smac–MTS and Venus–Parkin were treated with 10 μm CCCP (A) or 20 μm sorafenib (B) for 90 and 160 min, respectively. Both CCCP and sorafenib trigger Parkin mitochondrial recruitment. Scale bar, 10 μm. C, quantification of A and B was performed by Pearson co-localization algorithm using MATLAB.
Sorafenib-induced Parkin mitochondrial relocalization is PINK1-dependent
To test whether the sorafenib-induced Parkin localization to mitochondria is PINK1-dependent, we expressed Venus–Parkin in PINK1 knock-out (PINK1−/−) MEF cells. No Parkin mitochondrial translocation was detectable up to 40 μm sorafenib treatment. However, when a human PINK1 was introduced into this cell line, Venus–Parkin was rapidly recruited to damaged mitochondria in the presence of sorafenib (Fig. 2, A and C). Immunoblotting verified that sorafenib treatment induced PINK1 accumulation and Parkin auto-ubiquitination in MEF cells (Fig. 2B), indicating that sorafenib activates the PINK1/Parkin pathway in MEF cells.
Figure 2.

Sorafenib induces Parkin mitochondrial relocalization and activation in a PINK1-dependent manner. A, PINK1 knock-out (PINK1−/−) MEF cells stably expressing human Venus–Parkin alone or human Venus–Parkin plus hPINK1 were treated with sorafenib (40 μm). Mitochondrial localization of Venus–Parkin is observed in the PINK1-positive MEF but not PINK1-null cell line. Scale bar, 10 μm. B, Parkin activation by sorafenib treatment in MEF cells indicated by immunoblotting (IB) analysis. The slow migrating band in the Parkin blot corresponds to the Ser-65-phosphorylated and -monoubiquitinylated (Ub) Parkin. Ezrin was used as a loading control. C, time course of Venus–Parkin recruitment to mitochondria upon treatment with sorafenib. At each time, the fraction of cells (%) that have Parkin puncta was quantified and plotted. Error bars, standard deviations. D, sorafenib induced Parkin phosphorylation at Ser-65. HeLa cell expression of wild-type or Parkin S65A mutant was treated with 20 μm sorafenib for the indicated time and blotted with the Parkin antibody. GAPDH was used as a loading control. E, phosphorylation of Parkin Ser-65 is required for sorafenib-induced Parkin activation. HeLa cells expressing RFP–Smac and Venus–Parkin–WT or mTurquoise–ParkinS65A were treated with 20 μm sorafenib for the indicated time. Parkin mitochondrial recruitment is perturbed by Ser65 mutation. F, HeLa cells expressing both Venus–Parkin and mTurquoise–ParkinS65A were treated with sorafenib for the indicated time, and mitochondrial recruitment was measured. Scale bar, 10 μm. G and H, quantitation of Parkin mitochondrial recruitment at 2 h following sorafenib treatment. (n = 6; *, p < 0.0001, Student's unpaired t test.)
We have previously shown that PINK1 triggers autocatalytic activation of Parkin through phosphorylation at Ser-65 of the Ubl domain upon treatment with CCCP (18). To determine whether sorafenib has a similar effect on Parkin activation, we treated HeLa cells stably expressing RFP–Smac–MTS with Venus–Parkin–WT, mTurquoise–ParkinS65A, or both with 20 μm sorafenib. Immunoblotting showed that sorafenib only induced significant ubiquitination bands with wild-type Venus–Parkin but not with mTurquoise–ParkinS65A in 2 h (Fig. 2D). mTurquoise–ParkinS65A mitochondrial recruitment was ineffective as compared with the wild-type Parkin (Fig. 2E), suggesting PINK1 phosphorylation is required for Parkin activation. However, when Venus–Parkin–WT and mTurquoise–ParkinS65A were co-expressed together in HeLa cells, sorafenib could trigger both proteins to mitochondria (Fig. 2, F–H). These data suggest Parkin is activated by an autocatalytic mechanism by sorafenib in a similar manner to CCCP.
Sorafenib stabilizes PINK1 on the outer mitochondrial membrane and elevates PINK1 expression
Because PINK1 is required for sorafenib to induce Parkin mitochondrial recruitment, we next determined the effects of sorafenib on PINK1 expression and mitochondrial localization. First, we investigated whether sorafenib affects PINK1 expression by immunoblot in HeLa cells. As shown in Fig. 3A, sorafenib treatment induced a time-dependent increase in the endogenous PINK1 levels in HeLa cells. The induction occurred as early as 1 h after sorafenib addition. PINK1–EGFP when stably expressed in HeLa cells also increased upon sorafenib exposure (Fig. 3B). This result suggests that elevation of PINK1 is most likely due to a post-transcriptional mechanism. Human PINK1 that is ectopically expressed in PINK1-null MEF cells showed a similar increase with sorafenib treatment (data not shown). Sorafenib-dependent PINK1 elevation was observed in several cell lines, including 293 and DLD1, suggesting that sorafenib-induced PINK1 elevation is well conserved in multiple cell lines and is likely to be a general phenomenon.
Figure 3.
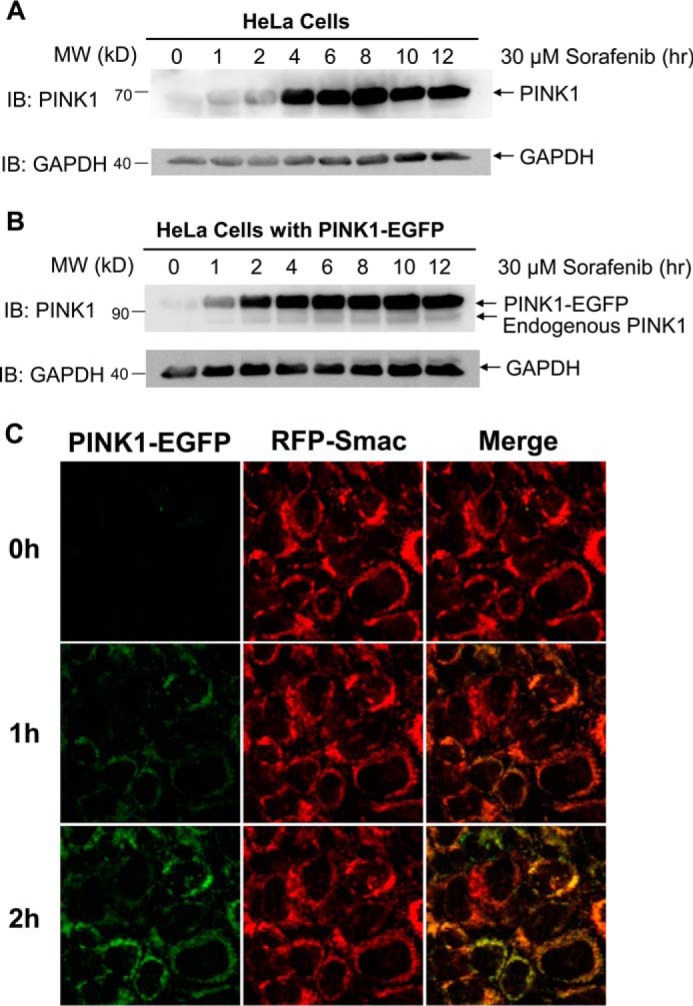
Sorafenib stabilizes the endogenous PINK1 and ectopically expressing PINK1–EGFP. A, HeLa cells treated with 30 μm sorafenib for the indicated times were blotted with the PINK1 and GAPDH antibodies. B, time course of PINK1–EGFP induction in HeLa cells stably expressing PINK1–EGFP upon exposure to 30 μm sorafenib for indicated time. C, live cell imaging of PINK1–EGFP in HeLa cells treated with 30 μm sorafenib for 3.5 h. IB, immunoblot.
To determine whether sorafenib promotes PINK1 mitochondrial accumulation, we performed time-lapse imaging analysis of HeLa cells expressing PINK1–EGFP and RFP–Smac–MTS in the presence of 25 μm sorafenib. As shown in Fig. 3C, the level of PINK1–EGFP underwent a steady increase until it leveled off at 2 h. Taken together, these results indicate that sorafenib stabilizes PINK1 on the outer membrane of mitochondria, which is responsible for subsequent Parkin mitochondrial accumulation.
Dual inhibition of complex II/III of ETC and complex V by sorafenib is sufficient to activate Parkin recruitment to mitochondria
Parkin mitochondrial recruitment induced by CCCP has been attributed to depolarization of the mitochondrial membrane (19). To test whether sorafenib also triggers mitochondrial depolarization, HeLa cells were first labeled by a mitochondrial membrane potential chemical probe, tetramethylrhodamine methyl ester (TMRE), and exposed to DMSO, 10 μm CCCP, or 20 μm sorafenib individually for 40 min. DMSO-treated cells showed a slight decrease in TMRE fluorescence over the time of the treatment. As expected, CCCP treatment caused a rapid decrease in fluorescence signal. Sorafenib exposure has a similar effect to CCCP, suggesting that sorafenib causes a loss of mitochondrial potential (Fig. 4A). As a proton ionophore, CCCP dissipates the proton gradient across the inner membrane of mitochondria. Sorafenib is not known to be an ionophore, but inhibition of electron transport chain (ETC) could cause loss of ΔΨm. To test whether sorafenib inhibits ETC, we measured flavin adenine dinucleotide (FAD) autofluorescence by live-cell confocal microscopy in the presence or absence of sorafenib or antimycin A, a known inhibitor of complex III followed by addition of CCCP (Fig. 4B). CCCP induces a sharp rise in FAD autofluorescence signal at 535 nm due to maximized respiration and oxidization of FADH2 with the uncoupling of ETC. Inhibition of complex III by antimycin A blocks electron transport and FADH2 electron loss thereby suppressing the FAD autofluorescence signal. Short exposure to sorafenib resulted in a similar suppression of FAD production, suggesting sorafenib may be an inhibitor of electron transport chain.
Figure 4.


Sorafenib inhibits both complex II/III and complex V and causes rapid depolarization of mitochondrial membrane potential. A, mitochondrial membrane potential of HeLa cells was measured using the chemical probe TMRE. Cells were treated with DMSO, 10 μm CCCP, and 20 μm sorafenib for 40 min. The mitochondrial membrane potential was quantified by measuring the TMRE intensity over the 40-min time course. Both CCCP and sorafenib treatments cause rapid loss of mitochondrial membrane potential, although no significant change was observed for DMSO treatment. B, sorafenib inhibits mitochondrial electron transport activity. Cells growing on a glass bottom 96-well plate were scanned for 2 min with 454 nm excitation wavelength, and emission between 505 and 550 nm was collected to establish the baseline autofluorescence for normalization. Cells were treated with either DMSO, 20 μm sorafenib, or 10 μm antimycin A and scanned for 2 min prior to the addition of 1 μm of CCCP and scanned for an additional 2 min. Relative FAD autofluorescence for each treatment was plotted. Error bars indicate standard deviation. C–F, activities of sorafenib against mitochondrial complex I-V in vitro using the methods described under “Experimental procedures.” Negative control (DMSO), positive control, and sorafenib were tested for inhibition at the indicated doses, and relative activity of each measurement was plotted. Error bars indicate standard deviation. A Student's unpaired t test was performed to determine the significance of the observed inhibitory activity of the compounds. The p values for each test are as follows: complex I, DMSO versus rotenone p = 0.005; DMSO versus sorafenib p = 0.1807. Complex II/III, DMSO versus antimycin p = 0.0091; DMSO versus sorafenib p = 0.0065. Complex IV, DMSO versus KCN p = 0.017; DMSO versus sorafenib p = 0.1375. Complex V, DMSO versus oligomycin p = 1.81 × 10⁻⁵; DMSO versus sorafenib p = 1.47 × 10⁻⁴. G and H, dose-response inhibitory activity of sorafenib toward complex II/III and complex V. IC50 values were calculated in MATLAB by fitting dose-response curves. I, dual inhibition of complex II/III and complex V is necessary and sufficient to activate Parkin mitochondrial recruitment. HeLa Venus–Parkin/RFP–Smac cells were treated with indicated concentrations of negative control (DMSO), positive control (CCCP, 10 μm), sorafenib (20 μm), antimycin (10 μm), oligomycin (2.5 μm), or antimycin + oligomycin at a dose of 10 and 2.5 μm for 2 h and imaged. Hoechst 33258 was used to count cell nuclei. J, quantification of Parkin mitochondrial recruitment by Pearson co-localization algorithm using MATLAB. Error bars, standard deviations. K, quantitative measurement of the mitochondrial membrane potential using TMRE in HeLa cells treated with negative control (DMSO), positive control (CCCP, 10 μm), sorafenib (20 μm), antimycin (10 μm), oligomycin (2.5 μm), KCN (10 μm), KCN + oligomycin (10 and 2.5 μm), or antimycin + oligomycin (10 and 2.5 μm) at a dose of 10 μm for 3 h. Images were taken every 5 min. Error bars, standard deviations.
To identify the mitochondrial targets of sorafenib, we systematically measured the inhibitory activity of sorafenib toward all electron transport chain complexes and complex V using immuno-captured complexes on the microplate or isolated mitochondria (complex II/III). As shown in Fig. 4, sorafenib showed inhibition of complex II/III and complex V at 20 μm and little if any activity against complex I and complex IV (Fig. 4, C–F). The inhibitory activity of sorafenib toward complex II/III and complex V was further evaluated through dose-response analysis. The IC50 values are ∼10 and ∼2.5 μm for complex II/III and complex V, respectively (Fig. 4, G and H).
To elucidate the significance of dual inhibition of ETC by sorafenib in activating PINK1–Parkin, we tested well-established selective inhibitors of ETC individually on Parkin recruitment and found that none of them can activate Parkin at 10 μm, which is in agreement with previous results (17). For example, neither antimycin A, a complex II/III inhibitor, nor oligomycin, a complex V inhibitor, alone triggers Parkin mitochondrial recruitment (Fig. 4, I and J). However, when antimycin A was added together with oligomycin, a robust Parkin localization was observed. This result suggests that sorafenib is essentially the sum of antimycin plus oligomycin, and activation of PINK1–Parkin is most likely due to dual inhibition of complex II/III and complex V.
Next, we determined the effects of sorafenib or a combination of ETC complex inhibitors on the mitochondrial membrane potentials. As shown in Fig. 4J, CCCP or sorafenib alone caused a rapid reduction in TMRE fluorescence, indicative of Δψm loss. As expected, oligomycin alone resulted in hyperpolarization of the mitochondrial membrane potential due to the reduction of proton flow through complex V. KCN alone caused a minor reduction in TMRE signal, and antimycin at 10 μm caused a moderate reduction in TMRE (Fig. 4K). However, the combination of antimycin and oligomycin resulted in a signal loss similar to CCCP or sorafenib. Combination of KCN with oligomycin also resulted in significant TMRE signal loss. However, this combination does not activate Parkin mitochondrial recruitment (Fig. 4I). Collectively, our results suggest that sorafenib or antimycin plus oligomycin most likely causes depolarization of mitochondrial membrane potential via dual inhibition of complex II/III and V, which subsequently engenders PINK1 stabilization at mitochondrial outer membrane and Parkin recruitment. Although depolarization of mitochondrial membrane potential is necessary for activation of this pathway, loss of Δψm is not sufficient to cause robust pathway activation.
Sorafenib induces PINK1/Parkin-dependent apoptosis
Because the PINK1/Parkin pathway has been shown to mediate distinct cellular outcomes in response to different stress stimuli (18), we tested the effect of sorafenib exposure on cell fate determination in HeLa cells stably expressing Venus–Parkin–WT, RFP–Smac–MTS, and CFP–LC3 (18). In agreement with previous results, CCCP treatment induced Parkin mitochondrial accumulation followed by mitophagy as determined by mitochondrial clustering and CFP–LC3 mitochondrial co-localization (Fig. 5, A, C, and D and supplemental Movie 2). In contrast, sorafenib treatment elicited a strong apoptotic response, quantified by RFP–Smac–MTS release from mitochondria, i.e. mitochondrial outer membrane permeability (MOMP) (Fig. 5, B–D, and supplemental Movie 2). Independently, we also measured sorafenib-induced apoptosis response by Hoechst 33258 fluorescence using an automated MetaXpress application module (supplemental Fig. 2, A and B). Increased nuclei condensation state as seen by Hoechst staining intensity in the presence of sorafenib further confirmed the pro-apoptotic effects. Additionally, increased Hoechst staining by sorafenib treatment was abrogated by the presence of Z-VAD-FMK, a caspase inhibitor. This result further supports that sorafenib induces caspase-dependent apoptotic responses.
Figure 5.


CCCP and sorafenib induced different cell fate outcomes in a Parkin-dependent manner. A and B, CCCP induces Parkin-dependent mitophagy, but sorafenib does not. HeLa cells expressing Venus–Parkin–WT, RFP–Smac, and CFP–LC3 were treated with 10 μm CCCP and 20 μm sorafenib for indicated times. Mitophagy response was visualized with fluorescent microscopy exhibiting translocation of Parkin and LC3 to the mitochondria and quantified by collecting image pairs and analyzed via MATLAB to detect co-localization (C). CCCP induced robust LC3 and mitochondrial co-localization but not sorafenib. D, apoptosis response was visualized with fluorescent microscopy exhibiting RFP–Smac release from mitochondria and quantified. Sorafenib induced strong apoptosis but not CCCP. E–H, sorafenib induced apoptosis was dependent on Parkin. E and F, HeLa cells expressing RFP–Smac and Venus–Parkin–WT or Venus–Parkin–T240R were incubated with 30 μm sorafenib in a 7.5-h time. Apoptosis was quantified by RFP–Smac release. Scale bar, 10 μm. G, apoptotic cell number of HeLa cells, HeLa cells expressing Venus–Parkin–WT, and HeLa cells expressing Venus–Parkin–T240R was quantified by RFP–Smac releasing from mitochondria. 100 cells were quantified for each cell line for indicated time points. H, quantification of apoptotic percentages of HeLa cells expressing wild-type or T240R mutant Parkin.
Next, we sought to determine whether the PINK1/Parkin pathway plays a role in sorafenib-induced apoptosis. The fact that the parental HeLa cells do not express Parkin allowed us to compare the sorafenib response with or without functional Parkin expression. HeLa cells expressing RFP–Smac–MTS with Venus–Parkin–WT or Venus–Parkin–T240R were incubated with 30 μm sorafenib for 7.5 h (Fig. 5, E and F). The apoptosis response was quantified by counting RFP–Smac release from mitochondria, a reporter of MOMP. Venus–Parkin–WT cells exposed to sorafenib clearly display enriched mitochondria Parkin localization and apoptosis, whereas cells expressing Venus–Parkin–T240R under the same conditions have almost no Parkin translocation to mitochondria and cell death (Fig. 5, E and F, and supplemental Movie 3). Time-dependent apoptotic response was measured and quantified for the parental HeLa cells, Venus–Parkin and Venus–Parkin T240R HeLa cells (Fig. 5G, 4H). HeLa cells with wild-type Parkin showed higher rates of apoptosis compared with the parental or Parkin T240R mutant, suggesting that sorafenib-induced apoptosis is Parkin-dependent. To test whether the sorafenib-induced apoptosis is also PINK1-dependent, PINK1 was depleted using the PINK1 siRNA. As shown in supplemental Fig. 2, C–E, PINK1 knockdown blocked sorafenib-induced translocation of Parkin to mitochondria and significantly decreased the rate of apoptosis (supplemental Fig. 2, C and E). We also investigated that the endogenous PINK1/Parkin pathway also regulates sorafenib apoptotic response in other cell lines. MEF cell lines that were derived from PINK1 or Parkin knock-out or from wild-type mice were treated with 30 μm sorafenib, and apoptosis was quantified by NucView caspase-3 sensor and Hoechst 33258 staining. There was less apoptosis in PINK1 and Parkin-null MEF cells than in their wild-type counterparts (supplemental Fig. 3), suggesting that loss of either PINK1 or Parkin makes cells less sensitive to induction of apoptosis by sorafenib treatment. The defects in sorafenib response could be fully restored in these knock-out cell lines upon expression of human PINK1 or Parkin. Collectively, these results indicate that PINK1 and Parkin are involved in regulating sorafenib-induced cellular apoptosis.
Sorafenib induces PINK1/Parkin-dependent apoptosis by suppressing the Bcl-2 family of proteins
Both CCCP and sorafenib cause PINK1 induction and mitochondrial localization of Parkin, yet the biological outcomes are distinct (mitophagy versus apoptosis). We sought to determine the molecular basis for the divergent responses of these two compounds. First, we compared caspase-3 and PARP activation in wild-type and Parkin mutant cell lines in response to sorafenib and CCCP treatments by immunoblotting. Consistent with apoptotic response induced by sorafenib, pro-caspase-3 was reduced, and PARP cleavage was strongly induced by sorafenib but not CCCP in a Parkin-dependent manner (Fig. 6, A and B). We and others have previously shown that Parkin can target the Bcl-2 family of proteins to regulate apoptosis (18, 20). To determine whether sorafenib or CCCP regulate the Bcl-2 family protein, we blotted Bcl-2, Mcl-1, and Bcl-xL in HeLa with wild-type or mutant Parkin. Sorafenib strongly suppressed expression of Mcl-1 in a Parkin-dependent manner but induced no significant changes in expression levels for Bcl-2 and Bcl-xL (Fig. 6, C and D). In contrast, no significant changes were seen in the three Bcl-2 family members with CCCP treatment in either cell line (Fig. 6, C and D). To determine whether CCCP and sorafenib may activate PINK1 and Parkin differently in HeLa cells, we also blotted PINK1 and Parkin upon treatment with sorafenib and CCCP in parallel in HeLa cells expressing Venus–Parkin. PINK1 elevation occurred with both treatments, whereas drastic Mcl-1 down-regulation was only seen in sorafenib-treated cells (Fig. 6E). Suppression of Mcl-1 can occur through a transcriptional mechanism or post-transcriptional mechanism. To determine whether the proteasome is involved in Mcl-1 suppression by sorafenib, MG-132 was added along with sorafenib and compared with treatment with sorafenib alone. Inhibition of the proteasome completely abrogated suppression of Mcl-1 by sorafenib (Fig. 6F), and higher molecular weight species appeared with MG-132 treatment, which may correspond to ubiquitylated but not degraded Mcl-1. This result suggests that down-regulation of Mcl-1 by sorafenib largely occurs through degradation by the ubiquitin/proteasome pathway. Because Mcl-1 suppression by sorafenib also required functional Parkin (Fig. 6C), we conclude that sorafenib activates the PINK1–Parkin pathway to degrade Mcl-1.
Figure 6.

Sorafenib but not CCCP induces Parkin-dependent suppression of Mcl-1 and activates apoptotic initiator caspases. A and B, HeLa Parkin–WT or Parkin–T240R cells were exposed to 20 μm sorafenib (A) or 10 μm CCCP in a 6-h time course. Sorafenib induces robust PARP cleavage and activation of initiator caspase-3 characterized by reduction of the pro-caspase signal. The effect of CCCP on PARP or pro-caspase-3 cleavage is modest. The effect of sorafenib was not observed in the mutant Parkin cell line. C and D, effect of sorafenib on anti-apoptotic Bcl-2 family of proteins was monitored by immunoblotting (IB). Sorafenib causes a depletion of Mcl-1 but not Bcl-xL or Bcl-2 in a Parkin-dependent manner. E, sorafenib and CCCP have similar effects on PINK1 stabilization and Parkin activation but differ in Mcl-1 suppression. F, suppression of Mcl-1 by sorafenib can be reversed by proteasome inhibitor MG132. G, immunoblotting showed the suppression of endogenous Mcl-1 expression by Mcl-1 shRNA. HeLa cells expressing Venus–Parkin and RFP–Smac were infected with shRNA for Mcl-1. H, CCCP induces apoptosis in HeLa cells with reduced Mcl-1 expression. Sorafenib induced stronger apoptosis in Mcl-1 knockdown cells. Apoptotic cell death was quantified by counting cells positive for RFP–Smac release. I and J, overexpression of CFP-tagged mouse Bcl-2 in HeLa Parkin cells suppresses sorafenib induced apoptosis. Immunoblotting confirms the ectopic expression of CFP-mBcl-2. Quantification of apoptotic percentages of HeLa Parkin cells and HeLa Parkin mBcl-2 cells upon incubation with 20 μm sorafenib.
To test the role of Mcl-1 degradation in the apoptotic response of cells to sorafenib, we knocked down the expression of Mcl-1 with an shRNA expression vector in HeLa cells with reconstituted Parkin. Immunoblotting experiments confirmed reduction of Mcl-1 (Fig. 6G). Time-lapse imaging of the control or Mcl-1 knockdown HeLa cells treated with CCCP or sorafenib revealed that Mcl-1 knockdown accelerated the sorafenib-induced apoptotic response, and more strikingly, the CCCP-induced mitophagy response was switched to an apoptotic response (Fig. 6H). Therefore, the cellular decision to undergo apoptosis or mitophagy depends not only on activation of Parkin on mitochondria but also on the Mcl-1 levels within the cell.
If Parkin functions upstream of the Bcl-2 family proteins to modulate responses to sorafenib, we would expect that high levels of Bcl-2 proteins may antagonize sorafenib-induced Parkin-dependent apoptotic response. HeLa cells have significant Mcl-1 levels, and introduction of Mcl-1 did not result in significant overexpression of Mcl-1 (data not shown). However, we were able to overexpress CFP-tagged mouse Bcl-2 in HeLa cells (∼50 kDa) (Fig. 6I). In HeLa cells stably expressing mBcl-2, there was significant reduction in both the percentage of cells (∼50%) that underwent apoptosis and delayed triggering apoptosis upon treatment with sorafenib (Fig. 6J). Overexpression of Bcl-2 effectively suppresses the activity of Parkin in HeLa cells, and this result supports our model that Parkin acts upstream of the Bcl-2 family proteins to regulate drug sensitivity to sorafenib.
Rationalized drug combinations to shift autophagy response to apoptotic response
Results shown in Fig. 6, I and J, suggest that overexpression of Bcl-2 makes cells more resistant to sorafenib-induced cellular apoptosis. The Bcl-2 family of proteins acts downstream of PINK1 and Parkin to dictate the Parkin-dependent apoptotic responses to sorafenib. Based on this result, we hypothesized that lower anti-apoptotic activity of Bcl-2 should make cells more sensitive to sorafenib. ABT-737 is a BH3 mimetic inhibitor of Bcl-xL, Bcl-2, and Bcl-w with an EC50 of 78.7, 30.3, and 197.8 nm, respectively (Selleckchem). No inhibition has been observed against Mcl-1, Bcl-B, or Bfl-1. To test our hypothesis, HeLa cells with or without Bcl-2 overexpression were treated with sorafenib, ABT-737, or both in combination. HeLa mBcl-2 cell lines were more resistant to sorafenib, as expected. ABT-737 had no single-agent apoptotic activity at 10 μm for either cell line. However, when sorafenib and ABT-737 were added together, both the wild-type and the Bcl-2-overexpressing cells were completely eliminated by apoptosis (Fig. 7A). This result suggests that the combination of the Bcl-2 inhibitor ABT-737 with sorafenib synergistically triggers robust apoptosis of cancer cells. We also tested the combination effects of CCCP and ABT-737, because neither of them alone had significant cell-killing activity. When CCCP and ABT-737 were added together, robust apoptotic activity was observed (Fig. 7B). This result suggests that cancer cells with a robust PINK1–Parkin pathway are more susceptible to combined treatment with sorafenib and Bcl-2 inhibitors.
Figure 7.

Sorafenib and Bcl-2 inhibitor act in combination to induce switch of autophagy to apoptosis. A, sorafenib-induced Parkin-dependent cell death can be affected by Bcl-2 protein expression. Combination of ABT-737 with sorafenib synergistically triggers robust apoptosis. Cells were treated with 30 μm sorafenib or 10 μm ABT-737 or both. B, CCCP can induce cellular apoptosis in combination with ABT-737. ABT-737, a selective inhibitor of Bcl-2, could not trigger cell death by itself. However, a combination of 10 μm CCCP and ABT-737 switched autophagy to apoptosis. C, proposed model for sorafenib induced cellular response via kinase-dependent or mitochondrion-dependent pathways. ***, statistically significant p < 0.05.
Discussion
Through an unbiased screen of an FDA-approved oncology drug library, we discovered that sorafenib can activate the PINK1/Parkin pathway and accelerate cellular apoptotic response. Similar to CCCP, sorafenib promotes Parkin mitochondrial recruitment by stabilizing PINK1 on the mitochondrial outer membrane. However, the underlying mechanisms of action leading to mitochondrial depolarization and Parkin recruitment differ between these two chemicals. Sorafenib directly targets ETC and inhibits the activity of both complex II/III and complex V. This dual inhibition is sufficient to cause Parkin–PINK1 activation, as shown by reconstitution of this effect with simultaneous exposure to both antimycin and oligomycin (Fig. 4I). Alternatively, CCCP induces Parkin-dependent mitophagy, and sorafenib promotes Parkin-dependent apoptosis. Sorafenib-induced apoptosis is associated with suppression of Mcl-1 and requires phosphorylation on Ser-65 of Parkin. High levels of Bcl-2 expression antagonize sorafenib-induced apoptotic response. Sorafenib-induced Parkin-dependent apoptotic response can be enhanced by combining with Bcl-2 inhibitor ABT-737. Our results suggest PINK1 and Parkin are new activity indicators for sorafenib, and activation of PINK1 and Parkin may contribute to overall cellular responses to drug treatment.
Depolarization of the inner mitochondrial membrane (IMM) potential has been shown to cause PINK1 activation and Parkin recruitment to mitochondria. Although many mitochondrial toxins, including compounds that cause ROS production can depolarize IMM, only the proton ionophores CCCP and carbonyl cyanide p-trifluoromethoxyphenylhydrazone and the potassium uniporter valinomycin can induce robust PINK1 stabilization and Parkin mitochondrial recruitment (6, 17, 19). In this study, we identified sorafenib as a new chemical inducer of the PINK1/Parkin pathway. The potency of sorafenib to induce PINK1 and Parkin is in the low micromolar range, comparable with those of CCCP and valinomycin. Although sorafenib is widely known as a potent tyrosine kinase inhibitor, the effects of sorafenib on mitochondria have been recognized previously. Quantitative proteome analysis revealed that sorafenib down-regulates the abundance and the activity of the respiratory chain complex I in neuroblastoma cells (22). Sorafenib impairs the complex I enzyme activity and mitochondrial membrane potential (22). Impairment of complex I alone is insufficient for PINK1/Parkin activation, and characterized complex I inhibitors, including 1-methyl-4-phenylpyridinium (MPP+), paraquat, or rotenone, fail to do so (17). To address the molecular mechanism of sorafenib-induced mitochondria impairment, we directly measured the activity of sorafenib toward all five ETC complexes in vitro. Our biochemical analysis unexpectedly showed that sorafenib has no significant inhibitory activity against complex I or complex IV. Instead, sorafenib inhibits complex II/III and complex V at low micromolar concentrations. By examining the action of each ETC inhibitor individually and in combination, we observed that sorafenib is equivalent to that of simultaneous antimycin A and oligomycin exposure, confirming that dual inhibition of complex II/III and complex V is sufficient to elicit PINK1–Parkin activation. One explanation for the effectiveness of sorafenib alone or antimycin/oligomycin combination is that inhibition of complex II/III halts respiration, and consequently, the mitochondrial membrane potential ΔΨm is likely maintained by reversal of complex V under this condition (23). Inhibition of complex V by oligomycin will prevent reverse pumping of protons and therefore quicker loss of ΔΨm thereby blocking of PINK1 import and degradation (Fig. 4K). Our data additionally suggest that the IMM depolarization is likely a causal event preceding PINK1–Parkin recruitment to the mitochondria, but it is insufficient to drive robust Parkin recruitment because KCN plus oligomycin also causes quick depolarization of the mitochondrial membrane potential yet no Parkin recruitment (Fig. 4, I–K). Other events such as elevated ROS production or misfolded protein accumulation could be involved in mounting the Parkin recruitment. Future studies are necessary to delineate additional biochemical events that drive this process. Both sorafenib and CCCP can cause robust activation of the PINK1–Parkin pathway; however, cellular response cannot fully explain why sorafenib induced apoptosis cannot be mimicked with CCCP exposure (Fig. 5D). This observation outlines how sorafenib's previously known mechanism of action as an RTK inhibitor likely plays a role in the cell death response (Fig. 7A). Whereas CCCP induces Parkin-dependent mitophagy, sorafenib promotes Parkin-dependent apoptosis. Sorafenib-induced apoptosis is associated with suppression of Mcl-1 and requires the phosphorylation on Ser-65 of Parkin. Not only can high levels of Bcl-2 expression antagonize sorafenib-induced apoptosis (Fig. 6J), but also inhibition of Bcl-2 can enhance sorafenib-induced apoptosis (Fig. 7B). As a result, our data indicate the importance of sorafenib's ability to lower anti-apoptotic protein levels in the cell as a contributing feature of the mechanism of action by which sorafenib induces cellular apoptosis (Fig. 7C).
Multiple lines of evidence support the notion that Parkin is a tumor suppressor. First, loss of the parkin gene is observed in a subset of human colorectal (CRC), hepatocellular carcinoma (HCC), and glioblastoma samples (14, 15). Second, our analysis of Parkin mRNA expression in established human cancer cell lines indicates that Parkin mRNA levels are exceedingly low compared with that of normal human tissues. Third, others have reported considerable variability in Parkin mRNA expression and protein levels in human hepatocellular carcinoma cell lines and primary tumors (24). Fourth, Parkin knock-out mice are susceptible to HCC, and Parkin-null hepatocytes are more resistant to apoptosis induced by cytotoxic drugs (12). The biochemical mechanisms by which Parkin suppresses tumor formation remain elusive, although up-regulation of follistatin may be involved in modulating cytotoxic drug sensitivity (12). Our results establish a new link between sorafenib, mitochondrial damage, and subsequent activation of PINK1/Parkin pathway to regulate the Bcl-2 family of proteins. This connection may provide one explanation as to why Parkin is a tumor suppressor. Altered expression of Bcl-2 family genes is frequently observed in human cancers, and dysregulation of these genes contributes to the pathogenesis and progression of human cancers (25). Bcl-2 is a validated drug target, and Bcl-2 inhibitor venetoclax has won FDA approval for treatment of chronic lymphocytic leukemia. Existing data suggest an antagonist relationship between Bcl-2 family members and Parkin (18, 20, 26). Our data support the idea that Parkin functions upstream of Bcl-2 proteins and restrains their activities in the apoptotic response. Bcl-2 levels provide an important cellular context for Parkin-dependent sorafenib response. Therefore, we propose Parkin functions as a tumor suppressor by antagonizing the anti-apoptotic Bcl-2 family proteins.
Based on the above results and the canonical mechanism of sorafenib, we propose that sorafenib targets both receptor tyrosine kinase (RTKs) signaling and mitochondrial quality control pathways to cause tumor suppression (Fig. 7C). By inhibiting RTKs whose activities are elevated in a variety of tumor cells to fuel excessive cell proliferation, sorafenib shuts down both PI3K/AKT and MEK pathways, both of which are known to regulate transcription of Bcl-2 and Mcl-1 through NF-κB and Elk-1 (27, 28). Sorafenib steadily depolarizes IMM potential, and as a result, PINK1 becomes stabilized on the outer mitochondrial membrane, which leads to phosphorylation of Parkin at Ser-65 and promotes autocatalytic activation of the E3 ligase activity of Parkin and translocation of Parkin to mitochondria. Parkin ubiquitylates numerous substrates on mitochondria, including Mcl-1, and lowers the overall levels of anti-apoptotic Bcl-2 proteins (18, 20, 29). The overall levels of anti-apoptotic protein may dictate whether cells undergo apoptosis or survival. Thus, the overall cellular response to sorafenib depends on not only inhibition of RTKs but also on impairment of mitochondria.
Experimental procedures
Constructs
Venus-tagged Parkin and mTurquoise-tagged Parkin S65A constructs were described previously (18). PINK1–EGFP was constructed by inserting EGFP at the carboxyl terminus of PINK1 in the background of CSII-EF-DEST-IRES-hygromycin lentiviral vectors (gift of Dr. Hiroyuki Miyoshi). pMSCV-CMV-puro-IMS-RFP was used as mitochondrial marker as described previously. LC3 and murine Bcl-2 (gifts from Dr. Jennifer Lippincott-Schwartz and Dr. Stratford May) were cloned into CSII-EF-CFP-DEST-IRES-hygromycin lentiviral vectors to get CFP–LC3 and Bcl-2 constructs.
Cell culture, transfection, and reagent treatment
HEK293T cells were obtained from the ATCC (American Type Culture Collection). The HeLa cell line was a gift from Sabrina Spencer. Parkin and PINK1 wild-type and null MEF cells were described previously (30). HeLa and HEK293T cells were maintained in Dulbecco's modified Eagle's medium (DMEM) supplemented with 10% fetal calf serum (Invitrogen), penicillin, streptomycin (100 IU/ml and 100 mg/ml, respectively), and l-glutamine. MEFs were grown in DMEM containing 10% fetal bovine serum, penicillin (100 units/ml), streptomycin (100 units/ml), 1 mm l-glutamine, 1 mm sodium pyruvate, and 1× nonessential amino acids. All the stable cell lines made by lentivirus and retrovirus packaging were selected with 100 μg/ml hygromycin (Alexis Biochemicals), 5 μg/ml blasticidin (Invitrogen), or 2 μg/ml puromycin (Sigma) based on the selection markers. Mitochondrial membrane potential was dissipated with 10–20 μm CCCP (Sigma) and 10–40 μm sorafenib and sorafenib tosylate as indicated (Selleckchem and LC Laboratories). For apoptosis and mitophagy assays, cells were treated with 200 nm MitoTracker red dye (Life Technologies, Inc.), 20 μm Z-VAD-FMK (Abcam), 4 μm Obatoclax (LC Laboratories), and 10 μm ABT-737 (AdooQ).
Antibodies
Antibodies used in this study for Western blottings (WB) were as follows: mouse anti-Parkin (1:1000 and 1:5000; clone PRK8, Sigma); rabbit anti-PINK1 (1:1000, BC100-494, Novus Biologicals; 1:1000, D8G3, Cell Signaling); mouse anti-EZRIN (1:5000, Sigma); and mouse anti-GAPDH(1:5000, Santa Cruz Biotechnology). Anti-caspase-3, PARP, Mcl-1, Bcl-2, and Bcl-xL antibodies were purchased from Cell Signaling Technology.
Live cell imaging and fluorescence microscopy
To obtain high-throughput images and movies, cells were grown on Costar 96-well 3603 plates. Molecular Devices ImageXpress XL was used to screen the plates and collect data. Live cell imaging was collected for 0–24 h. To get high-resolution images and movies for Parkin mitophagy, cells were grown on a 4-well glass bottom chamber (Lab-Tek). Confocal images were acquired on a Nikon A1R Confocal and TIRF using a ×40 or ×100 (NA 1.45) objective lens.
Mitochondrial membrane potential quantification
Mitochondria in HeLa cells were stained using 400 nm TMRE (Life Technologies, Inc.). The mitochondrial membrane potential was measured using the mCherry channel on ImageXpress microscope (Molecular Devices). The ×20 objective was used, and images were collected every 2 min for 40 min. At least 500 cells per condition were examined and quantified.
Electron transport chain activity assays
Confocal laser-scanning live cell imaging of FAD autofluorescence was used to estimate the activity of the ETC on an A1R laser-scanning confocal microscope (Nikon) following the protocol described previously (31). Cells growing on a glass bottom 96-well plate were scanned for 2 min with 454 nm excitation wavelength, and emission between 505 and 550 nm was collected to establish the baseline autofluorescence. The laser power was limited to less than 0.2% to prevent cell damage. With the optimized scanning conditions and stabilized autofluorescence signal over 2 min, 1 μm CCCP was added to maximize the respiration and continue scan for an additional 2 min. To evaluate the effect of sorafenib on FAD autofluorescence, we pretreated cells with either 20 μm sorafenib or 10 μm antimycin A for 2 min prior to the addition of 10 μm CCCP.
Mitochondrial ETC and complex V assays
MitoToxTM complex I, complex IV, and complex V OXPHOS activity microplate assay kits were purchased from Abcam (ab109903 and ab110419) and used to measure the inhibitory activity of compounds on complex I, IV, and V following the manufacturer's instruction. Mitocheck complex II/III (Cayman Chemical catalog no. 700950) assay kit was used to measure the inhibitory activity of compounds on complex II/III and IV. Briefly, for complex I, IV, and V activity measurement, bovine heart mitochondria (360 μl at 5.5 mg/ml) was solubilized, and 15 μg of mitochondria was added to each well of precoated 96-well microplate. NADH-ubiquinone oxidoreductase, cytochrome c oxidase, and ATP synthase were immunocaptured by the corresponding antibodies coated on 96-well assay plates. For complex I assay, phospholipids were added prior to the incubation with 10 μm DMSO or 10 μm rotenone or different doses of sorafenib along with the complex I activity solution that contains ubiquinone 1 and NADH. NADH depletion was calculated from decreasing absorbance at 340 nm at room temperature in kinetic mode taking absorbance measurements every minute for 1 h. The rate of decrease in absorbance at 340 nm over time is calculated from the linear range using MATLAB for various experimental conditions. For complex IV assay, antibody-coated microplate was washed with blocking buffer prior to the addition of 200 ng of detergent-solubilized bovine heart mitochondria per well and 3 h of incubation at room temperature. 200 μl of complex IV activity solution, which contains reduced cytochrome c along with 10 μm DMSO or 10 μm KCN and different doses of sorafenib, was incubated at room temperature for 1 h. Cytochrome c oxidation was measured by taking the absorbance at 550 nm in kinetic mode every minute for 60 min. Because the complex IV reaction is product-inhibited, the rate of activity was expressed as the initial rate of oxidation of cytochrome c. For complex V assay, 15 μg of detergent-solubilized bovine heart mitochondria was added to each well of microplate precoated with the complex V antibody. After a 2-h incubation and wash, 40 μl of phospholipids was added and incubated for 45 min prior to the addition of the complex V activity solution, which contains phosphoenolpyruvate, pyruvate kinase, lactate dehydrogenase, and NADH. The production of ADP by ATP synthase can be coupled to the oxidation of NADH to NAD+, and the progress of the coupled reaction was monitored as a decrease in absorbance at 340 nm. The complex V activity solution was added to microplate wells along with 10 μm DMSO or 10 μm oligomycin or different doses of sorafenib. The activity of the ATP synthase enzyme was measured by taking absorbance at A340 nm every minute for 1 h at room temperature, and the rate was calculated as the linear rate of activity between 12 and 50 min.
For complex II/III assay, 20 μl of intact bovine heart mitochondria was preincubated with 2 μm rotenone and 20 μm KCN prior to the addition of complex III activity assay buffer, which contains succinate and oxidized cytochrome c. The rate of reduced cytochrome c production was measured by taking absorbance at 550 nm every minute for 10 min at room temperature in the presence of 10 μm DMSO, 10 μm antimycin A, and different doses of sorafenib. All data were collected with Tecan Safire reader, and custom MATLAB scripts were used to analyze and plot the results. Each experiment was run in triplicate and repeated at least twice.
Mitophagy assays
Mitophagy was determined by the co-localization study of LC3 with mitochondrial marker (RFP–Smac). The CFP–LC3 and RFP–Smac co-localization was quantified using custom MATLAB scripts to calculate Pearson and Manders co-localization coefficients.
Cell death assays
Four independent cell death assays were used. For the HeLa cells stably expressing RFP–Smac, cell death was monitored by quantifying RFP–Smac release from mitochondria, as described previously (32). Live cell imaging of cell apoptosis in MEF and HEK293 cells were performed using NucViewTM488 (Biotium). The detailed method was described previously (18). Cells were grown on 96-well plates overnight, and then 4 μm NucView caspase-3 biosensor (Biotium) was added. HCS microscope ImageXpress (Molecular Devices) was employed to collect images at the indicated time. At least 1000 cells per well were examined and quantified. Hoechst dye was included in the media to obtain the total number of nuclei in the field of view. The number of NucViewTM488-positive cells relative to the total number of nuclei was determined and plotted. Apoptotic cell death was also visualized and scored by staining with Hoechst 33258, which labels all cells regardless of cell health. The average intensity of DNA labeling significantly increased in apoptotic cells as nuclei condense during apoptosis. Quantitation of cell death was performed using the automated high content analysis cell health application module in MetaXpress software (Molecular Devices).
Statistical analysis
The mitochondrial co-localization with Parkin and LC3 in HeLa cells was assessed by visually scoring for the co-localization coefficient of more than 200 cells per stable cell line in at least three independent experiments. Images collected from a confocal microscope were used to get high resolution images. For quantification of HeLa apoptosis, more than 200 cells were quantified per condition by counting RFP–Smac releasing and chromosome condensing. For quantification of MEF and HEK293 apoptosis, more than 2000 cells were quantified per condition using the MetaXpress application module Multiwavelength Cell Scoring Application Module (Molecular Devices). For quantification of high throughput scoring of Parkin and Mitochondria co-localization, more than 500 cells were quantified per condition using MetaXpress Transfluor co-localization application module (Molecular Devices). Standard deviations were calculated from at least three sets of data. The p values were determined using Microsoft Excel.
Author contributions
C. Z., Z. L., E. B., A. R., S. L., Y. P., and D. A. C. performed experiments and analyzed data. C. Z., A. T., S. G. E., and X. L. designed the studies. C. Z. and X. L. wrote the manuscript. All authors reviewed the results and approved the final version of the manuscript.
Supplementary Material
Acknowledgments
We thank Drs. Stratford May, Jie Shen, Stefan Constantinescu, Schuyler Van Engelenburg, Jennifer Lippincott-Schwartz, and Sabrina Spencer for providing critical reagents. We thank Drs. Natalie Ahn, Amy Palmer, and Douglas Chapnick for discussion. We thank Graycen Wheeler for critical reading of the manuscript. We thank Steve Wiltgen and Vipat Raksakulthai of Molecular Devices for their help with development of MetaXpress journals for automated imaging analysis. The ImageXpress MicroXL was supported by National Institutes of Health Grant S10 RR026680 from NCRR. We thank Joseph Dragavon and BioFrontiers Advanced Light Microscopy Core for their support. The FACSAria cell sorter was supported by National Institutes of Health Grant S10 OD021601.
Addendum
While this manuscript was under review, Prieto-Domínguez et al. (21) showed co-administration of melatonin and sorafenib activates PINK1 and Parkin pathway and increase cell killing activity of sorafenib.
This work was supported by National Institutes of Health Grant GM113141 and a Butcher Award from the University of Colorado (to X. L.). The authors declare that they have no conflicts of interest with the contents of this article. The content is solely the responsibility of the authors and does not necessarily represent the official views of the National Institutes of Health.
This article contains supplemental Movies S1–S3, Table S1, and Figs. S1–S3.
- MDV
- mitochondrion-derived vesicle
- CCCP
- carbonyl cyanide m-chlorophenylhydrazone
- ETC
- electron transport chain
- TMRE
- tetramethylrhodamine methyl ester
- Z
- benzyloxycarbonyl
- FMK
- fluoromethyl ketone
- PARP
- poly(ADP-ribose) polymerase
- MEF
- mouse embryonic fibroblast
- FDA
- Food and Drug Administration
- CRC
- human colorectal cancer
- HCC
- hepatocellular carcinoma
- RTK
- receptor tyrosine kinase
- MTS
- mitochondrial targeting signal
- RFP
- red fluorescent protein
- MOMP
- mitochondrial outer membrane permeability
- CFP
- cyan fluorescent protein
- IMM
- inner mitochondrial membrane
- ROS
- reactive oxygen species.
References
- 1. Sawyers C. (2004) Targeted cancer therapy. Nature 432, 294–297 [DOI] [PubMed] [Google Scholar]
- 2. Wilhelm S. M., Carter C., Tang L., Wilkie D., McNabola A., Rong H., Chen C., Zhang X., Vincent P., McHugh M., Cao Y., Shujath J., Gawlak S., Eveleigh D., Rowley B., et al. (2004) BAY 43-9006 exhibits broad spectrum oral antitumor activity and targets the RAF/MEK/ERK pathway and receptor tyrosine kinases involved in tumor progression and angiogenesis. Cancer Res. 64, 7099–7109 [DOI] [PubMed] [Google Scholar]
- 3. Cabanillas M. E., Waguespack S. G., Bronstein Y., Williams M. D., Feng L., Hernandez M., Lopez A., Sherman S. I., and Busaidy N. L. (2010) Treatment with tyrosine kinase inhibitors for patients with differentiated thyroid cancer: the M. D. Anderson experience. J. Clin. Endocrinol. Metab. 95, 2588–2595 [DOI] [PubMed] [Google Scholar]
- 4. Abou-Sleiman P. M., Muqit M. M., and Wood N. W. (2006) Expanding insights of mitochondrial dysfunction in Parkinson's disease. Nat. Rev. Neurosci. 7, 207–219 [DOI] [PubMed] [Google Scholar]
- 5. Youle R. J., and Narendra D. P. (2011) Mechanisms of mitophagy. Nat. Rev. Mol. Cell Biol. 12, 9–14 [DOI] [PMC free article] [PubMed] [Google Scholar]
- 6. Matsuda N., Sato S., Shiba K., Okatsu K., Saisho K., Gautier C. A., Sou Y. S., Saiki S., Kawajiri S., Sato F., Kimura M., Komatsu M., Hattori N., and Tanaka K. (2010) PINK1 stabilized by mitochondrial depolarization recruits Parkin to damaged mitochondria and activates latent Parkin for mitophagy. J. Cell Biol. 189, 211–221 [DOI] [PMC free article] [PubMed] [Google Scholar]
- 7. Yoshii S. R., Kishi C., Ishihara N., and Mizushima N. (2011) Parkin mediates proteasome-dependent protein degradation and rupture of the outer mitochondrial membrane. J. Biol. Chem. 286, 19630–19640 [DOI] [PMC free article] [PubMed] [Google Scholar]
- 8. Bingol B., Tea J. S., Phu L., Reichelt M., Bakalarski C. E., Song Q., Foreman O., Kirkpatrick D. S., and Sheng M. (2014) The mitochondrial deubiquitinase USP30 opposes parkin-mediated mitophagy. Nature 510, 370–375 [DOI] [PubMed] [Google Scholar]
- 9. McLelland G. L., Soubannier V., Chen C. X., McBride H. M., and Fon E. A. (2014) Parkin and PINK1 function in a vesicular trafficking pathway regulating mitochondrial quality control. EMBO J. 33, 282–295 [DOI] [PMC free article] [PubMed] [Google Scholar]
- 10. Pickrell A. M., and Youle R. J. (2015) The roles of PINK1, Parkin, and mitochondrial fidelity in parkinson's disease. Neuron 85, 257–273 [DOI] [PMC free article] [PubMed] [Google Scholar]
- 11. Picchio M. C., Martin E. S., Cesari R., Calin G. A., Yendamuri S., Kuroki T., Pentimalli F., Sarti M., Yoder K., Kaiser L. R., Fishel R., and Croce C. M. (2004) Alterations of the tumor suppressor gene Parkin in non-small cell lung cancer. Clin. Cancer Res. 10, 2720–2724 [DOI] [PubMed] [Google Scholar]
- 12. Fujiwara M., Marusawa H., Wang H. Q., Iwai A., Ikeuchi K., Imai Y., Kataoka A., Nukina N., Takahashi R., and Chiba T. (2008) Parkin as a tumor suppressor gene for hepatocellular carcinoma. Oncogene 27, 6002–6011 [DOI] [PubMed] [Google Scholar]
- 13. Mehdi S. J., Alam M. S., Batra S., and Rizvi M. M. (2011) Allelic loss of 6q25-27, the PARKIN tumor suppressor gene locus, in cervical carcinoma. Med. Oncol. 28, 1520–1526 [DOI] [PubMed] [Google Scholar]
- 14. Poulogiannis G., McIntyre R. E., Dimitriadi M., Apps J. R., Wilson C. H., Ichimura K., Luo F., Cantley L. C., Wyllie A. H., Adams D. J., and Arends M. J. (2010) PARK2 deletions occur frequently in sporadic colorectal cancer and accelerate adenoma development in Apc mutant mice. Proc. Natl. Acad. Sci. U.S.A. 107, 15145–15150 [DOI] [PMC free article] [PubMed] [Google Scholar]
- 15. Veeriah S., Taylor B. S., Meng S., Fang F., Yilmaz E., Vivanco I., Janakiraman M., Schultz N., Hanrahan A. J., Pao W., Ladanyi M., Sander C., Heguy A., Holland E. C., Paty P. B., et al. (2010) Somatic mutations of the Parkinson's disease-associated gene PARK2 in glioblastoma and other human malignancies. Nat. Genet. 42, 77–82 [DOI] [PMC free article] [PubMed] [Google Scholar]
- 16. Sutherland G. R., and Richards R. I. (1995) The molecular basis of fragile sites in human chromosomes. Curr. Opin. Genet. Dev. 5, 323–327 [DOI] [PubMed] [Google Scholar]
- 17. Kondapalli C., Kazlauskaite A., Zhang N., Woodroof H. I., Campbell D. G., Gourlay R., Burchell L., Walden H., Macartney T. J., Deak M., Knebel A., Alessi D. R., and Muqit M. M. (2012) PINK1 is activated by mitochondrial membrane potential depolarization and stimulates Parkin E3 ligase activity by phosphorylating serine 65. Open Biol. 2, 120080. [DOI] [PMC free article] [PubMed] [Google Scholar]
- 18. Zhang C., Lee S., Peng Y., Bunker E., Giaime E., Shen J., Zhou Z., and Liu X. (2014) PINK1 triggers autocatalytic activation of Parkin to specify cell fate decisions. Curr. Biol. 24, 1854–1865 [DOI] [PMC free article] [PubMed] [Google Scholar]
- 19. Narendra D. P., Jin S. M., Tanaka A., Suen D.-F., Gautier C. A., Shen J., Cookson M. R., and Youle R. J. (2010) PINK1 is selectively stabilized on impaired mitochondria to activate Parkin. PLos Biol. 8, e1000298. [DOI] [PMC free article] [PubMed] [Google Scholar]
- 20. Carroll R. G., Hollville E., and Martin S. J. (2014) Parkin sensitizes toward apoptosis induced by mitochondrial depolarization through promoting degradation of Mcl-1. Cell Rep. 9, 1538–1553 [DOI] [PubMed] [Google Scholar]
- 21. Prieto-Domínguez N., Ordóñez R., Fernández A., Méndez-Blanco C., Baulies A., Garcia-Ruiz C., Fernández-Checa J. C., Mauriz J. L., and González-Gallego J. (2016) Melatonin-induced increase in sensitivity of human hepatocellular carcinoma cells to sorafenib is associated with reactive oxygen species production and mitophagy. J. Pineal Res. 61, 396–407 [DOI] [PMC free article] [PubMed] [Google Scholar]
- 22. Bull V. H., Rajalingam K., and Thiede B. (2012) Sorafenib-induced mitochondrial complex i inactivation and cell death in human neuroblastoma cells. J. Proteome Res. 11, 1609–1620 [DOI] [PubMed] [Google Scholar]
- 23. Nicholls D. G., and Budd S. L. (2000) Mitochondria and neuronal survival. Physiol. Rev. 80, 315–360 [DOI] [PubMed] [Google Scholar]
- 24. Wang F., Denison S., Lai J. P., Philips L. A., Montoya D., Kock N., Schüle B., Klein C., Shridhar V., Roberts L. R., and Smith D. I. (2004) Parkin gene alterations in hepatocellular carcinoma. Genes Chromosom. Cancer 40, 85–96 [DOI] [PubMed] [Google Scholar]
- 25. Yip K. W., and Reed J. C. (2008) Bcl-2 family proteins and cancer. Oncogene 27, 6398–6406 [DOI] [PubMed] [Google Scholar]
- 26. Hollville E., Carroll R. G., Cullen S. P., and Martin S. J. (2014) Bcl-2 family proteins participate in mitochondrial quality control by regulating parkin/PINK1-dependent mitophagy. Mol. Cell 55, 451–466 [DOI] [PubMed] [Google Scholar]
- 27. Liu L., Cao Y., Chen C., Zhang X., McNabola A., Wilkie D., Wilhelm S., Lynch M., and Carter C. (2006) Sorafenib blocks the RAF/MEK/ERK pathway, inhibits tumor angiogenesis, and induces tumor cell apoptosis in hepatocellular carcinoma model PLC/PRF/5. Cancer Res. 66, 11851–11858 [DOI] [PubMed] [Google Scholar]
- 28. Yu C., Bruzek L. M., Meng X. W., Gores G. J., Carter C. A., Kaufmann S. H., and Adjei A. A. (2005) The role of Mcl-1 downregulation in the proapoptotic activity of the multikinase inhibitor BAY 43-9006. Oncogene 24, 6861–6869 [DOI] [PubMed] [Google Scholar]
- 29. Sarraf S. A., Raman M., Guarani-Pereira V., Sowa M. E., Huttlin E. L., Gygi S. P., and Harper J. W. (2013) Landscape of the PARKIN-dependent ubiquitylome in response to mitochondrial depolarization. Nature 496, 372–376 [DOI] [PMC free article] [PubMed] [Google Scholar]
- 30. Gautier C. A., Kitada T., and Shen J. (2008) Loss of PINK1 causes mitochondrial functional defects and increased sensitivity to oxidative stress. Proc. Natl. Acad. Sci. U.S.A. 105, 11364–11369 [DOI] [PMC free article] [PubMed] [Google Scholar]
- 31. Bartolomé F., and Abramov A. Y. (2015) Probing Mitochondrial Function in Mitochondrial Medicine (Weissig V., and Edeas M., eds), pp. 263–270, Humana Press, New York, NY [Google Scholar]
- 32. Spencer S. L., Gaudet S., Albeck J. G., Burke J. M., and Sorger P. K. (2009) Non-genetic origins of cell-to-cell variability in TRAIL-induced apoptosis. Nature 459, 428–432 [DOI] [PMC free article] [PubMed] [Google Scholar]
Associated Data
This section collects any data citations, data availability statements, or supplementary materials included in this article.