

Abstract
Twenty‐four–hour urine collection is the recommended method for estimating sodium intake. To investigate the strengths and limitations of methods used to assess completion of 24‐hour urine collection, the authors systematically reviewed the literature on the accuracy and usefulness of methods vs para‐aminobenzoic acid (PABA) recovery (referent). The percentage of incomplete collections, based on PABA, was 6% to 47% (n=8 studies). The sensitivity and specificity for identifying incomplete collection using creatinine criteria (n=4 studies) was 6% to 63% and 57% to 99.7%, respectively. The most sensitive method for removing incomplete collections was a creatinine index <0.7. In pooled analysis (≥2 studies), mean urine creatinine excretion and volume were higher among participants with complete collection (P<.05); whereas, self‐reported collection time did not differ by completion status. Compared with participants with incomplete collection, mean 24‐hour sodium excretion was 19.6 mmol higher (n=1781 specimens, 5 studies) in patients with complete collection. Sodium excretion may be underestimated by inclusion of incomplete 24‐hour urine collections. None of the current approaches reliably assess completion of 24‐hour urine collection.
Accurate monitoring is essential to supporting strategies to decrease population sodium intake to reduce high blood pressure and risk of cardiovascular disease.1, 2, 3 A 24‐hour urine collection is recommended for assessing mean population sodium intake because about 90% of sodium is excreted through urine and urine excretion does not rely on self‐report.4, 5, 6 In addition, 24‐hour urine can be used to assess potassium intake, which is important because potassium chloride may be used as a salt substitute to replace sodium chloride, although potassium excretion may be more variable (77%–90%).4, 7 Incomplete and/or undercollection of urine due to missed urine voids can result in falsely low 24‐hour sodium and potassium excretion. Overcollection, beyond 24 hours, can skew results in the opposite direction. Although methods exist to ensure and assess whether collection is complete, they are not uniformly applied across studies, decreasing the ability to compare estimates of sodium intake across populations.8
Currently, while most studies and national‐level surveys use creatinine and other indicators to determine whether 24‐hour urine collection is complete, there is no gold standard for measurement. Urinary para‐aminobenzoic acid (PABA) recovery, used in some national surveys, has been recommended as an objective and exogenous marker to assess completion of 24‐hour urine collection, because, theoretically, it is less affected by a participant's characteristics and diet.8, 9, 10, 11 PABA is a nontoxic B‐complex vitamin that is thought to be fully absorbed and is readily analyzed6 however, even PABA excretion has its limitations. Using PABA as a marker for complete urine collection requires participants to consume PABA supplements with meals and assumes almost complete excretion of a single dose of 80 mg (~93%) after about 5 hours using the colorimetric method and after about 8 hours using high‐performance liquid chromatography (HPLC).12, 13 Twenty‐four–hour urinary creatinine excretion either alone, in relation to expected creatinine excretion based for example on sex and weight, or with other characteristics of urine collection is also used as a marker for complete urine collection under the assumption that urinary creatinine excretion, an indicator of lean body mass, is stable within individuals from day to day.8, 14 However, creatinine excretion has been found to have large intervariability and intravariability possibly related to age, lean body mass, protein intake, and kidney function, eg, chronic kidney disease.6 Because of limitations with these methods, two previous, multi‐country population‐based studies in which 24‐hour sodium excretion was assessed (the International Population Study on Macronutrients and BP [INTERMAP] and the International Study of Sodium, Potassium, and Blood Pressure [INTERSALT]) did not use PABA recovery criteria or creatinine to assess completion. Instead, they attempted to ensure complete 24‐hour urine collection through comprehensive instruction, starting and stopping urine collection in person, and asking participants to redo urine collection if they reported missing more than a few drops or if the total measured 24‐hour urine volume was <250 mL.6
To inform the strengths and limitations of markers to assess completion of 24‐hour urine collection and directions for further research, we systematically reviewed the literature to evaluate the accuracy and usefulness of methods to assess the completion of 24‐hour urine collection in relation to PABA recovery criteria.
Methods
Information Sources and Search
Potentially relevant studies were identified through two separate librarian searches. The first search applied key terms similar to “urine specimen collection,” “urine collection,” “urine sample,” “urine specimen,” “24‐hour urine,” “24‐hour urine collection,” “standard,” “protocol,” and “guideline” through 16 electronic databases covering the period of 1823 to the present: MEDLINE, EMBASE, EBM Reviews, PubMed, PubMed Central, SCOPUS, Web of Science, Academic Search Complete [CINAHL, Health Source (Nursing/Academic edition), MEDLINE (EBSCO)], PAHO, Google, Google Scholar, OpenDOAR, ProQuest (theses & dissertations), TRIP, HSO, and OAIster (Figure S1A). The second search used six electronic databases covering the period from 1937 to the present employing key terms such as “24‐hour,” “urine collection,” “creatinine,” “PABA,” and “4‐aminobenzoic acid”: MEDLINE, EMBASE (non‐MEDLINE journals), Global Health, CINHAL, Cochrane Library, and LILACS (Figure S1B). One database search strategy is provided as an example (Table S1). No language restrictions were applied to either search.
Study Selection
We included systematic reviews, meta‐analyses, individual study reports, or additional references from experts with data on both complete and incomplete 24‐hour urine collections based on PABA recovery criteria compared with data on other criteria for determining completeness of 24‐hour urine collection (ie, self‐report, total urine volume, specific gravity, duration of collection, creatinine excretion). Eligible studies included men and women of any age regardless of chronic or acute disease. If study methods or data were reported in more than one article, we used one article as the primary publication with the other articles included in the reference list if they included essential information not reported in the primary article. Two reviewers read and assessed the 34 articles provided from the first librarian search (KJ and MEC) against the inclusion criteria. Of these articles, six met the inclusion criteria (Figure S1A). An additional article provided by the same author who conducted the first search (NC) was included at a later time after review of the inclusion criteria (Figure S1A). Reviewers were not blind to authors, institutions, or journal of publication. A total of 626 abstracts and titles were manually screened by two independent reviewers (KJ and SP), each individually assessing the articles by inclusion criteria. For 47 articles, full articles were retrieved and reviewed according to inclusion criteria. Of these, two articles met the inclusion criteria, one of which had already been found through the first librarian search (Figure S1B). Information from the included studies (n=8) was abstracted by one author (KJ) and was independently checked by one of the other authors (NC, CN, MEC). To obtain additional studies, references from the included studies were reviewed; however, no additional articles met the inclusion criteria.
Data Items
Abstracted information included: (1) the number of people enrolled, defined as participants who obtained a 24‐hour urine collection with data on PABA recovery; (2) the age range of participants; (3) the percentage of male participants; (4) the country in which the study took place; (5) exclusion criteria for the participants; (6) the number of 24‐hour collections for each participant; (7) the analytical laboratory method for PABA recovery assessment; (8) the lower limit of PABA recovery used to define incomplete collections; (9) the resulting percentage of participants with incomplete collections based on PABA recovery; (10) methods other than PABA used to determine incomplete 24‐hour urine collections (test methods); and (11d) outcome measures (including the number of participants with complete and incomplete 24‐hour urine collection according to PABA recovery or test method criteria and the mean and standard deviation of measures used to assess 24‐hour urine completion by PABA recovery criteria). All studies used a dose of 240 mg PABA (3 × 80 mg) over the 24‐hour period for PABA recovery assessment.
PABA Recovery Criteria Method Assessment
Two independent reviewers (KJ and MC) assessed each of the included studies for whether they assessed and adjusted for (1) adherence to PABA, (2) consumption of PABA‐containing medications (with colorimetric analysis of PABA), and (3) the duration of urine collection (greater than 24‐hours for participants 60 years and older) (Table S2).
Data Synthesis and Analysis
We summarized the demographic characteristics, exclusion criteria, PABA recovery criteria, and test methods used to assess completion of 24‐hour urine collection across studies. To assess the accuracy of test methods for identifying participants with incomplete collections we computed the sensitivity and specificity of test methods compared with incomplete urine collection as determined by PABA recovery criteria. Sensitivity was defined as the number of individuals with incomplete collection based on PABA recovery and on the test method (true positives) divided by the total number of incomplete collections based on PABA recovery criteria (true positives plus false negatives). Specificity was defined as the number of individuals with collection considered complete by PABA and complete by test method (true negatives) divided by the total number of individuals with complete collections (false positives plus true negatives). Optimally, a test method would have close to 100% sensitivity and 100% specificity in relation to the reference criteria. A high sensitivity would enable the test method to accurately exclude those with incomplete collections (low proportion of false negatives), whereas a high specificity would confirm the accurate detection of incomplete collections (low proportion of false positives or those collections that the test method indicated incomplete, but were not incomplete by PABA recovery criteria). The positive predictive value was defined as the number of individuals with incomplete collection based on PABA recovery and on the test method (true positives) divided by the total number of incomplete collections based on the test method criteria. The likelihood ratio is the probability of a person who has an incomplete urine collection testing positive (being incomplete) divided by the probability of a person who does not have an incomplete urine collection testing positive.
We also calculated the difference in mean urinary creatinine excretion, total urine volume, self‐report missing urine volume, 24‐hour urinary sodium and potassium by completion status based on PABA recovery criteria. Mean sodium and potassium concentrations that were reported in mg/d were converted to mmol/d using molecular weights of the analytes.15, 16 Unpaired t tests, assuming equal variance, were used to test whether the differences in means were significant at a level of .05. To be included in a meta‐analysis, the test method had to be used in two or more of the studies. To assess the pooled difference in urinary creatinine (mmol/d), creatinine by body weight (mmol/kg), urine volume (mL/d), hours of collection (h), urinary sodium (mmol/d), and urinary potassium (mmol/d) between those deemed complete and incomplete by PABA recovery, data were analyzed using Cochrane Review Manager (RevMan) version 5.3.3 (The Nordic Cochrane Center, The Cochrane Collaboration, Copenhagen, Denmark). Forest plots were created in RevMan using random effects models to generate mean difference pooled estimates between complete and incomplete collections, with each study weighted by the inverse of the study variance. We used the I 2 statistic to assess heterogeneity; however, since the interpretation of this value can be misleading as a result of possible inconsistencies in several factors, the Cochrane Handbook for Systematic Reviews suggests the following rough guide to interpretation: values <40% may not be important, 30% to 60% may represent moderate heterogeneity, 50% to 90% may represent substantial heterogeneity, and ≥75% may represent considerable heterogeneity.17 Statistical significance for heterogeneity assessed by chi‐square test was defined as P<.10. Statistical significance for test of overall effect was defined as P<.05.
Results
The eight studies meeting the criteria for inclusion in this systematic review were published between 1986 and 2014 (Table 1).18, 19, 20, 21, 22, 23, 24, 25 Of note is that three studies with information on 24‐hour urine collection based on PABA recovery and a test method were excluded because of reporting on complete collections only.14, 26, 27 Of the eight included studies, five were conducted in Europe,19, 21, 22, 23, 25 one in Japan,20 one in Canada,18 and one in the United States24 (Table 1). The eight studies combined included a total of 3070 participants, aged 15 to 89 years (Table 1). In all but one study,25 participants were characterized as generally healthy adults. The age range in each study varied. One study of gastroenterology outpatients included adolescents (aged 15–17 years), but separate analyses were not conducted for this age group.25 Exclusion criteria also varied (Table 1). While all studies reported in their methods that participants were either verbally informed or given written instructions as to the protocol to follow for the 24‐hour urine collection, none of the studies included the specific detailed instructions provided to the participants.
Table 1.
Characteristics of Included Studies Examining the Accuracy of Test Methods to Assess Completeness of 24‐Hour Urine Collection in Relation to Para‐aminobenzoic Acid Recovery
| Study | Participants Enrolled, No.a | Age, y | Men, % | Country | Exclusions |
|---|---|---|---|---|---|
| Fu18 | 681 | 37–66 | 49.8 | Canada | P, L, M, UT, T, F, DM, CKD, N |
| Subar et al24 | 484b | 40–69 | 53.9c | United States | DM, CKD, P, F |
| De Keyzer et al23 | 600 | 45–65 | 49.5 | Europe (Belgium, Czech Republic, France, Netherlands, Norway) | D, F, P, L, DM, CKD, M, A, N |
| Murakami et al20 | 654 | 18–22 | 0 | Japan | N, M |
| Bingham et al25 | 63 | 15d–82 | 38.1 | England | N, M, CKD |
| Leclercq, et al21 | 257 | 60–89e | NSf | Italy | N, UT, UL, M |
| Knuiman et al22 | 205g | 20–60 | NSh | Europe (Sweden, Finland, Denmark, Ireland, Netherlands, Germany, France, Portugal, Italy, Greece) | F, DCD |
| Williams and Bingham19 | 126 | 23–46i | 59.5 | England | DCD, L, N, M |
| Total | 3070 | 15–89 |
Abbreviations: A, allergy to para‐aminobenzoic acid; CKD, chronic kidney disease or renal disease; D, use of diuretics; DCD, drugs for chronic disease; DM, diabetes mellitus; F, prescribed diet; L, lactation; M, use of sulfonamide‐based antibiotics or acetaminophen‐containing medications (para‐aminobenzoic acid–containing medications), eg, paracetamol; N, nonadherence to para‐aminobenzoic acid including refusal to participate; NS, not specified; P, pregnancy; T, use of topical para‐aminobenzoic acid (eg, sunscreen or cosmetics containing para‐aminobenzoic acid); UL, reported urine loss during collection; UT, “disrespect of the timing of urine collection.” aThe number of participants in the study who collected at least one 24‐hour urine collection and were included in the study analysis. bMethods section of the study states that two participants dropped out of the study. The time at which the participants dropped out was not specifically stated. Data reported in the above table is on the 484 participants recruited for the study, since demographics for the two excluded individuals are unknown. cInformation on the proportion of male participants was available in Subar AF, Kipnis V, Troiano RP, et al. Using intake biomarkers to evaluate the extent of dietary misreporting in a large sample of adults: the OPEN study. Am J Epidemiol. 2003;158:1–13. dThe minimum age presented in the above table, assumes that the male renal patient aged 14 years was excluded from the study. Bingham originally presents the minimum age of 14 years in the results section before mentioning exclusions. This patient was not specifically mentioned in the exclusions and is further missing from results presented in Table 1 of the paper. eControl participants aged 19 to 39 years, were included in this study; however, data were not reported for this group for test methods assessing completeness. These control patients were further excluded from this Table. fNoninstitutionalized men and women were randomly selected after age and sex stratification of electoral roles (systematic sampling of three men and three women in each 5‐year stratum). Participant demographics and characteristics were not reported. gThe age range reported above was calculated using the total 1270 participants enrolled in this study. The number of participants reported above is a subset from six of the 11 European centers (taken from Table 5 from the original study) who had data reported on both complete and incomplete collections. hParticipants consisted of men and women from 11 European centers. It was recommended that 50 samples be collected from each sex. No women from Belgium and no men from Denmark participated. Total male participants consisted of 49% of the study population (623 of 1270). All data presented are of a subset of this population (sex not specified). iThe age range reported is of the total participants (taken from Table 1 from the original study). This range does not exclude participants missing 24‐hour urine collection.
Some participants in the studies provided more than one 24‐hour urine collection for a total of 5686 24‐hour urine collections (Table 2). Six studies used the colorimetric laboratory method to assess urinary PABA excretion while two used high‐performance liquid chromatography (HPLC) analysis in a subset of participants24 or the entire study population.18 Across these eight studies, 6% to 47% of 24‐hour urine collections were incomplete. Based on the colorimetric method, complete collection was defined as PABA recovery ≥ 85% and 53% to 94% of 24‐hour urine collections were complete (Table 2). Based on HPLC methods, complete collection was defined as PABA recovery in a specific range between 70% and 110%, and 64% to 90% of 24‐hour urine collections were complete.11, 24 Subar and colleagues24 defined complete collection as 78% to 110% PABA recovery, while Fu18 used a narrower range of 85% to 110%. Re‐examination of Fu's study using the criteria of 70% to 110% increased the percentage of complete collections to 90%.18
Table 2.
PABA Assessment and Characteristics of 24‐Hour Urine Collections Evaluated Among Studies Analyzing Accuracy of Test Methods to Assess Completeness of 24‐Hour Urine Collection in Relation to PABA Recovery
| Study | 24‐Hour Urine Collection, No. | PABA Recovery | |||
|---|---|---|---|---|---|
| Assay | Criteria | Complete, No. | Complete, % | ||
| Fu18 | 681 | H | ≥85% and <110% | 438 | 64 |
| Subar et al24 | 941 | C, H | ≥70% C or ≥78% and <110% H | 848 | 90 |
| De Keyzer et al23 | 1198 | C | ≥85% | 1069 | 89 |
| Murakami et al20 | 654 | C | ≥85% | 604a | 92 |
| Bingham et al25 | 63b | C | ≥85% | 45 | 71 |
| Leclercq et al21 | 257 | C | ≥85% | 135 | 53 |
| Williams and Bingham19 | 143 | C | ≥85% | 122 | 85 |
| Knuiman et al22 | 1749c | C | ≥85% | 1645 | 94 |
Abbreviations: BW, body weight (kg); C, colorimetric method; Cr, creatinine; H, high‐performance liquid chromatography method; PABA, para‐aminobenzoic acid. aData on the number of complete collections were found using Table 1 information without consideration of collection time and missing urine volume. bResults are reported for a subgroup of gastroenterology patients. There were 30 women and 15 men with complete collections while there were nine women and nine men with incomplete collections. Results in the following tables are presented as the total mean of the complete group and total mean of the incomplete group. cReported complete 24‐hour collections in patients from all of the 11 European countries. Test method assessment of completeness of collections data are reported for a subset of men and women from six European countries.
Overall, seven studies included data on creatinine (mmol/d),18, 19, 20, 21, 22, 23, 25 three studies on the ratio of creatinine to body weight (mmol/kg),18, 20, 25 one on a combination of creatinine to urine volume,20 two on duration of collection (h),20, 25 two on 24‐hour urine volume (mL/d),20, 25 and four on self‐report of missing or spilled urine.18, 20, 22, 24 The included studies did not consistently report on sensitivity and specificity or mean analyte composition based on PABA criteria. Of the five studies18, 20, 22, 23, 24 that reported data on sensitivity and specificity of the test method in relation to PABA recovery criteria for completion, three studies included data on creatinine index (the ratio of observed to expected creatinine) as a test method,20, 22, 23 two on the ratio of creatinine to body weight,18, 20 one on the combination of creatinine to urine volume,20 and three on self‐report of missing or spilled urine (Table 3).18, 23, 24 All three studies that used creatinine index as a criteria, stratified cutoffs based on sex and calculated expected creatinine based on observed creatinine divided by body weight modified based on sex.20, 22, 23 Four studies included data on mean 24‐hour urine analyte and other urine collection characteristics for specimens considered complete and incomplete defined by PABA recovery criteria (Table 4).19, 20, 21, 25 All four studies included data on creatinine excretion,19, 20, 21, 25 two on a ratio of creatinine to body weight,20, 25 two on self‐report timing of collection,20, 25 two on urine volume,20, 25 and one on self‐reported amount of missing urine volume.20
Table 3.
Sensitivity, Specificity, Positive Predictive Value, and Positive Likelihood Ratios of Test Criteria for Identifying Incomplete 24‐Hour Urine Collection Based on PABA Recovery Criteria
| Is 24‐Hour Urine Collection Incomplete by PABA Recovery? | |||||||||||
|---|---|---|---|---|---|---|---|---|---|---|---|
| Definition of Incomplete 24‐Hour Urine Collection | Group (eg, Men) | 24‐Hour Urine Collections, No. | Yes | No | Sensitivity, % | Specificity, % | Positive Predictive Value, % | Positive Likelihood Ratio,% | |||
| PABA Recovery Criteria | Test Method | Incomplete by Test Method | |||||||||
| Yes | No | Yes | No | ||||||||
| Creatinine | |||||||||||
| C <85% | Cr indexa <0.7 | Total23 | 541 | 18 | 19 | 61 | 443 | 48.7 | 87.9 | 22.8 | −.56 |
| Men23 | 278 | 6 | 12 | 15 | 245 | 33.3 | 94.2 | 28.6 | −.36 | ||
| Women23 | 263 | 12 | 7 | 46 | 198 | 63.2 | 81.2 | 20.7 | −.79 | ||
| Total20 | 654 | 17 | 19 | 7 | 611 | 47.2 | 98.9 | 70.8 | −.48 | ||
| Cr indexb <0.7 | Total23 | 541 | 3 | 34 | 11 | 493 | 8.1 | 97.8 | 21.4 | −.08 | |
| Men23 | 278 | 1 | 17 | 7 | 253 | 5.6 | 97.3 | 12.5 | −.06 | ||
| Women23 | 263 | 2 | 17 | 4 | 240 | 10.5 | 98.4 | 33.3 | −.11 | ||
| Cr indexa <0.6 | Total20 | 654 | 7 | 29 | 3 | 615 | 19.4 | 99.5 | 70.0 | −.20 | |
| Men22 | 102 | 2 | 27 | 1 | 72 | 6.9 | 98.6 | 66.7 | −.07 | ||
| Women22 | 83 | 2 | 13 | 1 | 67 | 13.3 | 98.5 | 66.7 | −.14 | ||
| Ratio Cr, mg/d to BW, kg | Total20, c | 654 | 4 | 32 | 15 | 603 | 11.1 | 97.6 | 21.1 | −.12 | |
| Total20, d | 654 | 6 | 30 | 267 | 351 | 16.7 | 56.8 | 2.2 | −.30 | ||
| H <85 and >110% | Total18, d | 681 | 55 | 188 | 134 | 304 | 22.6 | 69.4 | 29.1 | −.33 | |
| Combination creatinine and urine volume | |||||||||||
| C <85% | Cr level + total urine volume | Total20, e | 654 | 8 | 28 | 2 | 616 | 22.2 | 99.7 | 80.0 | −.23 |
| Self‐report | |||||||||||
| C <70%; C >110% and H <78% or >110% | ≥1 missed void | Total24 | 941 | 22 | 201 | 76 | 642 | 9.9 | 89.4 | 22.4 | −.11 |
| Took PABA24 | 848 | 12 | 121 | 75 | 640 | 9.0 | 89.5 | 13.8 | −.10 | ||
| >1 missed void | Total24 | 941 | 8 | 215 | 2 | 716 | 3.6 | 99.7 | 80.0 | −.04 | |
| Took PABA24 | 848 | 6 | 127 | 2 | 713 | 4.5 | 99.7 | 75.0 | −.05 | ||
| C <85% | In‐complete | Men22 | 99 | 6 | 22 | 2 | 69 | 21.4 | 97.2 | 75.0 | −.22 |
| Women22 | 83 | 5 | 10 | 1 | 67 | 33.3 | 98.5 | 83.3 | −.34 | ||
| H <85 & >110% | ≥1 missed void (Q1) | Total18, f | 681 | 15 | 228 | 21 | 417 | 6.2 | 95.2 | 41.7 | −.07 |
| Urine missing other reason (Q2) | Total18, g | 681 | 77 | 166 | 101 | 337 | 31.7 | 76.9 | 43.3 | −.42 | |
| Q1 or Q2 | Total18, h | 681 | 80 | 163 | 105 | 333 | 32.9 | 76.0 | 43.2 | −.44 | |
| Q1 and Q2 | Total18, i | 681 | 12 | 231 | 17 | 421 | 4.9 | 96.1 | 41.4 | −.05 | |
Abbreviations: BW, body weight (kg); C, PABA recovery based on the colorimetric method; Col, collections; Cr, urinary creatinine; H, para‐aminobenzoic acid recovery based on the high‐performance liquid chromatography method. aCreatinine ratio derived from Joossens et al32 where cutoffs for men and women were calculated separately. Men=(urinary creatinine, mg/d)/(24*BW); women=(urinary creatinine, mg/d)/(21*BW). bCreatinine ratio observed to expected creatinine excretion with expected calculated from the following regression equation: expected Cr=9.36–3.14(sex)+0.07(weight)+0.09(sex*weight)−0.09(age)+0.02(protein). cDerived from the World Health Organization Regional Office for Europe. Estimation of sodium intake and output: review of methods and recommendations for epidemiological studies. Report on WHO meeting by the WHO collaborating center for research and training in cardiovascular diseases. Geneva: World Health Organization; 1984. Participants with a ratio of Cr to BW of <10.8 or >25.2 were identified as having incomplete urine. dDerived from Malekshah AF, Kimiagar M, Saadatian‐Elahi M, et al. Validity and reliability of a new food frequency questionnaire compared to 24 h recalls and biochemical measurements: pilot phase of Golestan cohort study of esophageal cancer. Eur J Clin Nutr. 2006;971–977. Participants with a ratio of Cr to BW of <11 or >20 were identified as having incomplete urine. eDerived from Reinvuo H, Valsta LM, Laatikainen T, et al. Sodium in the Finnish diet II. Trends in dietary sodium intake and comparison between intake and 24‐hour excretion of sodium. Eur J Clin Nutr. 2006;60:1160–1167. Participants with urinary creatinine level <6 mmol/d plus total urine volume <1000 mL/d with a urinary creatinine level <5 mmol/d were identified as having incomplete urine. fQuestion 1 asked the following: “During the 24‐hour urine collection period, did you always void into the urine collection container?” An incomplete collection was defined as answering no to this question. gQuestion 2 asked the following: “Is any urine missing from the collection for any other reason?” An incomplete collection was defined as answering yes to this question. hIf one or both of the responses to the questions were incomplete, the participants' samples were considered incomplete. iIf the responses to both questions were incomplete, the participants' samples were considered incomplete.
Table 4.
Test Criteria Average (±Standard Deviation) Values for Completion of 24‐Hour Urine Collection by PABA Recovery Criteria
| Test Criteria | Group | 24‐Hour Urine Collection Complete by PABA Recovery (>85%) | Differencea | P Valueb | |||
|---|---|---|---|---|---|---|---|
| N | Yes | N | No | ||||
| Creatinine, mmol/d | Total20 | 604 | 9.11±1.4 | 50 | 6.99±1.7 | 2.12 | <.0001 |
| Total25 | 45 | 10.8±3.0 | 18 | 9.3±2.7 | 1.5 | .0703 | |
| Total21 | 135 | 8.93±2.65 | 122 | 8.31±2.65 | 0.62 | .0622 | |
| Men19 | 63 | 16.0±2.9 | 12 | 13.7±2.8 | 2.3 | .0135 | |
| Women19 | 42 | 11.0±2.0 | 9 | 10.0±1.7 | 1.0 | .1699 | |
| Ratio Cr, mmol to BW, kg | Total20 | 604 | 0.194±0.024 | 50 | 0.146±0.032 | 0.048 | <.0001 |
| Total25 | 45 | 0.16±0.04 | 18 | 0.13±0.04 | 0.03 | .0092 | |
| Self‐report collection time, h | Total20 | 604 | 23.9±0.5 | 50 | 23.9±0.8 | 0 | 1.000 |
| Total25 | 45 | 23.8±0.8 | 18 | 23.6 ±0.9 | 0.2 | .3904 | |
| Total urine volume, mL/d | Total20 | 604 | 1094±506 | 50 | 933±533 | 161 | .0317 |
| Total25 | 45 | 1788±663 | 18 | 1692±971 | 96 | .6528 | |
| Self‐report missing volume, mL/d | Total20 | 604 | 19±66 | 50 | 67±92 | –48 | <.0001 |
Abbreviations: BW, body weight (kg); Cr, creatinine excretion. aDifference was calculated by subtracting the mean recovery of the analyte for complete urine collections by mean recovery for incomplete urine collections based on para‐aminobenzoic acid (PABA) recovery criteria. bStudent unpaired t test, assuming equal variances, was used to assess whether difference in means by complete vs incomplete urine collections were significant (assessed at .05).
Across four studies that assessed creatinine as a test method (using either a creatinine index or ratio of creatinine to body weight), the sensitivity of creatinine criteria ranged from 5.6% to 63.2% and the specificity ranged from 56.8% to 99.7% (Table 3).18, 20, 22, 23 Across three studies that assessed self‐report of missing or spilled urine, the sensitivity ranged from 3.6% to 33.3% and the specificity from 76.0% to 99.7% (Table 3).18, 22, 24 In one study that assessed the combination of creatinine criteria and urine volume as a test method, the sensitivity was 22% and the specificity was 99.7% (Table 3). Positive predictive value (PPV) varied by test method used and by prevalence of incomplete collections; for example, in one study, the PPV ranged from 2% to 71% (Table 3).20 All studies had negative likelihood ratios ranging from −.04 to −.79 (Table 3).
Although not always statistically significant in individual studies, average 24‐hour urinary creatinine excretions and volumes were greater for complete vs incomplete collection in pooled analyses (Table 4, Figure A–C), whereas average duration (self‐reported collection time) did not differ based on completion (P=.73, Figure D). In the one study that assessed it,20 self‐reported missed urine volume (mL/d) was lower among complete vs incomplete collections assessed by PABA recovery (>85%) (Table 4). Substantial heterogeneity was found in pooled mean difference estimates of 24‐hour creatinine (mmol) and sodium excretion (mmol) (Figure A and E, respectively).
Figure 1.
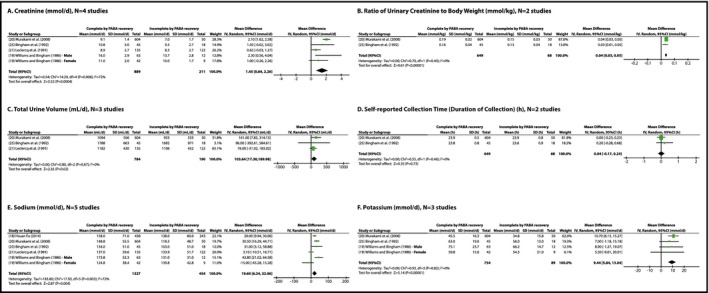
Pooled mean differences of complete vs incomplete urine collections based on para‐aminobenzoic acid (PABA) recovery criteria using various test criteria for analysis or nutrients recovered. Total refers to the total number of 24‐hour urine collections for each study. Williams and Bingham19 is one study, with data subgrouped by sex.
Six of the eight studies evaluated 24‐hour sodium or potassium excretion by completion status of collections according to PABA recovery criteria (Table S3). One study provided data for two groups: men and women.19 When the studies were pooled, average 24‐hour sodium excretion for complete collection was 19.6 mmol greater and potassium excretion was 9.4 mmol greater than that for incomplete collections (Figure E and F).
Discussion
Of the test criteria evaluated in these studies, ie, self‐report of missing urine, creatinine index (ratio of observed 24‐hour urinary creatinine excretion to expected excretion based on sex), or a combination of creatinine excretion and total urine volume, none were identified as significantly more accurate than the others in relation to PABA recovery criteria. In addition, no one criterion appeared more accurate for identifying incomplete 24‐hour urine collections. Overall, of the approaches to verify completeness in the included studies, the most sensitive method for ruling out incomplete urine collection was a creatinine index <0.7 based on expected creatinine calculated by sex and body weight. In general, the PPV varied as a result of variable prevalence of incomplete collections and test methods used. The majority of included test methods were highly specific suggesting that they correctly identified those collections characterized as incomplete, but were unable to detect a proportion of true incomplete collections. The pooled analyses provided evidence that both mean sodium and potassium differed by completion status; however, the unknown true prevalence of incomplete collections (incomplete collections undetected as a result of the specific diagnostic limitations in PABA recovery) and the variability in participants characteristics and behaviors, and in mean sodium by study, subsequently creates misgivings that these analytes differ by completion status. The differences in average values of 24‐hour urine creatinine alone or in ratio to body weight, total urine volume, and self‐reported missing urine volume by completion of 24‐hour urine collection based on PABA recovery criteria suggests that each of these methods may have some value in identifying incomplete collection at the group or population level. Few studies combined criteria.
The intention of the meta‐analyses was to determine whether there was evidence of a significant difference in analyte concentration/test method based on defined completeness of 24‐hour urine collections by the study and whether this difference was consistent across studies evaluating the same criteria. Due to the diverse methods and measurements, separate comparisons were generated to eliminate potential bias by combining outcomes, eg, creatinine concentration, creatinine ratio, and creatinine index. Substantial statistical heterogeneity was found separately in pooled creatinine (mmol/d) and sodium (mmol/d) analyses. The heterogeneity seen in both evaluations could be the result of clinical diversity in participants selected in each study. For example, the older population seen in Leclerq and colleagues'21 study, the subgrouping by sex seen in William and Binghams19 study, and the gastroenterology outpatients (diagnoses ranging from large bowel disorders to upper gastrointestinal tract disease) used in Bingham and colleagues' study25 could contribute to physiological differences that would affect ascertainment of the analytes, as seen in the differences in direction and magnitude of the effect seen in each study. While the participants in this review had a vast age range and possibly differed in dietary habits and health, participant characteristics cannot explain all of the observed heterogeneity, as no heterogeneity was observed in some analyses. Since none of the studies provided their protocol used, it is possible that some bias could have been introduced by unstated specifications of the 24‐hour collection. For example, some of the analyses included only two studies.
Changes in glomerular filtration rate (GFR) and kidney function, frequency of voiding, lean body mass, food intake, medication use, and altered gastrointestinal absorption may alter creatinine and PABA excretion as well as total urine volume.21 Of the eight studies included, four excluded individuals with chronic kidney disease (CKD),18, 23, 24, 25 one excluded elderly individuals with acute or terminal illness,21 and one study excluded participants taking medications for chronic disease.22 The other two studies did not specify the health of their participants, but were conducted among young adults ranging in age from 18 to 46 years, who may be less affected by chronic disease.19, 20 The four studies that did not specify whether they excluded participants with CKD did not provide information on serum creatinine, urinary protein, or estimated GFR, limiting our ability to assess whether variability in results were related to impaired kidney function. It is possible that unknown physiological differences in participants' health may have affected observed creatinine or PABA excretion.
Variation in meat consumption is one potential explanation for the poor sensitivity of creatinine‐based determination of complete urine collection when compared with PABA excretion.6, 21 In none of the studies were participants assigned to a diet with specific meat intake. In one study that estimated expected creatinine with and without estimated dietary protein intake (total protein intake from meat and nonmeat sources), the ratio of measured to expected creatinine without accounting for estimated protein intake had a higher sensitivity in relation to PABA recovery.23
The lack of difference in timing of urine collection by PABA recovery criteria is of interest. Timing of urine collection was based on the individual's self‐reported record of start and end time of their 24‐hour collection period. Depending on the individual's ability to record this accurately, there may be random error in this measurement. Complete collections were found to have a narrower distribution than incomplete collections, indicating less precision in the measurement of incomplete collections. Lack of difference between categorization of collection completeness using average self‐reported collection time could also be due to balance between undercollections and overcollections. In INTERSALT28 and INTERMAP,29 the start and end of the 24‐hour urine collections were observed and recorded by a separate trained observer in a medical examination center and likely to be more accurate. Start and stop times were not observed in any of the studies. Furthermore, PABA excretion is typically very low near the end of its dose interval (ie, 8 hours) and hence the PABA method of assessing completeness of urine collection is not likely to be sensitive to variation in self‐reported collection time (duration of collection) if it is over a modest amount (eg, 1 hour) or if relates to overcollection.
Among the studies reviewed, the average 24‐hour sodium and potassium excretion did not appear to be significantly biased by including incomplete collections as determined by PABA recovery criteria. However, the impact of including incomplete collections on assessing excess sodium intake or inadequate potassium intake could be greater with a larger percentage of participants with incomplete collections. Compared with the studies evaluated here, it is possible that a greater percentage of individuals could be excluded because of incomplete collection in population studies.
Study Limitations
To our knowledge, this is the first systematic review of studies on the accuracy of test methods for differentiating incomplete 24‐hour urine collections. The lack of consistency in data collected, published detailed protocol instructions, criteria used to define incomplete 24‐hour urine collection, laboratory methods for assessing excretion levels, and lack of similar statistics limited our ability to combine data and compare test methods across studies. Unfortunately, none of the included studies used consecutive or nonconsecutive 24‐hour urine collections to evaluate differences in creatinine or PABA excretion between repeat collections. Hence, we were unable to determine the impact of repeat 24‐hour urine collections on completion and our conclusions remain limited to the 24‐hour time period in which collections were examined among included studies. We did not attempt to contact any authors for any unpublished or supplemental data that might have been left out of their publications. Contacting authors for data and conducting further analysis using similar criteria and statistics to identify incomplete 24‐hour urine collection across studies could, for example, determine whether using a combination of test methods was more accurate than using a single method. Possible publication bias could have been introduced due to the inclusion of studies that reported only significant data on both complete and incomplete collections.
Of the studies reviewed, a large majority focused on use of creatinine, PABA, and self‐reports for assessment of completion of the collected 24‐hour urine from participants. Each method has strengths and limitations concerning dependence of the participants, dose recoveries of the biomarkers, laboratory procedures, and ability to correct for possible associations (Table 5). Further, as few investigators use PABA because of the increased burden to participants, the assumptions and errors inherent in its use as a gold standard may not be adequately described. As mentioned, in using PABA, missing urine may go undetected at the end of each dose interval (~8 hours); differences in clearance may be associated with age, gastrointestinal absorption, and chronic disease; meal timing could affect dosing schedule; and laboratory recovery methods still have some inherent error (HPLC is considered more reliable than the colorimetric method)24 (Table 5). The feasibility and cost could limit the use of HPLC analyses.
Table 5.
Strengths and Limitations of the Various Methods Used for Determination of Completeness of 24‐Hour Urine Collections
| Method | Rationale | Strengths | Limitations |
|---|---|---|---|
| 24‐Hour urinary creatinine, usually expressed as a ratio of observed to expected (predicted) urinary creatinine excretion at various thresholds, eg, <0.7 | 24‐Hour urinary creatinine excretion is an indicator of lean body mass31; can be reliably predicted from age, sex, and body weight23, 32; and is assumed to vary little from day to day33 |
|
|
| PABA recovery over a 24‐hour period greater than a specified threshold (typically ≥85%) | More than 90% of PABA consumed is excreted in urine over 24 hours. Participants take three 80 mg para‐aminobenzoic acid tablets at designated times (with meals). PABA is a nontoxic B vitamin not commonly consumed in foods |
|
|
| Self‐report of missed voids using a questionnaire, eg, “missing more than a few drops,” “missing at least one void” | Participants reliably report missed urine | ||
| 24‐hour urine volume less than a specific threshold, eg, <250 mL29 | “The maximal concentrating ability of the kidney dictates the minimal urine volume that must be excreted each day to rid the body of waste products of metabolism and ingested ions is estimated at 500 mL.45 |
|
|
| Timed duration of 24‐hour urine collection (typical range between 20 and 28 hours), either observed by study staff or self‐reported by the participant | Accurate timing essential for adjusting the amount of analyte excreted to 24 hours |
|
|
Abbreviations: ADH, antidiuretic hormone; COV, coefficient of variation; HPLC, high‐performance liquid chromatography; PABA, para‐aminobenzoic acid.
Both methodological limitations and the heterogeneous nature of participants of included studies hindered inferences that could be made about the accuracy of methods to assess completion of 24‐hour urine collection. In designing future studies on the accuracy of test methods to identify incomplete urine collection, investigators may want to consider a variety of protocols to ensure completeness of 24‐hour urine collection through data collection as well as test methods used to exclude incomplete specimens post‐collection. For example, as stated earlier, some previous population studies started and ended collection in person rather than at home; although it is unclear whether this increases completion of urine collection, it ensures accurate timing. A few studies also used PABA supplementation and recovery.8 Starting and ending collection in person in addition to PABA supplementation adds burden and cost to a survey or study. Furthermore, other environmental factors (eg, seasonal or geographic temperature and humidity) and behaviors (excessive physical activity) could increase fluid intake and loss of sodium or other analytes through sweat and decrease the amount excreted through urine.8 These factors might be considered when planning urine collection or comparing across surveys.
Perspectives
Twenty‐four–hour urine collections are the gold standard for assessing sodium intake through urinary excretion in both individuals and populations30 and their accuracy can impact the need for and evaluation of dietary salt reduction policies and interventions.5 The ability to verify whether a 24‐hour urine collection is complete is mired by a lack of agreement on a standard parameter to use for assessment. The absence of a gold standard is possibly related to the various shortcoming and relative daily fluctuations of each parameter. In our review, we found that no single test method accurately identified incomplete urine collection. Although the differences in average 24‐hour sodium and potassium excretions for complete and incomplete collections were statistically significant, the average magnitude was not large and varied across studies. Depending on the proportion, the inclusion of participants with incomplete 24‐hour collection may not bias the population estimates of 24‐hour urine sodium excretion; however, if incomplete collection is associated with illness or disease, it could affect the associations with health indicators.24 In population surveys and studies, it is preferable to use explicit instructions, monitoring, and ask participants to repeat collection if potentially incomplete to ensure complete and accurately timed 24‐hour urine collection, such as the methods used in INTERSALT and INTERMAP.28, 29 Assessment of incomplete urine collection using PABA recovery criteria in a random sample of participants could provide information on the potential bias in estimates of sodium and potassium intake and the usefulness of PABA recovery in determining whether 24‐hour urine collection is complete. One study evaluated a combination of methods to assess incomplete urine collection post hoc with urine collection having to meet both creatinine and volume criteria. This approach could increase specificity, but potentially reduce sensitivity, missing some incomplete urine collections. Using a combination of methods post hoc to detect incomplete 24‐hour urine collection (eg, having less than expected creatinine excretion or inadequate urine volume or self‐report of missing or spilled voids) could increase sensitivity but also may result in excluding a substantial proportion of individuals who have complete urine collection (false negatives).
Conclusions
Across the studies evaluated, the most sensitive method compared with PABA recovery for ruling out incomplete 24‐hour urine specimens postcollection was a creatinine index <0.7 based on sex and body weight. The application of this criterion deserves further investigation in comparison with using multiple criteria to exclude potentially incomplete specimens. Further studies and population surveys might evaluate results with and without exclusion of potential incomplete urine collection to help determine the impact of complete urine collection on estimates of sodium intake at the population level and in relation to health outcomes.
Supporting information
Figure S1A. Flow chart depicting study screening and selection process for systematic review of studies that assessed completeness of 24‐hour urine collections by both para‐amino benzoic acid (PABA) and another test method (First Librarian Search employing databases from 1823–present).
Figure S1B. Flow chart depicting study screening and selection process for systematic review of studies that assessed completeness of 24‐hour urine collections by both para‐amino benzoic acid (PABA) and another test method (Second Librarian Search employing databases from 1937–present).
Figure S2. Risk bias summary.
Appendix S1. PRISMA 2009 Checklist.
Table S1. Online Search Strategy for Medline (Ovid MEDLINE In‐Process & Other Non‐Indexed Citations and Ovid MEDLINE 1946–Present).
Table S2. Risk of Bias Assessment Checklist.
Table S3. Average 24‐Hour Sodium or Potassium Excretion by Study and Completion Status Based on Para‐Aminobenzoic Acid (PABA) Recovery Criteria.
Statement of Financial Disclosure
This work was supported by the Centers for Disease Control and Prevention (CDC), Division for Heart Disease and Stroke Prevention, Rollins School of Public Health, Emory University, and was supported by an appointment to the Research Participation Program for the CDC administered by the Oak Ridge Institute for Science and Education through an inter‐agency agreement between the Department of Energy and the CDC.
Acknowledgments
The findings and conclusions in this report are those of the authors and do not necessarily represent the official position of the CDC.
Conflict of Interest
The authors have no conflicts of interest to disclose.
J Clin Hypertens (Greenwich). 2016;18:456–467. 10.1111/jch.12763. © 2016 Wiley Periodicals, Inc.
References
- 1. Henney JE, Taylor CL, Boon CS, eds. Strategies to Reduce Sodium Intake in the United States. Washington, DC: The National Academies Press, Institute of Medicine; 2010. [PubMed] [Google Scholar]
- 2. Aburto N, Hanson S, Gutierrez H, et al. Effect of increased potassium intake on cardiovascular risk factors and disease: a systematic review and meta‐analyses. BMJ. 2013;346:1–19. [DOI] [PMC free article] [PubMed] [Google Scholar]
- 3. Aburto N, Ziolkovska A, Hooper L, et al. Effect of lower sodium intake on health: systematic review and meta‐analysis. BMJ. 2013;346:1–20. [DOI] [PMC free article] [PubMed] [Google Scholar]
- 4. Panel on Dietary Reference Intakes for Electrolytes and Water Standing Committee on the Scientific Evaluation of Dietary Reference Intakes. Dietary Reference Intakes for Water, Potassium, Sodium, Chloride, and Sulfate. Washington, DC: The National Academies Press; 2005. [Google Scholar]
- 5. WHO/PAHO Regional Expert Group for Cardiovascular Disease Prevention through Population‐wide Dietary Salt Reduction . Protocol for Population Level Sodium Determination in 24‐hour Urine Samples. http://new.paho.org/hq/dmdocuments/2010/pahosaltprotocol.pdf. Published May 2010. Accessed July 22, 2015.
- 6. Elliott P, Brown I. Sodium Intakes Around the World. Background document prepared for the Forum and Technical meeting on Reducing Salt Intake in Populations (Paris 5‐7th October 2006). Geneva, Switzerland: WHO Press; 2007. http://www.who.int/dietphysicalactivity/Elliot-brown-2007.pdf. Accessed July 22, 2015 [Google Scholar]
- 7. Turban S, Miller ER III, Ange B, Appel LJ. Racial differences in Urinary Potassium Excretion. J Am Soc Nephrol. 2008;19:1396–1402. [DOI] [PMC free article] [PubMed] [Google Scholar]
- 8. Cogswell ME, Maalouf J, Elliott P, et al. Use of urine biomarkers to assess sodium intake: challenges and opportunities. Annu Rev Nutr. 2015;35:349–387. [DOI] [PMC free article] [PubMed] [Google Scholar]
- 9. Hulthen L, Klinberg A, Hallenberg E, et al. Salt intake in young Swedish men. Public Health Nutr. 2010;13:601–605. [DOI] [PubMed] [Google Scholar]
- 10. Food Standards Agency . National Diet and Nutrition Survey: results from Years 1 to 4 (combined) of the rolling programme for 2008/ 2009 and 2011/2012. Public Health England; 2014. https://www.gov.uk/government/uploads/system/uploads/attachment_data/file/310997/NDNS_Y1_to_4_UK_report_Executive_summary.pdf. Accessed July 22, 2015.
- 11. Scottish Centre for Social Research . A survey of 24 hour urinary sodium excretion in a representative sample of the Scottish population as a measure of salt intake. Published April 2011. http://www.food.gov.uk/sites/default/files/681-1-1229_S14047.pdf. Accessed July 22, 2015.
- 12. Bingham S, Cummings JH. The use of 4‐aminobenzoic acid as marker to validate the completeness of 24 h urine collections in man. Clin Sci. 1983;64:629–635. [DOI] [PubMed] [Google Scholar]
- 13. Jakobsen J, Pederson AN, Ovesen L. Para‐aminobenzoic acid (PABA) used as a marker for completeness of 24 hour urine: effects of age and dosage scheduling. Eur J Clin Nutr. 2003;57:138–142. [DOI] [PubMed] [Google Scholar]
- 14. Bingham S, Cummings JH. The use of creatinine output as a check on the completeness of 24‐hour urine collections. Hum Nutr: Clin Nutr. 1985;39C:343–353. [PubMed] [Google Scholar]
- 15. Centers for Disease Control and Prevention, Division for Heart Disease and Stroke Prevention. Sodium: Q&A Salt. 2014. http://www.cdc.gov/salt/pdfs/Sodium_QandA.pdf. Accessed November 12, 2014. [Google Scholar]
- 16. Bentor Y. Chemical Element ‐ Potassium. 2014. http://www.chemicalelements.com/elements/k.html. Accessed November 12, 2014.
- 17. Deeks JJ, Higgins JP, Altman DG, Cochrane Statistical Methods Group . Analysing data and undertaking meta‐analyses. In: Higgins JPT, Green S, eds. Cochrane Handbook for Systematic Reviews of Interventions. Version 5.0.0. The Cochrane Collaboration. Chichester, United Kingdom; John Wiley & Sons: 2008. http://handbook.cochrane.org/v5.0.0/. Accessed July 22, 2015. [Google Scholar]
- 18. Fu WH. Use of para‐aminobenzoic acid for validating 24‐hour urine completeness in a sodium‐blood pressure population study [master's thesis]. Hamilton, Ontario, Canada: Medical Sciences, McMaster University; 2014. [Google Scholar]
- 19. Williams DRR, Bingham S. Sodium and potassium intakes in a representative population sample: estimation from 24 h urine collections known to be complete in a Cambridgeshire village. Br J Nutr. 1986;55:13–22. [DOI] [PubMed] [Google Scholar]
- 20. Murakami K, Sasaki S, Takahashi Y, et al. Sensitivity and specificity of published strategies using urinary creatinine to identify incomplete 24‐h urine collection. Nutrition. 2008;24:16–22. [DOI] [PubMed] [Google Scholar]
- 21. Leclercq C, Maiani G, Polito A, Ferro‐Luzzi A. Use of PABA test to check completeness of 24‐h urine collections in elderly subjects. Nutrition. 1991;7:350–354. [PubMed] [Google Scholar]
- 22. Knuiman JT, Hautvast GAJ, Van Der Heyden L, et al. A multi‐centre study on the completeness of urine collection in 11 European centres: some problems with the use of creatinine and 4‐aminobenzoic acid as markers of completeness in the collection. Hum Nutr: Clin Nutr. 1986;40C:229–237. [PubMed] [Google Scholar]
- 23. De Keyzer W, Huybrechts I, Dekkers ALM, et al. Predicting urinary creatinine excretion and its usefulness to identify incomple 24 h urine collections. Br J Nutr. 2012;108:1118–1125. [DOI] [PubMed] [Google Scholar]
- 24. Subar AF, Midthune D, Tasevska N, et al. Checking for completeness of 24‐h urine collection using para‐amino benzoic acid not necessary in the Observing Protein and Energy Nutrition Study. Eur J Clin Nutr. 2013;67:863–867. [DOI] [PubMed] [Google Scholar]
- 25. Bingham S, Murphy J, Waller E, et al. Para‐amino benzoic acid in the assessment of completeness of 24‐hour urine collections from hospital outpatients and the effect of impaired renal function. Eur J Clin Nutr. 1992;46:131–135. [PubMed] [Google Scholar]
- 26. Charlton KE, Steyn K, Levitt NS, et al. Ethnic differences in sodium intake and excretion of sodium, potassium, calcium, and magnesium in South Africans. Eur J Cardiovasc Prev Rehabil. 2005;12:355–362. [DOI] [PubMed] [Google Scholar]
- 27. Johansson G, Bingham S, Vahter M. A method to compensate for incomplete 24‐hour urine collections in nutritional epidemiology studies. Public Health Nutr. 1999;2:587–591. [DOI] [PubMed] [Google Scholar]
- 28. Rose G, Stamler J. The INTERSALT study: background, methods and main results. INTERSALT Co‐operative Research Group. J Hum Hypertens. 1989;3:283–288. [PubMed] [Google Scholar]
- 29. Stamler J, Elliott P, Dennis B, et al. INTERMAP: background, aims, design, methods, and descriptive statistics (nondietary). J Hum Hypertens 2003;17:591–608. [DOI] [PMC free article] [PubMed] [Google Scholar]
- 30. Ji C, Sykes L, Paul C, et al. Systematic review of studies comparing 24‐hour and spot urine collections for estimating population salt intake. Rev Panum Salud Publica. 2012;32:307–315. [DOI] [PubMed] [Google Scholar]
- 31. Forbes GB, Bruining GJ. Urinary creatinine excretion and lean body mass. Am J Clin Nutr. 1976;29:1359–1366. [DOI] [PubMed] [Google Scholar]
- 32. Joossens JV, Geboers J. Monitoring the Salt Intake of the Population: Methodological Considerations. Ghent, Belgium: EC Workshop; 1983. [Google Scholar]
- 33. Pollack H. Creatinine excretion as index for estimating urinary excretion of micronutrients or their metabolic end products. Am J Clin Nutr. 1970;23:865–867. [DOI] [PubMed] [Google Scholar]
- 34. Webster J, Garrow JS. Creatinine excretion over 24 hours as a measure of body composition or of completeness of urine collection. Hum Nutr: Clin Nutr. 1985;39C:101–106. [PubMed] [Google Scholar]
- 35. Vestergaard P, Leverett R. Constancy of urinary creatinine excretion. J Lab Clin Med. 1958;51:211–218. [PubMed] [Google Scholar]
- 36. Paterson N. Relative constancy of 24‐hour urine volume and 24‐hour creatinine output. Clin Chim Acta. 1967;18:57–58. [DOI] [PubMed] [Google Scholar]
- 37. Heymsfield SB, Arteaga C, McManus C, et al. Measurement of muscle mass in humans: validity of the 24‐hour urinary creatinine method. Am J Clin Nutr. 1983;37:478–494. [DOI] [PubMed] [Google Scholar]
- 38. Kroos DS, Mays JE, Harris SA. A model to predict 24‐h urinary creatinine using repeated measurements in an occupational cohort study. J Exposure Sci Environ Epidemiol. 2010;20:516–525. [DOI] [PubMed] [Google Scholar]
- 39. Gibson RS. Assessment of protein status. In: Principles of Nutritional Assessment. 2nd ed. New York, NY: Oxford University Press; 2005. [Google Scholar]
- 40. Jakobsen J, Ovesen L, Fagt S, Pederson AN. Para‐aminobenzoic acid used as a marker for completeness of 24 hour urine: assessment of control limits for specific HPLC method. Eur J Clin Nutr. 1997;51:514–519. [DOI] [PubMed] [Google Scholar]
- 41. Rhee M‐Y, Shin S‐J, Kim S‐W. Sodium intake of a city population in Korea estimated by 24‐h urine collection method. Eur J Clin Nutr. 2013;67:875–880. [DOI] [PubMed] [Google Scholar]
- 42. Sharma RS, Joy RC, Boushey CJ, et al. Effects of para‐aminobenzoic acid (PABA) form and administration mode on PABA recovery in 24‐hour urine collections. J Acad Nutr Diet 2014;114:457–463. [DOI] [PubMed] [Google Scholar]
- 43. Wang C‐Y, Cogswell ME, Loria CM, et al. Urinary excretion of sodium, potassium, and chloride, but NOT iodine, varies by timing of colleciton in a 24‐hour calibration study. J Nutr: Nutr Epidemiol. 2013;143:1276–1282. [DOI] [PMC free article] [PubMed] [Google Scholar]
- 44. Park E‐K, Tagles HD, Gee SJ, et al. Recruiting strategy and 24‐hour biomonitoring or paraquat in agricultural workers. J Agramedicine. 2008;13:207–217. [DOI] [PMC free article] [PubMed] [Google Scholar]
- 45. Hall JE. Urine Concentration and Dilution: Regulation of Extracellular Fluid Osmolarity and Sodium Concentration. Guyton and Hall Textbook of Medical Physiology. 12th ed. Canada: Saunders Elsevier; 2011:345–360. [Google Scholar]
Associated Data
This section collects any data citations, data availability statements, or supplementary materials included in this article.
Supplementary Materials
Figure S1A. Flow chart depicting study screening and selection process for systematic review of studies that assessed completeness of 24‐hour urine collections by both para‐amino benzoic acid (PABA) and another test method (First Librarian Search employing databases from 1823–present).
Figure S1B. Flow chart depicting study screening and selection process for systematic review of studies that assessed completeness of 24‐hour urine collections by both para‐amino benzoic acid (PABA) and another test method (Second Librarian Search employing databases from 1937–present).
Figure S2. Risk bias summary.
Appendix S1. PRISMA 2009 Checklist.
Table S1. Online Search Strategy for Medline (Ovid MEDLINE In‐Process & Other Non‐Indexed Citations and Ovid MEDLINE 1946–Present).
Table S2. Risk of Bias Assessment Checklist.
Table S3. Average 24‐Hour Sodium or Potassium Excretion by Study and Completion Status Based on Para‐Aminobenzoic Acid (PABA) Recovery Criteria.