

Abstract
Within the human population, there is large inter-individual variability in the timing of sleep and circadian rhythms. This variability has been attributed to individual differences in sleep physiology, circadian physiology, and/or light exposure. Recent experimental evidence suggests the latter is necessary to evoke large inter-individual differences in sleep and circadian timing. We used a validated model of human sleep and circadian physiology to test the hypothesis that intrinsic differences in sleep and circadian timing are amplified by self-selected use of artificial light sources. We tested the model under two conditions motivated by an experimental study: (i) a “natural” light cycle, and (ii) a “realistic” light cycle that included attenuation of light due to living indoors when natural light levels are high and use of electric light when natural light levels are low. Within these conditions, we determined the relationship between intrinsic circadian period (within the range 23.7–24.6 h) and timing of sleep onset, sleep offset, and circadian rhythms. In addition, we simulated a work week, with fixed wake time for five days and free sleep times on weekends. Under both conditions, a longer intrinsic period resulted in later sleep and circadian timing. Compared to the natural condition, the realistic condition evoked more than double the variation in sleep timing across the physiological range of intrinsic circadian periods. Model predictions closely matched data from the experimental study. We found that if the intrinsic circadian period was long (>24.2 h) under the realistic condition, there was significant mismatch in sleep timing between weekdays and weekends, which is known as social jet-lag. These findings indicate that individual tendencies to have very delayed schedules can be greatly amplified by self-selected modifications to the natural light/dark cycle. This has important implications for therapeutic treatment of advanced or delayed sleep phase disorders.
Keywords: social jetlag, self-selection, mathematical modeling, sleep-wake timing, circadian rhythms, light exposure
1. Introduction
Sleep timing in the real world is highly variable across individuals, as has been documented using large-scale surveys (Roenneberg et al., 2007; Walch et al., 2016). The term “chronotype” is used to describe an individual’s preferred sleep timing, typically measured on non-work (free) days. Sleep timing is under the control of both a sleep homeostatic process and a circadian pacemaker (Daan et al., 1984). The phase of entrainment of an individual’s circadian pacemaker depends both on physiological factors (e.g., intrinsic circadian period) and the pattern of light to which the individual is exposed (Duffy et al., 2001; Gronfier et al., 2007). These relationships are understood in terms of the circadian clock’s phase response curve and entrainment (Winfree, 1980). Currently, however, we lack a theoretical understanding of the relationships between an individual’s physiology, the light patterns they select in the real world, and how this interaction affects sleep timing. This understanding would be helpful in developing effective personalized interventions for individuals who desire to shift their sleep timing, or for evaluating potential policy changes designed to modify sleep patterns at the societal level.
Sleep timing plays a crucial role in human health and physiology. Individuals with a midsleep time later than 5:30am have higher caloric consumption and BMI (Baron et al., 2011). Habitually sleeping after 1am is associated with smaller hippocampal volumes in healthy university students (Kuperczkó et al., 2015). Individuals who sleep late are also more likely to experience social jetlag, which is the mismatch in sleep timing between work days and free days (Wittmann et al., 2006). Social jet-lag involves misalignment between sleep/wake and circadian cycles, and is associated with poor outcomes, including obesity (Roenneberg et al., 2012), worse academic performance (Asarnow et al., 2014), increased resting heart rate (Rutters et al., 2014), and emotional distress (Asarnow et al., 2014).
Several physiological factors have been identified that modify an individual’s preference towards early or late sleep timing. The best studied example is the intrinsic period of the circadian pacemaker, τc. Longer periods are associated with later self-selected sleep timing in humans (Duffy et al., 2001) and many other species (Daan and Aschoff, 2001). This relationship is predicted by models; if all other physiological parameters are identical, including the pacemaker’s response to light, a longer intrinsic period should theoretically result in a later phase of entrainment (Winfree, 1980). Other factors that could account for individual differences in sleep timing include differences in the response of the circadian pacemaker to light (e.g., increased sensitivity to phase delays) (Aoki et al., 2001) and differences in parameters of the sleep homeostatic process, such as the time constant for saturation during wake, which has been associated with changes in sleep timing across adolescence (Jenni et al., 2005).
The importance of environment in determining an individual’s chronotype was demonstrated by a two-week experiment in which individuals were studied both when they were living at home with access to electric lights, and when they went camping without access to electric light for a week (Wright et al., 2013). When camping, individual sleep times shifted much earlier and differences in sleep timing between the individuals were greatly reduced compared to when they had access to electric light. These findings suggest that an individual’s chronotype could be considered an evoked trait, and that the wide range of inter-individual differences found in sleep timing across the population may be primarily a function of self-selected light patterns. Indeed, this has been previously proposed (Roenneberg and Merrow, 2007), and the concept is intuitive, since individuals who have a physiological tendency towards later schedules are more likely to be exposed to light later in the day, further delaying their sleep timing due to circadian phase delay. Similarly, individuals who have a physiological tendency towards early schedules are more likely to be exposed to light earlier in the day, further advancing their sleep timing. However, this idea is yet to be explored quantitatively.
Mathematical models have been developed to explain human sleep timing in terms of circadian and homeostatic processes. These models include the two-process model (Daan et al., 1984) and more recent models of sleep physiology, some of which include the effects of light (Phillips et al., 2010; Phillips et al., 2011), which is the strongest zeitgeber for the human circadian pacemaker (Mistlberger and Skene, 2005; Duffy and Czeisler, 2009). Recorded patterns of self-selected light in time-free laboratory conditions have been used as inputs to a model of the circadian pacemaker to explain the circadian period observed under those conditions (Klerman et al., 1996). To date, however, models have not been applied to understanding the patterns of light exposure that individuals self-select in the real world and how these patterns interact with an individual’s physiology to potentially evoke their particular chronotype. Roenneberg and Merrow (1999) coined the term “zeitnehmer” for a circadian system that self-selects the timing of its exposure to a zeitgeber, which they implemented in a simple model of photosynthesis. The zeitnehmer concept can potentially explain the effects of social zeitgebers on the circadian clock and sleep timing, because social behaviors (e.g., when we choose to sleep) shape patterns of exposure to light (Roenneberg et al., 2013). Passive avoidance of light at certain times (e.g., during sleep) has been implemented in models of the human circadian clock and sleep (Phillips et al., 2010; Phillips et al., 2011), but not as an active process where the model can choose to switch lights on, as humans routinely do in the real world.
Here, we implemented simple decision-making rules in a previously validated model of human sleep and circadian rhythms to understand how self-selection of light exposure influences sleep timing and social jet-lag. Using this approach, we investigated the effects of varying one physiological parameter – the intrinsic circadian period – to test our hypothesis that self-selection of light exposure will tend to evoke a greater range of chronotypes across the population, leading to amplification of individual differences relative to a fixed light/dark cycle. Specifically, the results of our simulations are compared to the results from the Wright et al. (2013) camping study. It is natural to begin by investigating the effects of changes in one physiological parameter; we choose intrinsic circadian period due to the large existing literature on circadian period in humans and other species.
2. Methods
We use a mathematical model of human sleep and circadian physiology to simulate the effects of realistic self-selected light patterns on sleep and circadian timing. The model is based on physiology and has been used previously in the same or similar form to investigate the effects of different physiological parameters on sleep and circadian timing given either a 24-hour periodic light stimulus (Phillips et al., 2010) or constant light during all hours of wakefulness (Phillips et al., 2011). We first describe the model equations in Sec. 2.1. We then describe the rules used for generating sleep and light schedules in Sec. 2.2. Model parameter values are described in Sec. 2.3. Finally, the methods used for simulations and analyses are described in Sec. 2.4. The mathematical model used in this paper is freely available to others via email or GitHub.
2.1 Model of human sleep and circadian physiology
The model includes the following components: circadian phototransduction, the central circadian pacemaker, the sleep homeostatic process, and the sleep/wake switch (Figure 1). Each of these model components has previously been fit and tested against human data, both individually and in combination (Phillips and Robinson, 2007; Phillips and Robinson, 2008; Phillips et al., 2010; Jewett et al., 1999; Kronauer et al., 1999; Forger et al., 1999). As inputs, the model takes light levels (in lux) and times at which sleep is allowed. As outputs, the model gives circadian phase, homeostatic sleep pressure, and sleep/wake state as functions of time.
Figure 1.
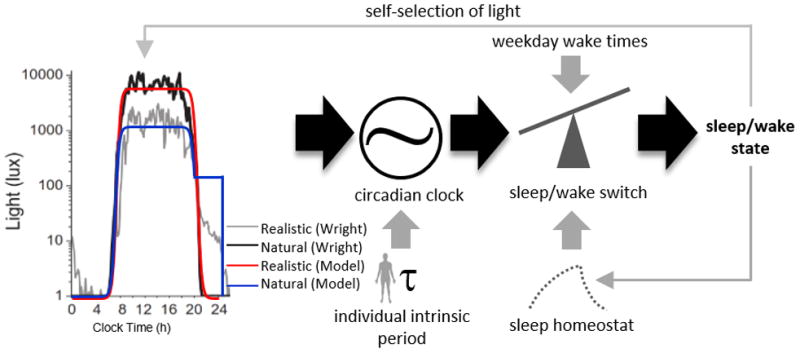
Model schematic with different light exposure patterns. Left panel, light exposure patterns from Wright et al. (2013). Right panel: model schematic. The model alters the light profile based on its sleep/wake state, which then is used as input into the circadian clock. The circadian clock’s phase is influenced by the light profile as well as the intrinsic circadian period. The circadian phase, along with the preset wake and sleep times and sleep homeostat, then drives the sleep/wake switch, which feeds back into the light profile pattern.
Photoreceptors are converted from a ready state to an activated state at a rate α, dependent on light intensity that reaches the retina, Ĩ. Activated photoreceptors are converted back to the ready state at constant rate β. The fraction n of photoreceptors that are activated state thus obeys
| (1) |
where 1/λ is the receptor time constant, and α = α0(Ĩ/I0)p (Kronauer et al., 1999).
The photic drive B to the pacemaker is assumed to be proportional to the rate α(1 − n) at which photoreceptors are activated, giving
| (2) |
| (3) |
where b and G are constants. The term (1 − bx) (1 − by) is included to match the human circadian phase dependence of light sensitivity (Kronauer et al., 1999).
The circadian pacemaker is modeled by two first order differential equations, based on a van der Pol oscillator:
| (4) |
| (5) |
where y represents pacemaker activity, and x is an auxiliary variable. The parameter τc is intrinsic period, k is a constant determining sensitivity to photic stimuli, f is a constant included to fix the period at τc, γ is the stiffness of the oscillator, and κ = (12/π)h (Forger et al., 1999). This model has been previously fit to human data including the phase response curve (Kronauer et al., 1999).
To model the ascending arousal system and homeostatic drive, we use the Phillips and Robinson (2007) model that includes the mutually inhibitory wake-promoting monoaminergic (MA) and sleep-promoting ventrolateral preoptic (VLPO) neural populations. Circadian (C) and homeostatic (H) inputs drive the VLPO, while MA receives excitatory input A from cholinergic and orexinergic sources. For each population j = v, m, where v is VLPO, and m is MA, we define mean cell body potential Vj(t) relative to resting, and mean firing rate Qj(t). The relationship between firing rate and voltage is sigmoidal,
| (6) |
where Qmax is the maximum possible rate, θ is mean firing threshold, and is the standard deviation of θ (Robinson et al., 1997).
The differential equations for the two populations are
| (7) |
| (8) |
where νjk terms represent synaptic weights for population j from k, τj is the characteristic decay time for the neuromodulator expressed by group j, and total sleep drive is
| (9) |
where D0 is a constant offset.
The homeostatic drive H accumulates during wake and dissipates during sleep. via
| (10) |
Where χ is the homeostatic time constant for clearance and accumulation, and μ is constant. The circadian drive is C = (1 + y)/2.
2.2 Simulated schedules
In previous work, the mathematical model passively selected light, receiving available light when awake and blocking available light when asleep. Here, we use some simple rules for self-selection of light, intended to mimic human behaviors in the real world.
First, we model a natural light profile, In, with a sunrise time of 5:50am and a sunset time of 8:30pm (Eqn. 11). The light profile was chosen to match that measured in a study in which individuals went camping for 7 days without artificial light sources (Wright et al., 2013), which is shown in Figure 1.
| (11) |
The values of −7.5 and −20.5 were chosen to give sunrise and sunset at the appropriate times, and the values of −3.25 and −3 to match the rate of change of light levels at sunrise and sunset for the camping study environmental conditions. The maximum light parameter, Imax, is set to 3.8751 such that the highest light intensity reached is 7500 lux and the minimum is 1 lux. For natural light simulations, the model can only passively alter light levels by sleeping, in which case 97% of the available light is blocked during sleep episodes, to simulate light attenuation by the eyelids (Phillips et al., 2013).
| (12) |
For “realistic light” simulations, we include use of electric light at a room light intensity of 200 lux. Whenever the model is awake and available natural light is below 200 lux, lights are turned on; during sleep, lights are turned off and 97% of available natural light is blocked as in the natural light case. Additionally, the maximum daytime light intensity is reduced to 1000 lux by setting Imax = 3 in Eqn. (11) above, to match the attenuation of daytime light observed in individuals working in the real world (Wright et al., 2013), due to spending time indoors.
| (13) |
We note that simulations of individuals with different parameter values will generate different profiles, due to different amounts of time spent awake after sunset. While one example of the realistic light profile is shown in Figure 1, model sleep onset times and therefore the timing of artificial light usage can vary greatly with parameter values or with day of week (details below). The level of evening light in the model is therefore not directly comparable to the levels plotted in Wright et al. (2013), which were averaged across multiple participants, some of whom might be awake and some asleep, . This averaging resulted in an average level of ~20 lux, which is much dimmer than that from most commonly used artificial light sources (e.g., overhead lights and TV/computer screens). We assume that individuals use a relatively constant level of artificial light after the sun sets, and have negligible exposure to light while asleep. The results we find here are specific to our choice of 200 lux, but similar trends could be found for other choices of evening light levels. In general, simulations with lower artificial light levels will tend towards the natural light case.
For some simulations, we also introduce weekdays and weekends into the model. This was done by forcing the model to be awake from 7:30am to 6:30pm from Monday to Friday (assuming a 9am–5pm workday and 1.5 hours for transit and other activities) and having no sleep restrictions on Saturday or Sunday. This was achieved by forcing Qm to be greater than or equal to 5s−1 (a typical waking firing rate) during time intervals when sleep was disallowed, similar to previous work in which sleep deprivation was modeled (Phillips et al., 2008).
2.3 Model parameter values
For simulations in this paper, most model parameter values are taken directly from the previously published values in Phillips et al. (2010). Here, we analyzed how sleep and circadian timing depend on the value of the intrinsic circadian period, τc, which has a physiological range of 23.7 h to 24.6 h in healthy human adults (Duffy et al., 2011).
Two model parameters are updated here to better fit sleep data collected from the human population. These are χ and νvh, which were chosen because they can modify sleep/wake timing and duration, and were previously estimated with significant uncertainty (Phillips et al., 2008). Within a sample of over 60,000 individuals, habitual midsleep time on free days is between 2am and 10am in 99.7% of the population (Roenneberg et al., 2007). We therefore chose values of χ and νvh that caused midsleep times to vary between approximately 2am and 10am across the physiological range of τc. In addition, we including a penalty term for sleep durations differing from 8 hours across the physiological range of τc, to ensure that sleep durations remained at a normal duration. This was achieved by minimizing the following error function:
| (13) |
In the above expression, ms refers to clock time of midsleep (0 represents midnight, with times before midnight represented as negative values), st is the total sleep time, and ct is cycle time, which is included in the error function to ensure entrainment. Subscripts of 1 correspond to τc = 23.7h and subscripts of 2 correspond to τc = 24.6h. Allowed ranges were 36 h < χ < 72 h and 0.75 < νvh < 1.20, based on previously estimated physiological ranges for these parameters (Phillips et al., 2008; Phillips et al., 2010), and the minimization was performed using the MATLAB inbuilt function fmincon. To accurately match the model to the data, we imposed weekdays and weekends on the model, and considered sleep parameters from weekends only. The model was allowed 90 days to entrain to the conditions. Optimal parameter values were χ = 65.0 and νvh = 0.84. With these values, the range of waking times was 5:00–10:11, of sleep times was 22:27–3:23, and of total sleep time was 6.6–7.7 h. We visually confirmed that solutions were entrained to the 24-hour day.
2.4 Simulations and analysis
To analyze the interaction between intrinsic circadian period and electric light, we simulated weekday/weekend schedules under either the natural light condition or “realistic light” condition. The dependence of sleep/wake patterns on the value of the intrinsic period was assessed across the physiological range (23.7 h to 24.6 h). For all simulations, the model was allowed 120 days to reach a stable, entrained sleep/wake pattern, which was defined as a pattern that repeated every 7 days to within 0.01h. Two metrics were used to summarize the outputs of the model: midsleep time and social jet-lag. Midsleep time was calculated as the midpoint of sleep onset and wake time, which is a commonly used sleep parameter. Social jet-lag was calculated by taking the absolute difference in average midsleep time between weekends and weekdays.
In addition, we performed a sensitivity analysis of the model’s results with respect to the parameters χ and νvh. Effects of varying each parameter by ±5% relative to its baseline value were recorded for midsleep timing and sleep duration. This sensitivity analysis was performed under both the natural and realistic light conditions.
To compare model predictions with results of Wright et al. (2013), we also computed sleep times for a population distribution of intrinsic periods. This was achieved by running the simulation 120 times, with intrinsic period sampled for each simulation from a normal distribution with the mean and standard deviations previously reported for healthy human adults in Duffy et al. (2011). Average sleep onset and offset times were calculated in each case by averaging across the 7 days of the week. Mean and standard deviations from sleep onset and offset times were then computed by averaging across all cases.
To assess circadian timing, we tracked differences in the timing of minimum of the circadian drive C between the natural and realistic light conditions for an intrinsic circadian period of 24.2 h. Finally, to gain additional insights into the differences between natural and realistic conditions, we also ran weekday/weekend simulations for different values of the intrinsic period, imposing only one of the two realistic light condition’s alterations: (i) just the attenuation of natural light levels during daytime (i.e., no addition of electric light), or (ii) just the addition of electric light when natural light levels were low (i.e., no attenuation of daytime light levels).
3. Results
3.1 Self-selected light and sleep patterns
For realistic light patterns, different patterns of self-selected light exposure emerged depending on values of the intrinsic circadian period, ranging from 23.7 h to 24.6 h. At the lower end of the physiological range of period (Fig. 2A), the model predicted sleep would occur very early, waking before the 7:30am enforced wake time on both weekdays and weekends, and electric light was used both before sunrise and after sunset. Since the model’s sleep times were unaffected by weekday work constraints in these cases, it predicted wake at the same time on both weekends and weekdays (Fig. 3A).
Figure 2.
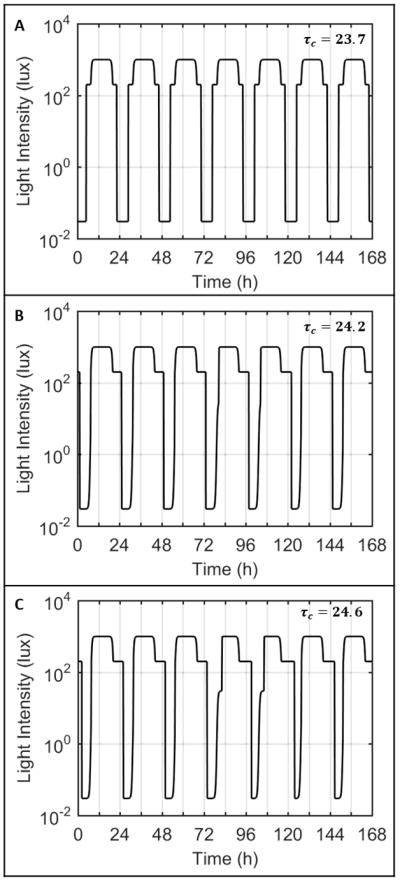
Light profiles input to the model with intrinsic circadian periods of 23.7 h (A), 24.2 h (B), and 24.6 h (C) for one week. The first cycle represents the light profile for Tuesday, such that the shaded regions indicate Saturday and Sunday for the model. In case A, with intrinsic period less than 24 hours, the model turns on the lights both in the morning and in the evening, reflective of an early rise time. In cases B and C, with intrinsic period longer than 24 hours, the model turns on the lights only in the night time.
Figure 3.

Raster plots of times of sleep over two weeks for different intrinsic circadian periods. The black bars indicate times of sleep. The shaded gray boxes indicate sleep on Friday and Saturday nights (weekends). The gray vertical lines indicate the 7:30am forced wake time on week days.
As the intrinsic circadian period was increased, the weekend rise and bed times moved progressively later. With intrinsic periods of 24.2 h (Fig. 2B) or 24.6 h (Fig. 2C), the model predicted wake at the enforced time of 7:30am on weekdays and predicted sleep to continue beyond 7:30am on weekends. Consequently, the model always predicted wake after dawn and only required electric light in the evenings (i.e., after sunset). The model’s predicted sleep/wake patterns differed significantly between weekdays and weekends, with the bed time shifting gradually earlier from Monday to Friday, and slipping later during weekends. For an intrinsic period of 24.2 h (Fig. 3B), the model’s predicted sleep times were later and sleep duration was longer on the weekend than during weekdays. On Monday morning, sleep was shortened to 5.5 h. This pattern was more exaggerated with an intrinsic period of 24.6 h (Fig. 3C), with sleep shortened to only 3.7 h on Monday morning, and extending to 8.4 h on Saturday morning.
3.2 Effects of intrinsic period on sleep timing under natural versus realistic conditions
Simulations of natural versus realistic light conditions under the same weekday/weekend sleep constraints revealed significant differences in sleep timing. Figure 4 shows how midsleep times on weekdays and weekends differ between these conditions, when the simulation is performed at each τc, from 23.7 to 24.6 hours.
Figure 4.

(A) Difference in midsleep timings between natural and realistic light profiles across different τc values with forced weekday wake times. The solid lines represent weekday (Sunday to Thursday) midsleep times while the dashed lines represent weekend (Friday and Saturday) midsleep times. (B) Social jetlag experienced by the model with only natural lighting (black solid line) and with artificial lighting (gray dashed line) across the tested τc values.
Under a natural light pattern, the model predicted sleep at the exact same time on both weekdays and weekend. Even at the upper end of the physiological range, the model predicted wake before 7:30am each day. In addition, there was only 1.9 h variation in midsleep timing across the full physiological range of intrinsic periods. In other words, without electric light, longer intrinsic periods still produced later sleep times, but only by a small amount compared to the degree of variation observed in the human population.
Under a realistic light pattern, sleep timing was shifted later, and the model produced much greater variation in sleep timing. The difference in midsleep time between the lower and upper ends of physiological range for intrinsic period was 2.9 h on weekdays and 5.5 h on weekends. In addition, the difference between midsleep time on weekdays and weekends (social jetlag), expanded as intrinsic period increased, with a maximal difference of 2.7 h for τc = 24.6 h. This value is in close agreement with the 3 h of social jet-lag reported by extremely late-type individuals (those with a midsleep time on free days later than 7am) (Wittman et al., 2006). At τc = 24.2 h, the delay in sleep timing between weekdays and weekends was also associated with a 1.1h delay in circadian timing between weekdays and weekends. The model predicted no social jetlag until reaching a critical intrinsic period of τc = 23.9 h. Below this value, the model predicted wake before 7:30am each day. This is consistent with the fact that early-type individuals (i.e., those with a midsleep time on free days earlier than 4am) experience less than 1 h of social jet-lag on average (Wittman et al., 2006). We note that theoretically the model could generate social jet-lag in extreme early types under different assumptions (e.g., late work times).
3.3 Comparing model predictions to empirical data
Using the measured population distribution of intrinsic periods in healthy adults (Duffy et al., 2011), we compared model predictions for mean and standard deviation of sleep onset and sleep offset to data published by Wright et al. (2013) for individuals living under natural conditions (no electric light) or realistic conditions (access to electric light), on which we based our simulated light profiles above. The model predictions are similar to the data, shown in Figure 5. With the addition of electric light, sleep times are pushed later and there is much greater population variability in the timing of sleep schedules when compared with natural light sleep schedules, in both the experimental and model data. Under realistic lighting, standard deviations for model sleep and wake times were 1.2 h and 1,2 h, respectively, compared to experimental data values of 1.4 h and 0.8 h, respectively. Under natural lighting, these values reduced to 0.8 h and 0.6 h for the model data and 0.3 h and 0.4 h for the experimental data. The model’s sleep duration is shorter under realistic conditions than natural conditions due to forced awakenings on weekdays, whereas this is less apparent in the data.
Figure 5.
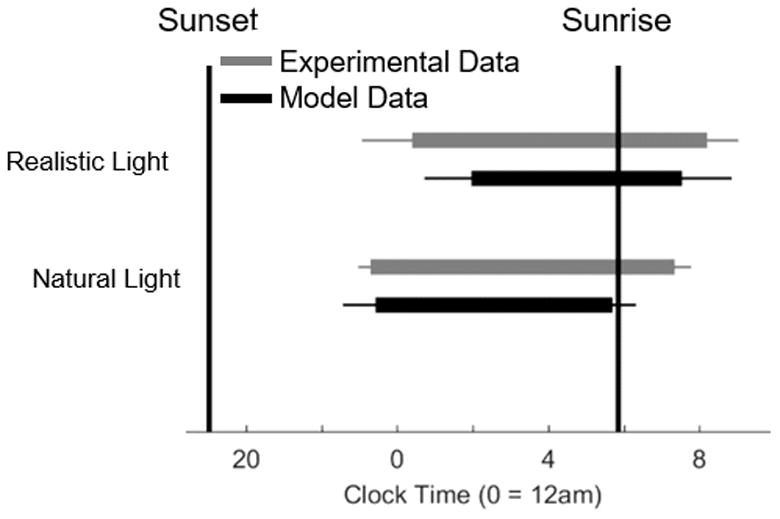
Raster diagram comparing the times of sleep averaged across the entire week between the natural and realistic conditions for both the experimental data and the model. The gray bars represent the data reported in the Wright et al. (2013) study. The black bars represent the data generated by the model. The error bars represent the standard deviation in sleep times for each condition.
Sensitivity of the model’s sleep timing and sleep duration were tested under realistic light conditions for changes of ±5% in the parameters νvh and χ. As shown in Figure 6, all of the general trends in sleep timing on weekdays and weekends with respect to τc remained qualitatively the same. Small variations in χ had negligible effects on midsleep timing and sleep duration, whereas small variations in νvh affected midsleep timing and sleep duration almost uniformly across the range of τc. Increasing νvh shifted midsleep timing earlier and extended sleep duration. This suggests that the model could be made to fit the Wright et al. (2013) data more closely in the realistic case by increasing νvh, if so desired. However, our primary goal was exploring the model’s predictions, having validated the model against other human datasets, rather than attempting to best fit the model to these data.
Figure 6.

A sensitivity analysis of the model’s results with ±5% changes in the parameters and νvh (first column) and χ (second column). Average midsleep timings (Panels A and B) and average sleep durations (Panels C and D) are shown for realistic light profiles across different τc values with forced weekday wake times. In each panel, average values are plotted separately for weekdays (solid) and weekends (dashed). Different colors represent changes in the values of the parameters νvh and χ, as labeled in each panel legend.
3.4 Effects of light attenuation versus light supplementation on sleep timing
Since realistic light profiles involve both attenuation of daytime exposure to natural light and use of supplementary electric light, we investigated the relative importance of these two factors by simulating light profiles that included none, one, or both of these factors. As shown in Figure 7, use of electric light is the dominant factor in delaying sleep timing, amplifying individual differences in sleep timing, and generating social jet-lag. Attenuation of daytime light in combination with electric light significantly enhances these effects, but on its own has little effect on sleep timing. With light attenuation only, weekend midsleep times range from 1.4 h to 3.7 h across the range of τc. With artificial light only, weekend midsleep times range from 2.0 h to 5.9 h across the range of τc.
Figure 7.
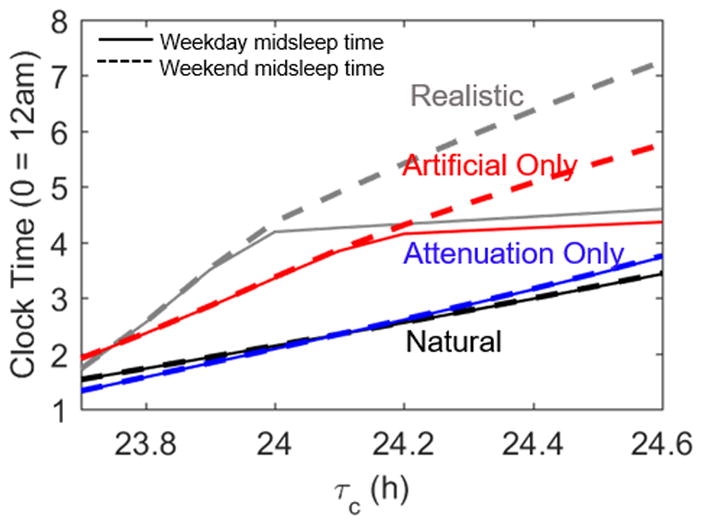
Midsleep time profiles across the natural range of τc values under different light profiles. In each condition, the solid line represents weekday midsleep times while the dashed line indicates weekend midsleep times. The black and gray lines are replicated from Figure 4 and represent the model’s behavior under natural and realistic light conditions. The blue lines result from altering the light profile only through attenuation of daytime light. The red lines come from only allowing the use of artificial light, without attenuating daylight light.
4. Discussion
Chronotype is frequently used for describing an individual’s typical sleep timing and is a useful predictive marker for health and other outcomes (Juda et al., 2013; Merikanto et al., 2013). In this paper, we show explicitly how chronotype may depend on an interaction between an individual’s physiology, their self-selected patterns of light exposure, and constraints on sleep timing on weekdays. Specifically, we show that individual tendencies to sleep late are amplified by self-selected use of artificial light, resulting in a doubling in the range of inter-individual differences in sleep timing compared to the same range under natural light conditions. This occurs because individuals with later sleep preference select increased exposure to artificial light in the evening, which delays the circadian clock and sleep onset, reinforcing the behavior by a positive feedback loop. The model prediction that chronotype is an evoked trait that is highly sensitive to environmental factors is supported by the fact that human populations exhibit very different average sleep times between countries (Walch et al., 2016), when camping (Wright et al., 2013), or in preindustrialized societies (Yetish et al., 2015).
A key challenge for our field is linking experimental results generated under highly-controlled laboratory conditions to the complex phenotypes that emerge in the real world, where environmental stimuli are complex and there exist feedback loops between physiology and behavior. It should be noted that these challenges are not limited to human work. Drosophila exhibit very different activity patterns under natural light/dark patterns than under typical laboratory light/dark schedules (Prabhakaran and Sheeba, 2014). Mammalian species have also been found to exhibit very different activity patterns in laboratory conditions compared to field or field-analog conditions (Daan et al., 2011), or dependent on the presence or absence of a running wheel (Blanchong et al., 1999). The model we present here includes simple rules for simulating an individual’s modification of their environment through self-selection of light. While this is clearly an oversimplification of real human behaviors, it usefully captures empirical phenomena such as the delay of sleep timing on weekends and inter-individual differences in sleep timing, and relates these phenomena to underlying physiology. In future, this approach could be easily extended to include other empirically-derived rules, such as individuals choosing to stay up late on weekends when they have no pressure to awaken early the next morning, or more complex social constraints, such as shift-work or interactions with other individuals, including friends, roommates, partners, and children. Moreover, our approach could be applied to modeling other human behaviors where there are interactions between physiology and self-selected behaviors, such as meal timing or drug use and addiction.
An additional consideration for future work is simulation of more realistic individual light profiles. The profiles used here provide relatively constant levels of light during the daytime and evening, reflecting average light profiles measured experimentally. For individuals, however, light profiles can fluctuate on short timescales, e.g., when individuals briefly walk outside, and levels of indoor light can significantly vary between rooms and individual workplaces. The spectral content of light can also differ, with differing effects on the circadian timing system (Lucas et al., 2014), which is a factor not currently implemented in our circadian model.
Outside of sleep and circadian physiology, psychological factors could also influence sleep timing, such an individual’s willingness to curtail use of electronic devices at nighttime. In the model presented here, sleep onset simply occurs when it is enabled by the combination of circadian and sleep homeostatic processes. In reality, individuals may attempt to sleep earlier or may attempt to prolong wakefulness by use of stimulating activities or factors such as social interactions, light, and caffeine. There is notably an association between late chronotype and reduced self-control (Hasler et. al., 2013). Additionally, studies have shown that intrinsic circadian period can be slightly changed by environmental stimuli, including light/dark patterns (Pittendrigh and Daan, 1976; Scheer et al., 2007). This plasticity is not accounted for in our circadian model, but may be an important factor in reinforcing an individual’s evoked chronotype. For example, if consistently delayed schedules lead to a lengthening of intrinsic period, this would create a positive feedback loop for delayed sleep, which would further interact with self-selection of light.
In summary, this model, which is originally based on laboratory data, replicates experimental data in the real world when we add simple rules for self-selection of light. These results therefore create a bridge between knowledge of sleep and circadian physiology gleaned in the laboratory and more complex sleep behaviors in the real world. Importantly, this provides a basis for quantitatively assessing potential intervention strategies in the real world, and their likelihood of success given knowledge of an individual’s physiology. One of the key predictions from our simulations is that curtailment of evening use of electric light is likely to be a more effective strategy in reducing social jet-lag and advancing sleep timing than increasing exposure to daytime natural light.
Table 1.
Parameter values used in the model. Values are taken from Phillips et al. (2010), except where otherwise stated.
| Parameter | Value | Unit | Parameter | Value | Unit |
|---|---|---|---|---|---|
| −μvc | 5.8 | mV | λ | 60 | h−1 |
| νvh | 0.843 | mV nM−1 | α0 | 0.16 | 1 |
| χ | 65.01 | h | I0 | 9500 | lux |
| μ | 4.4 | nM s | p | 0.6 | 1 |
| D0 | −10.2 | mV | β | 0.013 | 1 |
| Qmax | 100 | s−1 | b | 0.4 | 1 |
| θ | 10 | mV | G | 19.9 | 1 |
| σ′ | 3 | mV | k | 0.55 | 1 |
| A | 1.3 | mV | τc | varied | h |
| −νvm | 2.1 | mV s | f | 0.99669 | 1 |
| −νmv | 1.8 | mV s | γ | 0.23 | 1 |
| τm, τv | 10 | s |
Acknowledgments
The authors thank Drs. Céline Vetter, Charles Czeisler, Ken Wright Jr., and Till Roenneberg for helpful comments on preliminary versions of these results. This work was supported by the National Space Biomedical Research Institute HFP02802, HFP0006, and HFP04201 through NASA Cooperative Agreement NCC 9-58; and the National Institutes of Health through awards K24-HL105664, P01-AG009975, R01-GM-105018, R01-HL114088, R21-HD086392, K99-HL119618, and R00-HL119618; and the Harvard-Australia Fellowship.
References
- Aoki H, Ozeki Y, Yamada N. Hypersensitivity of melatonin suppression in response to light in patients with delayed sleep phase syndrome. Chronobiol Int. 2001;18:263–271. doi: 10.1081/cbi-100103190. [DOI] [PubMed] [Google Scholar]
- Asarnow LD, McGlinchey E, Harvey AG. The Effects of Bedtime and Sleep Duration on Academic and Emotional Outcomes in a Nationally Representative Sample of Adolescents. J Adolesc Health. 2014;54:350–356. doi: 10.1016/j.jadohealth.2013.09.004. [DOI] [PMC free article] [PubMed] [Google Scholar]
- Baron KG, Reid KJ, Kern AS, Zee PC. Role of sleep timing in caloric intake and BMI. Obesity. 2011;19:1374–1381. doi: 10.1038/oby.2011.100. [DOI] [PubMed] [Google Scholar]
- Blanchong JA, McElhinny TL, Mahoney MM, Smale L. Nocturnal and diurnal rhythms in the unstriped Nile rat, Arvicanthis niloticus. J Biol Rhythms. 1999;14:364–377. doi: 10.1177/074873099129000777. [DOI] [PubMed] [Google Scholar]
- Daan S, Aschoff J. The Entrainment of Circadian Systems. In: Takahashi JS, Turek FW, Moore RY, editors. Circadian Clocks. Springer US; 2001. pp. 7–43. [Google Scholar]
- Daan S, Beersma DG, Borbély AA. Timing of human sleep: recovery process gated by a circadian pacemaker. Am J Physiol. 1984;246:R161–183. doi: 10.1152/ajpregu.1984.246.2.R161. [DOI] [PubMed] [Google Scholar]
- Daan S, Spoelstra K, Albrecht U, Schmutz I, Daan M, Daan B, Rienks F, Poletaeva I, Dell’Omo G, Vyssotski A, Lipp HP. Lab mice in the field: unorthodox daily activity and effects of a dysfunctional circadian clock allele. J Biol Rhythms. 2011;26:118–129. doi: 10.1177/0748730410397645. [DOI] [PubMed] [Google Scholar]
- Duffy JF, Cain SW, Chang AM, Phillips AJK, Münch MY, Gronfier C, Wyatt JK, Dijk DJ, Wright KP, Jr, Czeisler CA. Sex difference in the near-24-hour intrinsic period of the human circadian timing system. Proc Natl Acad Sci USA. 2011;108(Suppl 3):15602–15608. doi: 10.1073/pnas.1010666108. [DOI] [PMC free article] [PubMed] [Google Scholar]
- Duffy JF, Czeisler CA. Effect of light on human circadian physiology. Sleep Med Clin. 2009;4:165–177. doi: 10.1016/j.jsmc.2009.01.004. [DOI] [PMC free article] [PubMed] [Google Scholar]
- Duffy JF, Rimmer DW, Czeisler CA. Association of intrinsic circadian period with morningness–eveningness, usual wake time, and circadian phase. Behav Neurosci. 2001;115:895–899. doi: 10.1037//0735-7044.115.4.895. [DOI] [PubMed] [Google Scholar]
- Forger DB, Jewett ME, Kronauer RE. A simpler model of the human circadian pacemaker. J Biol Rhythms. 1999;14:533–538. doi: 10.1177/074873099129000867. [DOI] [PubMed] [Google Scholar]
- Gronfier C, Wright KP, Jr, Kronauer RE, Czeisler CA. Entrainment of the human circadian pacemaker to longer-than-24-h days. Proc Natl Acad Sci USA. 2007;104:9081–9086. doi: 10.1073/pnas.0702835104. [DOI] [PMC free article] [PubMed] [Google Scholar]
- Hasler BP, Sitnick SL, Shaw DS, Forbes EE. An altered neural response to reward may contribute to alcohol problems among late adolescents with an evening chronotype. Psychiatry Res. 2013;214:357–364. doi: 10.1016/j.pscychresns.2013.08.005. [DOI] [PMC free article] [PubMed] [Google Scholar]
- Jenni OG, Achermann P, Carskadon MA. Homeostatic sleep regulation in adolescents. Sleep. 2005;28:1446–1454. doi: 10.1093/sleep/28.11.1446. [DOI] [PubMed] [Google Scholar]
- Jewett ME, Forger DB, Kronauer RE. Revised limit cycle oscillator model of human circadian pacemaker. J Biol Rhythms. 1999;14:493–500. doi: 10.1177/074873049901400608. [DOI] [PubMed] [Google Scholar]
- Juda M, Vetter C, Roenneberg T. Chronotype modulates sleep duration, sleep quality, and social jet lag in shift-workers. J Biol Rhythms. 2013;28:141–151. doi: 10.1177/0748730412475042. [DOI] [PubMed] [Google Scholar]
- Klerman EB, Dijk DJ, Kronauer RE, Czeisler CA. Simulations of light effects on the human circadian pacemaker: implications for assessment of intrinsic period. Am J Physiol. 1996;270:R271–282. doi: 10.1152/ajpregu.1996.270.1.R271. [DOI] [PubMed] [Google Scholar]
- Kronauer RE, Forger DB, Jewett ME. Quantifying human circadian pacemaker response to brief, extended, and repeated light stimuli over the phototopic range. J Biol Rhythms. 1999;14:500–515. doi: 10.1177/074873099129001073. [DOI] [PubMed] [Google Scholar]
- Kuperczkó D, Perlaki G, Faludi B, Orsi G, Altbacker A, Kovács N, Dóczi T, Komoly S, Schwarcz A, Clemens Z, Janszky J. Late bedtime is associated with decreased hippocampal volume in young healthy subjects. Sleep Biol Rhythms. 2015;13:68–75. [Google Scholar]
- Lucas RJ, Peirson SN, Berson DM, Brown TM, Cooper HM, Czeisler CA, Figueiro MG, Gamlin PD, Lockley SW, O’Hagan JB, Price LAL, Provencio I, Skene DJ, Brainard GC. Measuring and using light in the melanopsin age. Trends Neurosci. 2014;37:1–9. doi: 10.1016/j.tins.2013.10.004. [DOI] [PMC free article] [PubMed] [Google Scholar]
- Merikanto I, Lahti T, Puolijoki H, Vanhala M, Peltonen M, Laatikainen T, Vartiainen E, Salomaa V, Kronholm E, Partonen T. Associations of chronotype and sleep with cardiovascular disease and type 2 diabetes. Chronobiol Int. 2013;30:470–477. doi: 10.3109/07420528.2012.741171. [DOI] [PubMed] [Google Scholar]
- Mistlberger RE, Skene DJ. Nonphotic entrainment in humans? J Biol Rhythms. 2005;20:339–352. doi: 10.1177/0748730405277982. [DOI] [PubMed] [Google Scholar]
- Phillips AJK, Chen PY, Robinson PA. Probing the mechanisms of chronotype using quantitative modeling. J Biol Rhythms. 2010;25:217–227. doi: 10.1177/0748730410369208. [DOI] [PubMed] [Google Scholar]
- Phillips AJK, Czeisler CA, Klerman EB. Revisiting spontaneous internal desynchrony using a quantitative model of sleep physiology. J Biol Rhythms. 2011;26:441–453. doi: 10.1177/0748730411414163. [DOI] [PMC free article] [PubMed] [Google Scholar]
- Phillips AJK, Fulcher BD, Robinson PA, Klerman EB. Mammalian rest/activity patterns explained by physiologically based modeling. PLoS Comput Biol. 2013;9:e1003213. doi: 10.1371/journal.pcbi.1003213. [DOI] [PMC free article] [PubMed] [Google Scholar]
- Phillips AJK, Robinson PA. A quantitative model of sleep-wake dynamics based on the physiology of the brainstem ascending arousal system. J Biol Rhythms. 2007;22:167–179. doi: 10.1177/0748730406297512. [DOI] [PubMed] [Google Scholar]
- Phillips AJK, Robinson PA. Sleep deprivation in a quantitative physiologically based model of the ascending arousal system. J Theor Biol. 2008;255:413–423. doi: 10.1016/j.jtbi.2008.08.022. [DOI] [PubMed] [Google Scholar]
- Pittendrigh CS, Daan S. Functional-analysis of circadian pacemakers in nocturnal rodents. 1. Stability and lability of spontaneous frequency. J Comp Physiol. 1976;106:223–252. [Google Scholar]
- Prabhakaran PM, Sheeba V. Simulating natural light and temperature cycles in the laboratory reveals differential effects on activity/rest rhythm of four Drosophilids. J Comp Physiol A. 2014;200:849–862. doi: 10.1007/s00359-014-0927-x. [DOI] [PubMed] [Google Scholar]
- Robinson PA, Rennie CJ, Wright JJ. Propagation and stability of waves of electrical activity in the cerebral cortex. Phys Rev E. 1997;56:826–840. [Google Scholar]
- Roenneberg T, Allebrandt KV, Merrow M, Vetter C. Social jetlag and obesity. Curr Biol. 2012;22:939–943. doi: 10.1016/j.cub.2012.03.038. [DOI] [PubMed] [Google Scholar]
- Roenneberg T, Kantermann T, Juda M, Vetter C, Allebrandt KV. Light and the human circadian clock. Handb Exp Pharmacol. 2013;217:311–331. doi: 10.1007/978-3-642-25950-0_13. [DOI] [PubMed] [Google Scholar]
- Roenneberg T, Kuehnle T, Juda M, Kantermann T, Allebrandt K, Gordijn M, Merrow M. Epidemiology of the human circadian clock. Sleep Med Rev. 2007;11:429–438. doi: 10.1016/j.smrv.2007.07.005. [DOI] [PubMed] [Google Scholar]
- Roenneberg T, Merrow M. Circadian Systems and Metabolism. J Biol Rhythms. 1999;14:449–459. doi: 10.1177/074873099129001019. [DOI] [PubMed] [Google Scholar]
- Roenneberg T, Merrow M. Entrainment of the human circadian clock. Cold Spring Harb Symp Quant Biol. 2007;72:293–299. doi: 10.1101/sqb.2007.72.043. [DOI] [PubMed] [Google Scholar]
- Rutters F, Lemmens SG, Adam TC, Bremmer MA, Elders PJ, Nijpels G, Dekker JM. Is social jetlag associated with an adverse endocrine, behavioral, and cardiovascular risk profile? J Biol Rhythms. 2014;29:377–383. doi: 10.1177/0748730414550199. [DOI] [PubMed] [Google Scholar]
- Scheer FA, Wright KP, Jr, Kronauer RE, Czeisler CA. Plasticity of the intrinsic period of the human circadian timing system. PLoS One. 2007;2:e721. doi: 10.1371/journal.pone.0000721. [DOI] [PMC free article] [PubMed] [Google Scholar]
- Spaeth AM, Dinges DF, Goel N. Effects of experimental sleep restriction on weight gain, caloric intake, and meal timing in healthy adults. Sleep. 2013;36:981–990. doi: 10.5665/sleep.2792. [DOI] [PMC free article] [PubMed] [Google Scholar]
- Walch OJ, Cochran A, Forger DB. A global quantification of ‘normal’ sleep schedules using smartphone data. Sci Adv. 2016;2:e1501705. doi: 10.1126/sciadv.1501705. [DOI] [PMC free article] [PubMed] [Google Scholar]
- Winfree AT. The Geometry of Biological Time. Springer-Verlag; New York: 1980. [Google Scholar]
- Wittmann M, Dinich J, Merrow M, Roenneberg T. Social jetlag: misalignment of biological and social time. Chronobiol Int. 2006;23:497–509. doi: 10.1080/07420520500545979. [DOI] [PubMed] [Google Scholar]
- Wright KP, McHill AW, Birks BR, Griffin BR, Rusterholz T, Chinoy ED. Entrainment of the human circadian clock to the natural light-dark cycle. Curr Biol. 2013;23:1554–1558. doi: 10.1016/j.cub.2013.06.039. [DOI] [PMC free article] [PubMed] [Google Scholar]
- Yetish G, Kaplan H, Gurven M, Wood B, Pontzer H, Manger PR, Wilson C, McGregor R, Siegel JM. Natural sleep and its seasonal variations in three pre-industrial societies. Curr Biol. 2015;25:1–7. doi: 10.1016/j.cub.2015.09.046. [DOI] [PMC free article] [PubMed] [Google Scholar]