Abstract
Postoperative cognitive dysfunction (POCD) is a common postoperative complication observed in elderly patients. Using microarray analyses, we comprehensively compared long non-coding RNA (lncRNA), messenger RNA (mRNA), and microRNA (miRNA) expression profiles in hippocampal tissues from a mouse model of POCD and control mice. A total of 175 lncRNAs, 117 mRNAs, and 26 miRNAs were differentially expressed between POCD and control mice. Gene ontology (GO) and KEGG pathway enrichment analyses were performed to explore the principal functions of dysregulated genes. Correlated coding-noncoding co-expression (CNC) and competing endogenous RNA (ceRNA) expression networks were constructed using bioinformatics methods. lncRNA NONMMUT000708 correlated positively with expression of the inflammation-related gene Hif3a. lncRNAs NONMMUT043249 and NONMMUT028705 mediated gene expression by binding the transcription factor cAMP response element-binding protein (CREB). The constructed ceRNA network suggested lncRNA NONMMUT055714 binds competitively with miR-7684-5p, increasing expression of its target gene, Sorl1. Finally, eight dysregulated lncRNAs, four miRNAs, and ten mRNAs were confirmed via quantitative real-time polymerase chain reaction (PCR) in 10 POCD-healthy mouse paired samples. These results suggest that lncRNAs and miRNAs are involved in POCD pathogenesis and progression. Our ceRNA network will improve understanding of lncRNA-mediated ceRNA regulatory mechanisms operating during the pathogenesis of POCD.
Keywords: microarray, miRNA, long non-coding RNA, competing endogenous RNA, postoperative cognitive dysfunction, Gerotarget
INTRODUCTION
Postoperative cognitive dysfunction (POCD) occurs following anesthetic operations and has numerous triggers. POCD is characterized by a lack of resilience to perioperative stress, which generates cognition-related clinical symptoms [1]. In 1998, the International Study of Postoperative Cognitive Dysfunction (ISPOCD) group conducted a multi-center, systematic neuropsychological assessment using six individual tests to examine POCD incidence among elderly patients who underwent major abdominal, non-cardiac thoracic, or orthopedic surgery [2]. POCD was present in 25.8% of patients seven days post-surgery, and in 9.9% of the patients three months after surgery. This number was reduced to 1% 12 months following the surgery. The specific mechanisms underlying POCD remain unclear, although these likely include β-amyloid (Aβ) deposition [3], phosphorylation of tau proteins [4], inflammation [5–7], and neuronal apoptosis [8, 9]. POCD often leads to delayed post-operative recovery as well as prolonged hospital stays, and increases medical expenses. The molecular mechanisms underlying POCD must therefore be elucidated to develop targeted drugs for prevention, diagnosis, and treatment.
MicroRNAs (miRNAs) are small, single-stranded, non-coding RNAs with approximately 22 nucleotides, which mediate homologous sequence-dependent gene silencing in cells. The brain has the greatest number of enriched miRNAs, which are expressed in a developmental stage-specific, tissue-specific, and cell-specific manner [10]. miRNAs play important roles in development of the neural system, learning, and memory, and cause numerous neurological diseases [11–14]. Long non-coding RNAs (lncRNAs) are RNAs with transcript lengths of > 200 nucleotides, and regulate gene expression through multiple mechanisms. In 2011, Salmena, et al. presented the competing endogenous RNA (ceRNA) hypothesis [15]. In addition to known miRNAs, which affect target RNA stability at the post-transcriptional level, RNAs can, in turn, influence miRNAs by binding target genes. Through miRNA response elements (MREs), various types of RNA transcripts compete with one another for binding to a common miRNA, thereby regulating miRNA-mediated gene silencing. As ceRNAs, lncRNAs have been implicated in the progression of multiple diseases [16–18]. However, the potential roles of lncRNAs as ceRNAs in POCD remain unexplored.
The present study was designed to elucidate the molecular mechanisms underlying non-coding RNAs in POCD. Microarray analysis was performed to compare the hippocampal tissues of mice with POCD (the POCD group) and healthy mice (the control group), and to identify differentially expressed lncRNAs, mRNAs, and miRNAs. We employed GO and KEGG Pathway enrichment analyses to examine differentially expressed genes, and constructed a novel co-expression network of coding-noncoding genes and ceRNAs. Through analysis of the lncRNA/mRNA/miRNA co-expression network, we predicted roles for lncRNAs as ceRNAs in POCD occurrence and development. Finally, we used fluorescence quantitative real-time PCR (qRT-PCR) to confirm expression of 22 genes associated with POCD. Our findings provide a foundation for future research on the potential roles of lncRNAs and miRNAs in POCD.
RESULTS
Behavioral comparisons between POCD and control mice
The behavioral testing design is shown in Figure 1A. The fear conditioning test (FCT) workflow is described in Figure 1B. No differences were detected between control and POCD mice in terms of general locomotion activity, center square duration, or rearing in the OFT (Figure 1C). In the contextual test, the average freezing time of POCD group mice was shorter than that of control mice (P < 0.05) (Figure 1D). However, there was no difference between POCD and control group freezing times in the cued test (Figure 1E).
Figure 1. Experimental design, FCT workflow, and behavioral test results.
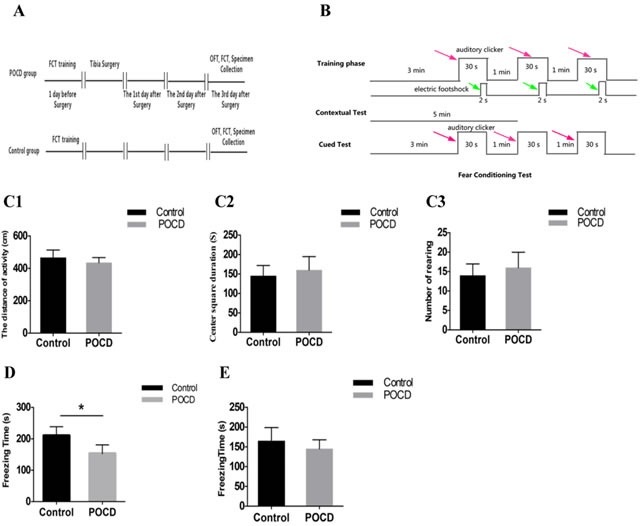
Two groups of mice were given behavioral training 1 d prior to orthopedic surgery (the control group received no specific treatment). Behavioral tests were performed on the third day post-surgery A. FCT: fear conditioning test. OFT: open field test. Red arrows indicate sound stimuli and green arrows indicate electric shock stimuli B. The two groups were subjected to behavioral training 1 d prior to surgery (training phase) and behavioral tests were performed on the third day post-surgery (contextual and cued tests). In the OFT, no noticeable difference was detected in general locomotion activity C1., center square duration C2., or rearing C3. between the two groups. Freezing time was lower in POCD mice than control mice in the contextual test D., but was not different in the cued test E. *P < 0.05.
Differentially expressed lncRNAs, mRNAs, and miRNAs
Microarray analysis was used to identify differentially expressed genes in the hippocampal tissues of three pairs of mice (Figure 2A). lncRNA and mRNA screening criteria were: fold change (FC) > 2.0 and P ≤ 5.0. miRNA screening criteria were: FC > 1.5 and P ≤ 0.05. A total of 175 differentially expressed lncRNAs were identified using microarray analysis, among which, 138 were upregulated and 37 were downregulated. The FC values for upregulated lncRNAs Gm28633 and NONMMUT060658 were > 5 (P < 0.01). 117 mRNAs were differentially expressed; 100 were upregulated and 17 were downregulated. 26 miRNAs were differentially expressed; 15 were upregulated and 11 were downregulated. Upregulated miR-466j exhibited an FC value > 4. All original data have been uploaded and are available at GEO. The miRNA microarray raw data number is GSE95070 and the lncRNA and mRNA raw data number is GSE95426. Using the P-value of the paired sample t-test and the FC values, a volcano plot was constructed to demonstrate differences between the two groups (Figure 2B).
Figure 2. Heatmap and volcano plots showing lncRNA, mRNA, and miRNA levels.
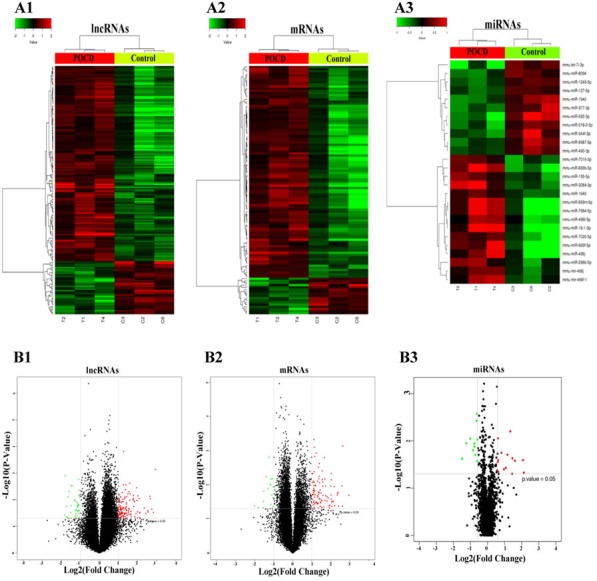
Screening criteria were: FC > 2.0 and P ≤ 0.05 for lncRNAs A1. and mRNAs A2., and FC > 1.5 and P ≤ 0.05 for miRNAs A3. Expression values are depicted in line with the color scale; intensity increases from green to red. Each column represents one sample, and each row indicates a transcript. Volcano plots reflecting number, significance, and reliability of differentially expressed lncRNAs B1., mRNAs B2., and miRNAs B3. The abscissa is log2 (FC value) and the ordinate is -log10 (P-value). Red dots are upregulated genes, green dots are downregulated genes, and black dots are genes that were the same between the two groups.
GO and KEGG pathway analysis
Figure 3 shows gene enrichment in the context of differentially expressed genes between the two groups and in all genetic backgrounds. If the number or frequency of differentially expressed genes is different from the number or frequency of background genes in GO database entries, the differentially expressed genes may be related to a secondary function in the GO database. A GO enrichment analysis on the differentially expressed mRNAs showed that they were mainly related to biological processes and cellular components, and only a few differentially expressed genes were associated with molecular function.
Figure 3. GO secondary ID frequency analysis.
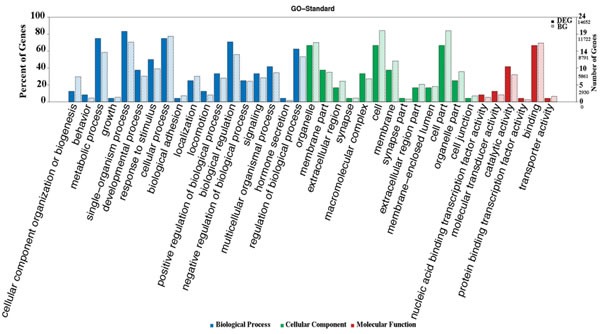
The abscissa of the chart is the classification of the GO database. The left ordinate is the percent of genes. Solid bars: ratio of the number of differentially expressed genes enriched to a secondary function of the GO database to all differentially expressed genes; grid bars: ratio of the number of background genes enriched to a secondary function of the GO database to all genes. The percentage of differentially expressed genes enriched to a secondary function of the GO database may be higher or lower than the percentage of the background genes. The right ordinate is the number of genes. Each node on the right ordinate includes two numbers; the smaller is the number of differentially expressed genes and the larger is the number of background genes. Blue bars are biological processes, green are cellular components, and red are molecular functions.
KEGG pathway enrichment analysis targeting differentially expressed mRNAs (the 10 pathways with the highest enrichment scores were selected) revealed that differentially expressed mRNAs were mainly involved in Wnt, PI3K-AKT, and mTOR signaling. Based on pathway enrichment analysis results, we speculated that pathways enriched with differentially expressed genes might be involved in POCD occurrence and development (Figure 4).
Figure 4. KEGG pathway enrichment analysis for mRNAs with the ten highest enrichment scores.
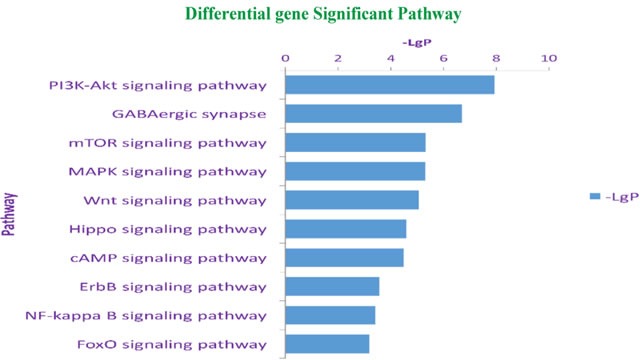
Pathway enrichment analysis includes two steps: (1) map input gene sets into the database, and then annotate the pathways involved in these gene sets; (2) compare the results obtained in the previous step with the background genes, and identify significant enrichment pathways. Statistical testing was performed using Hypergeometric Distribution. The abscissa is -Log P-value (-LgP). The bigger the -LgP, the smaller the P-value, indicating that enrichment of differentially expressed genes in a given pathway was significant.
lncRNA/mRNA co-expression and function prediction
At present, lncRNA function predictions are mainly based on their co-expression with coding genes. After a strict screening process, co-expressed lncRNA-mRNA gene pairs (correlation coefficient > 0.90 or < -0.90, and P < 0.01) were selected (Figure 5). lncRNA NONMMUT060658 was positively correlated with Prr5l, Irx4, Celf6, Lrg1, and Speer4d levels, and negatively correlated with Coq3 expression. lncRNA NONMMUT058334 was negatively correlated with Orly, Dux, Speer4d, and Tango6 levels. lncRNA NONMMUT000708 was positively correlated with Hif3a expression. Co-expressed mRNAs were involved in inflammation, neuronal apoptosis, and metabolic pathways. We established a coding-noncoding gene expression network to analyze non-coding gene functions.
Figure 5. Co-expression network of four lncRNAs with associated mRNAs.
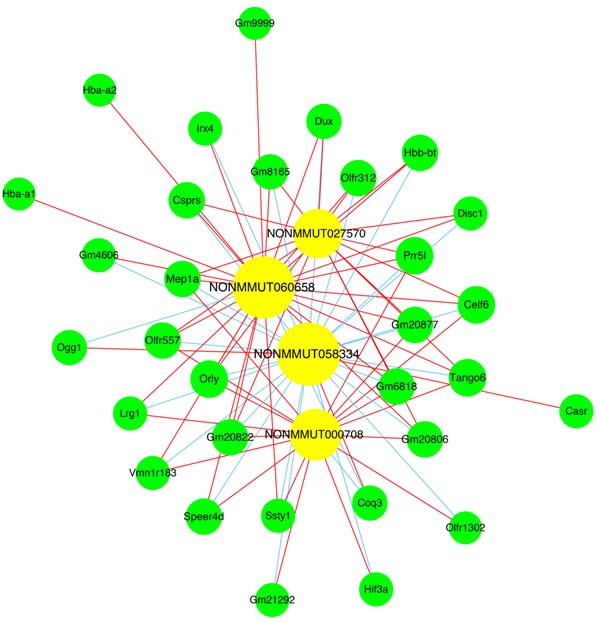
Co-expressed lncRNA-mRNA pairs were identified using strict screening criteria (correlation coefficients > 0.90 or < -0.90, P < 0.01). Yellow circles represent lncRNAs, green circles represent mRNAs, red lines show positive correlations, and blue lines show negative correlations.
Predicting lncRNA target genes and binding with transcription factors
Based on lncRNA and mRNA co-expression patterns (correlation coefficients > 0.90 or < -0.90, and P < 0.01), we predicted potential targets of lncRNAs in cis (cis-prediction) and trans (trans-prediction). Cis-prediction identified lncRNA-mRNA pairs located within 10 kb of one another, while trans-prediction screened lncRNA-mRNA pairs for sequence similarities using the BLAT algorithm (default parameter setting) to align lncRNA and mRNA sequences (3′-UTR). Our findings indicated that NONMMUT034640 regulates Zfp459 and Celf6 expression in trans.
For each lncRNA, we predicted transcription factor binding 2000 bp upstream to 500 bp downstream of the lncRNA initiation site. lncRNAs, NONMMUT043249, NONMMUT028705, XR_886465.1, and PX00200H22 can bind cAMP response element-binding protein (CREB). lncRNA XR_377638.2 can bind with the signal transducer and activator of transcription 3 (STAT3). NONMMUT060658 can bind transcription factors, FOXD3 and HNF-1, and NONMMUT000984 can bind Evi-1 and Oct-1.
Construction of the ceRNA network
We constructed the ceRNA network based on co-expressed miRNAs-mRNAs, miRNAs-lncRNAs, and lncRNAs-mRNAs (Figure 6A-6B). lncRNA NONMMUT060658 can act as a ceRNA and competitively binds miRNA-1249-5p, increasing Hif3a expression. lncRNA NONMMUT055714 binds competitively with miR-7684-5p, increasing Sorl1 expression.
Figure 6. Competing endogenous RNA network in POCD mice.
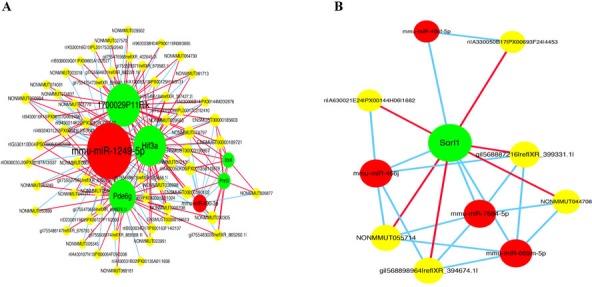
The competing endogenous RNA network is based on miRNA-mRNA, miRNA-lncRNA, and lncRNA-mRNA interactions. Red circles represent miRNAs, yellow circles represent lncRNAs, and green circles represent mRNAs. The link in red indicates a positive correlation between the two connected nodes; the link in blue indicates a negative correlation.
Validation of deregulated lncRNAs, mRNAs, and miRNAs
Based on bioinformatic prediction results, fold changes ( > 2.0), and P-values (P < 0.05), we selected eight lncRNAs, four miRNAs, and ten mRNAs identified from the hippocampal tissues of 10 pairs of mice to validate via qRT-PCR analysis. lncRNAs Gm29198, Gm28633, NONMMUT060658, NONMMUT000984, NONMMUT000708, and NONMMUT027570 were upregulated, while NONMMUT055714 and NONMMUT058334 were downregulated (Figure 7A). miR-7684-5p and miR-466j were upregulated, while miR-1249-5p and miR-490-3p were downregulated (Figure 7B). Prr5l, Hif3a, Tango6, Celf6, and Mep1a mRNAs were upregulated, while Ogg1, Sorl1, Parpbp, Coq3, and Casr were downregulated (Figure 7C). qRT-PCR analysis results were consistent with those of the microarray analyses, confirming the reliability of the microarray results.
Figure 7. Transcript validation via quantitative RT-PCR.
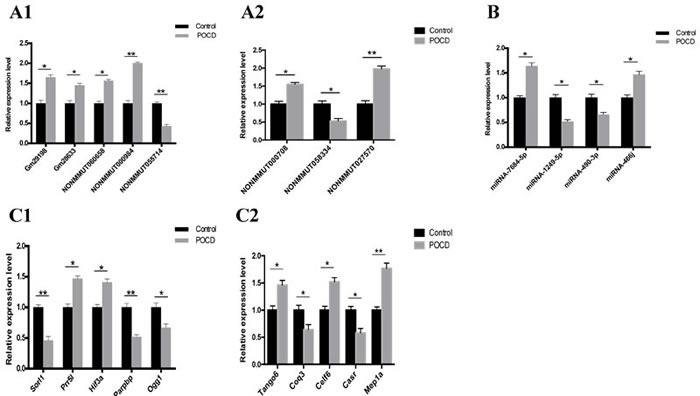
Relative expression of eight lncRNAs A., four miRNAs B., and ten mRNAs C. between the POCD and control groups are shown. *P < 0.05, **P < 0.01.
Construction of the Circos plot
A Circos plot was constructed using the Circos software package to demonstrate miRNA, lncRNA, and mRNA differential expression (from the inner to outer layer) at the genomic level (Figure 8). Upregulation is shown in red and downregulation is shown in green. Height indicates the degree of difference in gene expression.
Figure 8. Differential expression of miRNAs, lncRNAs, and mRNAs.
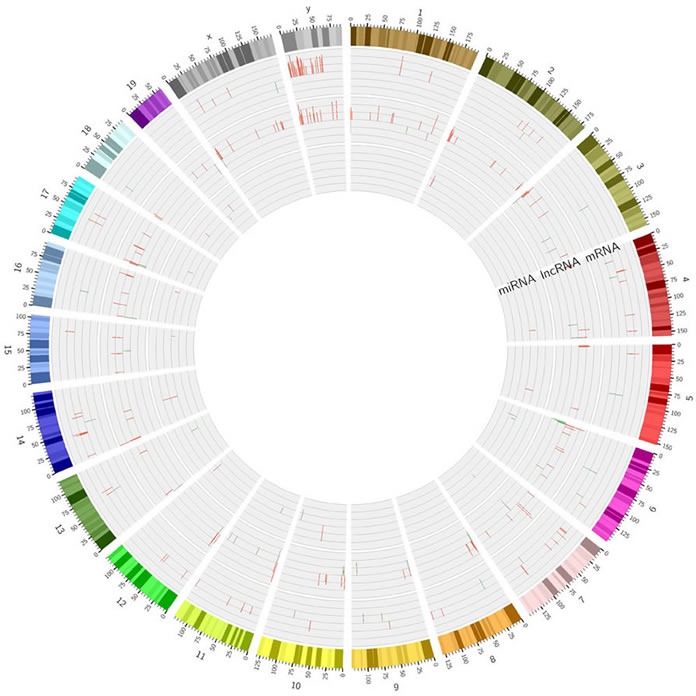
Upregulation is indicated in red, downregulation is shown in green. Height indicates degree of difference in expression.
DISCUSSION
In clinical practice, POCD incidence is higher in patients undergoing orthopedic surgery, especially among elderly patients. The present study employed the animal model of POCD for orthopedic surgery developed by Terrando, et al. [19]. On the third day post-surgery, POCD and control mice showed no differences in general locomotion activity, center square duration, or rearing in the OFT, suggesting that no motor dysfunction was detected in mice after orthopedic surgery. The two groups were then subjected to FCT using the contextual and cued tests to assess the abilities of mice to learn an association between environmental cues and aversive experiences. Previous studies in animals showed that the hippocampus is critical in FCT, and FCT assessment has become a common method for investigating hippocampal-dependent associative memory in models of POCD [20]. The major brain areas involved in contextual and cued fear conditioning include the amygdala, hippocampus, frontal cortex, and cingulate cortex. The frontal/cingulate cortices are areas of attentional learning and are involved in acquisition of new memories [21, 22]. Freezing time, a state of immobility that small rodents tend to present when faced with fear, was shorter in the POCD group than in the control group in the contextual test, indicating that POCD group mice had learning and memory dysfunctions following orthopedic surgery.
On the third day post-surgery, hippocampal tissues were collected from both groups to conduct a microarray screening to identify differentially expressed genes. We identified 175 differentially expressed lncRNAs, 117 differentially expressed mRNAs, and 26 miRNAs. Some of the differentially expressed genes were involved in several essential in vivo biological processes. Prior studies showed that miR-490-3p regulates cell proliferation and apoptosis by targeting CCND1, CDK1, and HMGA2 [23–25]. Lrg1 promotes angiogenesis by modulating transforming growth factor-β (TGF-β) signaling [26]. Ogg1 is involved in immune inflammation, homeostasis, macrophage activation, and regulation of liquid-surface tension through mediation of chemokines, cytokines, integrins, and interleukin signaling [27, 28]. Sorl1 regulates the amyloid precursor protein (APP) metabolic pathway. When newly synthesized APP passes through the Golgi to the plasma membrane, some APP is deconstructed into sAPPα, a non-processed precursor endocytosed from the cell surface into late endosomal compartments for processing into sAPPβ and Aβ. As a sorting protein receptor, Sorl1 can trap APP in the Golgi. Sorl1 can also shuttle APP in the early endosome and the Golgi, upregulating pathways that form soluble APP, downregulating those that form insoluble amyloid, and inhibiting Aβ production and its accumulation in the brain [29]. Thus, Sorl1 is considered the key factor in the pathogenesis of Alzheimer’s disease (AD).
While the specific mechanisms underlying POCD remain unclear, we speculated that the differentially expressed genes identified in our study might promote POCD. Based on GO enrichment analysis results, differentially expressed mRNAs were mainly associated with biological processes and cellular components, and only a small proportion of differentially expressed genes was associated with molecular function. Differentially expressed mRNAs were mainly enriched in biological regulation and metabolic processes in the biological process category.
KEGG pathway analysis for the differentially expressed mRNAs revealed 10 pathways that could be implicated in POCD, including Wnt, PI3K-AKT, phosphatidylinositol, mTOR, and MAPK signaling. These pathways are known to be involved in occurrence and development of neurodegenerative diseases. PI3K-AKT signaling mediates isoflurane anesthesia or surgery-induced inflammation, oxidative stress, and neuronal cell apoptosis, leading to cognitive impairment [30]. We previously showed that activation of mTOR signaling increased β-amyloid production and tau protein phosphorylation, leading to decreased cognitive function after surgery [31]. Wnt signaling mediates synaptic efficacy in the neural circuits of the central nervous system. Intracellular accumulation of β-catenin is a typical Wnt pathway activation marker, and β-catenin tends to be reduced in AD patients [32]. Hence, promoting β-catenin synthesis can enhance expression of Wnt target genes, thereby inhibiting neuronal apoptosis.
To date, the functions of most lncRNAs are unknown. Establishment of a co-expression network of ceRNAs can be used to predict lncRNA function, as these functions can be deduced from the coding genes in the co-expression network. In our study, lncRNA NONMMUT060658 expression correlated positively with that of Prr5l, Irx4, Celf6, Lrg1, and Speer4d, and negatively with that of Coq3. lncRNA NONMMUT058334 expression correlated negatively with that of Orly, Dux, Speer4d, and Tango6, and lncRNA NONMMUT000708 expression correlated positively with that of Hif3a. The mRNAs in the co-expression network were involved in inflammation, neuronal apoptosis, and metabolic pathways [33–35]. Our findings suggest that these differentially expressed lncRNAs participate in POCD by interacting with their corresponding coding genes.
Some lncRNAs can act as ligands and bind transcription factors to form complexes that control target gene transcriptional activity. In our study, lncRNAs NONMMUT043249, NONMMUT028705, XR_886465.1, and PX00200H22 could bind CREB, and lncRNA XR_377638.2 could bind STAT3. CREB functions in transcriptional regulation through phosphorylation. It is a key regulator of long-term memory formation and can facilitate long-term potentiation (LTP) in animals, including mice [36, 37]. In addition, changes in CREB phosphorylation can affect neuronal synaptic plasticity and the formation of neural networks [38]. STAT3 is a signal transducer and transcriptional activator, transmitting extracellular signals into the nucleus. It participates in many physiological processes, including cellular growth, proliferation, differentiation, and apoptosis, as well as the development of the central nervous system. STAT3 plays an important role in learning and memory in both humans and animals, and is closely associated with cognitive dysfunction and dementia [39]. Thus, these differentially expressed lncRNAs could promote POCD progression by binding transcription factors.
The ceRNA hypothesis states that mRNA, lncRNA, pseudogene transcripts, and circular RNAs (circRNAs) compete to bind the same miRNA to influence target gene stability or translational activity, thereby regulating gene expression at the post-transcriptional level. In this study, we constructed a ceRNA network based on miRNA-mRNA, miRNA-lncRNA, and lncRNA-mRNA co-expression patterns. For example, as a ceRNA, lncRNA NONMMUT055714 competes for binding to miR-7684-5p, thereby affecting Sorl1 expression. Sorl1 increases Aβ production in the brains of elderly patients, increasing AD risk [29]. Additionally, Aβ over-deposition can trigger oxidative stress and autophagy, induce neuronal apoptosis and pro-inflammatory cytokine-dependent activation of glial cells, cause synaptic dysfunction, and accelerate abnormal phosphorylation of tau proteins, thus promoting POCD [40, 41]. Further research on NONMMUT055714 as a competitive endogenous RNA regulating Sorl1 expression in postoperative cognitive dysfunction is underway in our laboratory. Understanding this novel RNA crosstalk will provide insights into gene regulatory networks with implications in human development and diseases.
Our study presents some limitations. First, we only screened genes differentially expressed in POCD mice on the third day after surgery. Thus, we do not know whether gene expression changed with time post-surgery. Second, while our bioinformatics analyses found that some of the differentially expressed genes may be related to POCD, these genes must be validated in future studies. Finally, we screened differentially expressed genes in a small number of samples. In our study protocol, five pairs of hippocampal tissues were used for microarray screening, but two pairs could not be included because of poor clustering. This can be explained two possible ways. First, although we randomly selected mice from the two groups, we cannot avoid biological differences between individuals. Second, RNA degradation may have occurred during the process of hippocampal tissue collection or total RNA extraction, which led to the poor clustering between the two pairs of tissue. However, all behavioral test results were performed on eight mice in each group. We used the two tailed test; effect size was 1.523 (calculated by the mean and standard deviation of the two groups), alpha = 0.05, and Power (1- beta) was 0.81 as calculated using G*Power software.
In conclusion, we employed microarray analyses to screen differentially expressed lncRNAs, miRNAs, and miRNAs in hippocampal tissues from POCD and control mice. Through GO and KEGG pathway enrichment analyses and construction of a co-expression network of lncRNAs-mRNAs and ceRNAs, we assessed the functions of these differentially expressed genes, correlated pathways, and mutual regulatory relationships between coding and noncoding genes. Our findings contribute to the understanding of POCD pathogenesis and provide a foundation for future studies of the molecular mechanisms underlying POCD.
MATERIALS AND METHODS
Animals
C57BL/6 mice used in this study were purchased from Beijing Vital River Laboratory Animal Technology Co., Ltd. (Beijing, China). Mice were male, aged 12-14 months, and weighed 25-35 g. Room temperature and humidity were controlled at 25°C and 55%, respectively. All mice were acclimated to the environment for one week prior to study initiation. The experiment was conducted in accordance with the “Guide for the Care and Use of Laboratory Animals” issued by the National Institutes of Health, and was approved by the Animal Ethics Committee of the Beijing Chao-Yang Hospital, Capital Medical University. Mice were randomly assigned into two groups: the POCD group and the control group (n = 8 mice per group). Both control and POCD group mice were given behavioral training (pre-operation training for the Fear Conditioning Test [FCT]) one day prior to POCD group surgery, and two behavioral tests (Open Field Test [OFT] and FCT) on the third day following surgery. Mice were anesthetized using isoflurane; hippocampal tissue was removed, immediately placed in liquid nitrogen, and then stored at −80°C until further examination.
Animal model of POCD
The surgical model [19] can be described as follows: A left tibial fracture was performed with an intramedullary nail fixation on the mice from the POCD group under isoflurane anesthesia (2% isoflurane for induction, and 1.5% maintenance; Baxter International, Inc., Deerfield, IL, USA) and butorphanol (0.1 mg/kg, subcutaneous injection; Jiangsu Hengrui Medicine Co. Ltd., Lianyungang, China). Mouse left hind paws were disinfected three times with povidone-iodine, and scalpel was used to perform a longitudinal incision on the paw. Following the incision, a 0.38 mm pin was inserted in the tibial medullary canal. Following stripping of the periosteum, osteotomy, and irrigation, the skin of the wound was closed with 5-0 nylon sutures. Isoflurane was discontinued immediately after the operation, and animals were placed back in their cages, where they awoke naturally. After the operation, a heating pad and a temperature control lamp were used to maintain mouse body temperatures at approximately 37°C. Behavioral tests (OFT and FCT) were performed on the third day after the operation. Control mice were assessed using the same behavioral tests at the same time as POCD group mice, but did not receive any prior treatment or surgery.
Open field test (OFT)
OFT [42] was used to evaluate anxiety and locomotor activity in experimental animals. A mouse was placed directly into the center of the open field (100 cm × 100 cm × 48 cm, length × width × height). Mouse movements were recorded using a digital camera during 5-min testing sessions. General locomotion activity (total number of grid lines crossed by each mouse), center square duration (time spent by each mouse in the central square), and rearing (frequency at which each mouse stands on their hind legs in the open field) were counted.
Fear conditioning test (FCT)
The purpose of the FCT is to investigate the animals’ abilities to learn and memorize associations between unpleasant experiences and environmental implications. Sound and light are commonly used as conditioning stimuli (CS), while an aversive stimulus (such as an electric shock to the foot) acts as an unconditional stimulus (US). The two types of stimuli appear in pairs during the test. After CS-US training, in addition to the association between the sound and electric shock, animals are able to associate the link between the electric shock and the surrounding environment.
One day prior to the operation, after a three-min exploration period, mice were given three pairs of sound stimuli (2000 Hz, 90 Db, and 30 sec) and electric shock stimuli (1 mA, 2 sec). Each electric shock stimulus was given at the last two sec of the corresponding sound stimulus, and both ended at the same time. There was an interval of one min between two pairs of stimuli.
On the third day following the operation, the contextual test and the cued test were performed. During the contextual test, mice were placed in a context similar to that of the pre-operation training for a five-min observation period without the stimulation of sound and electric shock. During the cued test, two h after the completion of the contextual test, mice were placed in a context different from that of the pre-operation training (the interior was changed). After a three-min exploration period, mice were given three sound stimuli (2000 Hz, 90 Db, and 30 sec) without an electric shock stimulus. The interval between two stimuli was one min. The observation time lasted five min. Image analysis software was utilized to calculate the freezing times of the mice in the contextual and cued tests.
RNA extraction
Total RNA was extracted from the POCD and control group hippocampal tissues using TRIzol (Invitrogen, Carlsbad, CA, USA) according to the manufacturer’s instructions. Total RNA was assessed via electrophoresis on a denaturing agarose gel and quantified using a NanoDrop spectrophotometer (NanoDrop, Wilmington, DE, USA).
Quantitative real-time PCR validation
Ten pairs of hippocampal tissues were used for qRT-PCR validation. After RNA isolation, M-MLV reverse transcription (Promega, Madison, WI, USA) was used to synthesize cDNA. Quantitative PCR analysis and data collection were performed on the ABI 7500 qPCR system (Applied Biosystems, Foster City, CA, USA). Primer pairs are listed in Table 1. Relative gene expression was calculated using the 2−ΔΔCt method, and fold changes are shown as means ± standard deviation (SD) from three independent experiments. U6 and β-actin were used as references.
Table 1. PCR primers used in this study.
| Forward | Reverse | |
|---|---|---|
| Gm29198 | 5′TCCAGTCATACCAGGGCTTC3′ | 5′GGCTTTGTTGCCCAATAGAC3′ |
| Gm28633 | 5′GATCCGGCACCACATTTACT3 ‘ | 5′CCTTGCTGCTCTGGAGACTT3 |
| NONMMUT060658 | 5′TTCCACCTGGTCAGAGATCC3′ | 5′GATGCCTCTGCAAATTGGTT3′ |
| NONMMUT055714 | 5′CAGCTGGCATAGGGTGTGTA3′ | 5AAAGAGGCAATCAATGAAGAGC3′ |
| NONMMUT000984 | 5′CAGTGTCAGCAGGTGGAAGA3′ | 5TAAGGCCTGGAATCCTGATG3′ |
| NONMMUT000708 | 5′CAGCTCCTGCTTTCTGACCT3′ | 5′CCTGCACAAACATCATGACC3′ |
| NONMMUT058334 | 5′GCATCTGAAACGCAGAACCT3′ | 5AGCGCAGAGGTCAGTGAAAT3′ |
| NONMMUT027570 | 5′AAAGAGGCACCAGTTTCACG3′ | 5CTGCTTGCTGGCTATTCCTC3′ |
| miR-7684-5p* | 5′TCTGGGAAGCCTGGGCAGCA3′ | |
| miR-1249-5p* | 5′ATAGGAGGGAGGGGATGGGC3′ | |
| miR-490-3p* | 5′CAACCTGGAGGACTCCATGCTG3′ | |
| miR-466j* | 5′CGTGTGTGCATGTGCATGTGTGTAA3′ | |
| Ogg1 | 5′CCCTAGAGGAGCTGGAAACC3′ | 5′CAGCAGTCTCACACCTTGGA3 |
| Sorl1 | 5′CAGCACCTTGACCTGTACGA3′ | 5′GCCTTCTCATCGCTCTCATC3′ |
| Prr5l | 5′TCTGGGACCACTTCTTCACC3′ | 5′GCTTCACCTTCAGCAAGACC3′ |
| Hif3a | 5′GCAATGCCTGGTGCTTATCT3′ | 5′TCCTCTCGTCGCAGTATGTG3′ |
| Parpbp | 5′CACATGCCAGAGTCACCAGT3′ | 5′TTGAGAATGGAAGCCAAAGC3′ |
| Tango6 | 5′CGTGGTTCATGAGGTGACAG3′ | 5′GTTGCTTTCTGGCTGAGTCC3 |
| Coq3 | 5′CGGGACCATGTGCTTTAGAT3′ | 5′ACCTCCCTGCTGTCAACTGT3 |
| Celf6 | 5′CAGCTCTGCCTCAACAACAA3′ | 5′AGAGACAACAGCTCCGAAGG3 |
| Casr | 5′TTCCTCCCTGATTGCTATGC3′ | 5′TTCCTGGGATGGACTTTCTG3 |
| Mep1a | 5′GCTCTGGGATTCTTCCATGA3′ | 5′GGTCTGTGATGGTGTTGTCG3 |
| U6 | 5′CTCGCTTCGGCAGCACA3′ | 5′AACGCTTCACGAATTTGCGT3′ |
| β-actin | 5′CCTGTACGCCAACACAGTGC3′ | 5′ATACTCCTGCTTGCTGATCC3′ |
* PCR cassettes used (Qiagen, Valencia, CA, USA) contained reverse primers. Only forward primers are listed.
Microarrays
DNA microarray analyses were conducted to compare the hippocampal tissues of mice from the POCD and control groups. The Agilent mouse lncRNA + mRNA Array V.1.0 platform was utilized to analyze lncRNA and mRNA profiles, and the Affymetrix _7G_ miRNA 4.0 Array was used to analyze miRNA profiles. Screening of differentially expressed genes from the study was conducted by the CapitalBio Corporation & National Engineering Research Center for Beijing Biochip Technology. The procedure included the following steps: sample RNA extraction; sample RNA quality analysis; total RNA > 1 μg; cDNA formation; sense cDNA fragmentation; biotin labeling; chip hybridization; chip elution; chip scanning; signal value detecting and filtering, and removing signals that were weaker than the background; and hybridization image analysis. The Agilent GeneSpring software package was utilized to normalize and analyze extracted lncRNA and mRNA data, and miRNA data were analyzed using the miRNA QC Tool with Affymetrix default analysis settings and quantile as the normalization method.
Construction of the ceRNA co-expression network
The ceRNA co-expression network was constructed as follows: (1) negatively correlated miRNA-mRNA pairs were screened, where the mRNA was the target of the miRNA; (2) negatively correlated miRNA-lncRNA pairs were screened, where the lncRNA was the target of the miRNA; (3) a lncRNA-mRNA integration analysis was performed by screening lncRNA-mRNA pairs with positive co-expression relationships; (4) a list of lncRNA-mRNA pairs was constructed based on the shared miRNA by comparing the screened results of (1) and (2); (5) the intersection of the screened results of (3) and (4) was analyzed to identify lncRNA-miRNA-mRNA triplets, also known as ceRNAs.
Statistical analysis
Data were analyzed using GraphPad PRISM version 6 software (San Diego, CA, USA) and average values in each experimental group were expressed as means ± SD. Student’s t-tests were used to analyze behavioral and qRT-PCR data. P < 0.05 was considered statistically significant.
Acknowledgments
We would like to extend our sincerely gratitude to Associate Professor Jia Yanjun and Professor Huang Xiaoxi from the Medical Research Center of Beijing Chao-Yang Hospital, Capital Medical University, for their guidance and help in the establishment of the animal model for POCD and the techniques used in this study.
Footnotes
CONFLICTS OF INTEREST
The authors declare no conflicts of interest.
GRANT SUPPORT
This work was supported by the National Natural Science Foundation of China (N0. 81371199).
REFERENCES
- 1.Berger M, Nadler JW, Browndyke J, Terrando N, Ponnusamy V, Cohen HJ, Whitson HE, Mathew JP. Postoperative Cognitive Dysfunction: Minding the Gaps in Our Knowledge of a Common Postoperative Complication in the Elderly. Anesthesiol Clin. 2015;33:517–550. doi: 10.1016/j.anclin.2015.05.008. [DOI] [PMC free article] [PubMed] [Google Scholar]
- 2.Moller JT, Cluitmans P, Rasmussen LS, Houx P, Rasmussen H, Canet J, Rabbitt P, Jolles J, Larsen K, Hanning CD, Langeron O, Johnson T, Lauven PM, et al. Long-term postoperative cognitive dysfunction in the elderly ISPOCD1 study. ISPOCD investigators. International Study of Postoperative Cognitive Dysfunction. Lancet. 1998;351:857–861. doi: 10.1016/s0140-6736(97)07382-0. [DOI] [PubMed] [Google Scholar]
- 3.Xu J, Zhang R, Zuo P, Yang N, Ji C, Liu W, Wang Y, Wang H, Wu A, Yue Y, Liu Y. Aggravation effect of isoflurane on apoptosis and Tau hyperphosphorylation in Aβ25-35 induced PC12 cells. Cell Mol Neurobiol. 2012;32:1343–1351. doi: 10.1007/s10571-012-9860-0. [DOI] [PMC free article] [PubMed] [Google Scholar]
- 4.Planel E, Richter KE, Nolan CE, Finley JE, Liu L, Wen Y, Krishnamurthy P, Herman M, Wang L, Schachter JB, Nelson RB, Lau LF, Duff KE. Anesthesia leads to tau hyperphosphorylation through inhibition of phosphatase activity by hypothermia. J Neurosci. 2007;27:3090–3097. doi: 10.1523/JNEUROSCI.4854-06.2007. [DOI] [PMC free article] [PubMed] [Google Scholar]
- 5.Hu N, Guo D, Wang H, Xie K, Wang C, Li Y, Wang C, Wang C, Yu Y, Wang G. Involvement of the blood-brain barrier opening in cognitive decline in aged rats following orthopedic surgery and high concentration of sevoflurane inhalation. Brain Res. 2014;1551:13–24. doi: 10.1016/j.brainres.2014.01.015. [DOI] [PubMed] [Google Scholar]
- 6.Terrando N, Eriksson LI, Ryu JK, Yang T, Monaco C, Feldmann M, Jonsson Fagerlund M, Charo IF, Akassoglou K, Maze M. Resolving postoperative neuroinflammation and cognitive decline. Ann Neurol. 2013;70:986–995. doi: 10.1002/ana.22664. [DOI] [PMC free article] [PubMed] [Google Scholar]
- 7.Zhang X, Dong H, Li N, Zhang S, Sun J, Zhang S, Qian Y. Activated brain mast cells contribute to postoperative cognitive dysfunction by evoking microglia activation and neuronal apoptosis. J Neuroinflammation. 2016;13:127. doi: 10.1186/s12974-016-0592-9. [DOI] [PMC free article] [PubMed] [Google Scholar]
- 8.Vacas S, Degos V, Tracey KJ, Maze M. High-mobility group box 1 protein initiates postoperative cognitive decline by engaging bone marrow-derived macrophages. Anesthesiology. 2014;120:1160–1167. doi: 10.1097/ALN.0000000000000045. [DOI] [PMC free article] [PubMed] [Google Scholar]
- 9.Qi Z, Tianbao Y, Yanan L, Xi X, Jinhua H, Qiujun W. Pre-treatment with nimodipine and 7.5% hypertonic saline protects aged rats against postoperative cognitive dysfunction via inhibiting hippocampal neuronal apoptosis. Behav Brain Res. 2017;321:1–7. doi: 10.1016/j.bbr.2016.12.029. [DOI] [PubMed] [Google Scholar]
- 10.Rao YS, Pak TR. microRNAs and the adolescent brain: Filling the knowledge gap. Neuroscience Biobehavioral Reviews. 2016;70:313–322. doi: 10.1016/j.neubiorev.2016.06.008. [DOI] [PMC free article] [PubMed] [Google Scholar]
- 11.Kempf SJ, Metaxas A, Ibáñez-Vea M, Darvesh S, Finsen B, Larsen MR. An integrated proteomics approach shows synaptic plasticity changes in an APP/PS1 Alzheimer’s mouse model. Oncotarget. 2016;7:33627–33648. doi: 10.18632/oncotarget.9092. https://doi.org/10.18632/oncotarget.9092. [DOI] [PMC free article] [PubMed] [Google Scholar]
- 12.Yeh WL, Lin HY, Huang CY, Huang BR, Lin C, Lu DY, Wei KC. Migration-prone glioma cells show curcumin resistance associated with enhanced expression of miR-21 and invasion/anti-apoptosis-related proteins. Oncotarget. 2015;6:37770–37781. doi: 10.18632/oncotarget.6092. https://doi.org/10.18632/oncotarget.6092. [DOI] [PMC free article] [PubMed] [Google Scholar]
- 13.Li F, Wei G, Bai Y, Li Y, Huang F, Lin J, Hou Q, Deng R, Zhou JH, Zhang SX, Chen DF. MicroRNA-574 is involved in cognitive impairment in 5-month-old APP/PS1 mice through regulation of neuritin. Brain Res. 2015;19:177–188. doi: 10.1016/j.brainres.2015.09.022. [DOI] [PubMed] [Google Scholar]
- 14.Yan S, Zhang H, Xie W, Meng F, Zhang K, Jiang Y, Zhang X, Zhang J. Altered microRNA profiles in plasma exosomes from mesial temporal lobe epilepsy with hippocampal sclerosis. Oncotarget. 2017;8:4136–4146. doi: 10.18632/oncotarget.13744. https://doi.org/10.18632/oncotarget.13744. [DOI] [PMC free article] [PubMed] [Google Scholar]
- 15.Salmena L, Poliseno L, Tay Y, Kats L, Pandolfi PP. A ceRNA hypothesis: the Rosetta Stone of a hidden RNA language? Cell. 2011;146:353–358. doi: 10.1016/j.cell.2011.07.014. [DOI] [PMC free article] [PubMed] [Google Scholar]
- 16.Bian EB, Ma CC, He XJ, Wang C, Zong G, Wang HL, Zhao B. Epigenetic modification of miR-141 regulates SKA2 by an endogenous ‘sponge’ HOTAIR in glioma. Oncotarget. 2016;7:30610–30625. doi: 10.18632/oncotarget.8895. https://doi.org/10.18632/oncotarget.8895. [DOI] [PMC free article] [PubMed] [Google Scholar]
- 17.Cao Y, Wang P, Ning S, Xiao W, Xiao B, Li X. Identification of prognostic biomarkers in glioblastoma using a long non-coding RNA-mediated, competitive endogenous RNA network. Oncotarget. 2016;7:41737–41747. doi: 10.18632/oncotarget.9569. https://doi.org/10.18632/oncotarget.9569. [DOI] [PMC free article] [PubMed] [Google Scholar]
- 18.Tay Y, Rinn J, Pandolfi PP. The multilayered complexity of ceRNA crosstalk and competition. Nature. 2014;505:344–352. doi: 10.1038/nature12986. [DOI] [PMC free article] [PubMed] [Google Scholar]
- 19.Terrando N, Gómez-Galán M, Yang T, Carlström M, Gustavsson D, Harding RE, Lindskog M, Eriksson LI. Aspirin-triggered resolvin D1 prevents surgery-induced cognitive decline. FASEB J. 2013;27:3564–3571. doi: 10.1096/fj.13-230276. [DOI] [PubMed] [Google Scholar]
- 20.Broadbent NJ, Squire LR, Clark RE. Spatial memory, recognition memory, and the hippocampus. Proc Natl Acad Sci U S A. 2004;101:14515–14520. doi: 10.1073/pnas.0406344101. [DOI] [PMC free article] [PubMed] [Google Scholar]
- 21.Maren S, Phan KL, Liberzon I. The contextual brain: implications for fear conditioning, extinction and psychopathology. Nat Rev Neurosci. 2013;14:417–428. doi: 10.1038/nrn3492. [DOI] [PMC free article] [PubMed] [Google Scholar]
- 22.Zhang C, Zhang Y, Shen Y, Zhao G, Xie Z, Dong Y. Anesthesia/Surgery Induces Cognitive Impairment in Female Alzheimer’s Disease Transgenic Mice. J Alzheimers Dis. 2017;57:505–518. doi: 10.3233/JAD-161268. [DOI] [PubMed] [Google Scholar]
- 23.Gu H, Yang T, Fu S, Chen X, Guo L, Ni Y. MicroRNA-490-3p inhibits proliferation of A549 lung cancer cells by targeting CCND1. Biochem Biophys Res Commun. 2014;444:104–108. doi: 10.1016/j.bbrc.2014.01.020. [DOI] [PubMed] [Google Scholar]
- 24.Chen S, Chen X, Xiu YL, Sun KX, Zhao Y. MicroRNA-490-3P targets CDK1 and inhibits ovarian epithelial carcinoma tumorigenesis and progression. Cancer Lett. 2015;362:122–130. doi: 10.1016/j.canlet.2015.03.029. [DOI] [PubMed] [Google Scholar]
- 25.Liu W, Xu G, Liu H, Li T. MicroRNA-490-3p regulates cell proliferation and apoptosis by targeting HMGA2 in osteosarcoma. FEBS Lett. 2015;589:3148–3153. doi: 10.1016/j.febslet.2015.08.034. [DOI] [PubMed] [Google Scholar]
- 26.Zhong D, He G, Zhao S, Li J, Lang Y, Ye W, Li Y, Jiang C, Li X. LRG1 modulates invasion and migration of glioma cell lines through TGF-β signaling pathway. Acta Histochem. 2015;117:551–558. doi: 10.1016/j.acthis.2015.05.001. [DOI] [PubMed] [Google Scholar]
- 27.Ba X, Aguilera-Aguirre L, Rashid QT, Bacsi A, Radak Z, Sur S, Hosoki K, Hegde ML, Boldogh I. The role of 8-oxoguanine DNA glycosylase-1 in inflammation. Int J Mol Sci. 2014;15:16975–16997. doi: 10.3390/ijms150916975. [DOI] [PMC free article] [PubMed] [Google Scholar]
- 28.Aguilera-Aguirre L, Hosoki K, Bacsi A, Radák Z, Wood TG, Widen SG, Sur S, Ameredes BT, Saavedra-Molina A, Brasier AR, Ba X, Boldogh I. Whole transcriptome analysis reveals an 8-oxoguanine DNA glycosylase-1-driven DNA repair-dependent gene expression linked to essential biological processes. Free Radic Biol Med. 2015;81:107–118. doi: 10.1016/j.freeradbiomed.2015.01.004. [DOI] [PMC free article] [PubMed] [Google Scholar]
- 29.Schmidt V, Subkhangulova A, Willnow TE. Sorting receptor SORLA: cellular mechanisms and implications for disease. Cell Mol Life Sci. 2017;74:1475–1483. doi: 10.1007/s00018-016-2410-z. [DOI] [PMC free article] [PubMed] [Google Scholar]
- 30.Zhang Y, Zhang Z, Wang H, Cai N, Zhou S, Zhao Y, Chen X, Zheng S, Si Q, Zhang W. Neuroprotective effect of ginsenoside Rg1 prevents cognitive impairment induced by isoflurane anesthesia in aged rats via antioxidant, anti-inflammatory and anti-apoptotic effects mediated by the PI3K/AKT/GSK-3β pathway. Mol Med Rep. 2016;14:2778–2784. doi: 10.3892/mmr.2016.5556. [DOI] [PubMed] [Google Scholar]
- 31.Shen W, Lu K, Wang J, Wu A, Yue Y. Activation of mTOR signaling leads to orthopedic surgery-induced cognitive decline in mice through β-amyloid accumulation and tau phosphorylation. Mol Med Rep. 2016;14:3925–3934. doi: 10.3892/mmr.2016.5700. [DOI] [PubMed] [Google Scholar]
- 32.Zheng Y, Wang J, Li D, Guo M, Zhen M, Chang Q. Wnt/β-Catenin Signaling Pathway Against Aβ Toxicity in PC12 Cells. Neurosignals. 2016;24:40–47. doi: 10.1159/000442610. [DOI] [PubMed] [Google Scholar]
- 33.Meng H, Song Y, Zhu J, Liu Q, Lu P, Ye N, Zhang Z, Pang Y, Qi J, Wu H. LRG1 promotes angiogenesis through upregulating the TGF-β1 pathway in ischemic rat brain. Mol Med Rep. 2016;14:5535–5543. doi: 10.3892/mmr.2016.5925. [DOI] [PMC free article] [PubMed] [Google Scholar]
- 34.Thedieck K, Polak P, Kim ML, Molle KD, Cohen A, Jenö P, Arrieumerlou C, Hall MN. PRAS40 and PRR5-like protein are new mTOR interactors that regulate apoptosis. PLoS One. 2007;2:e1217. doi: 10.1371/journal.pone.0001217. [DOI] [PMC free article] [PubMed] [Google Scholar]
- 35.Kumar H, Lim JH, Kim IS, Choi DK. Differential regulation of HIF-3α in LPS-induced BV-2 microglial cells: Comparison and characterization with HIF-1α. Brain Res. 2015;1610:33–41. doi: 10.1016/j.brainres.2015.03.046. [DOI] [PubMed] [Google Scholar]
- 36.Melgarejo da Rosa M, Yuanxiang P, Brambilla R, Kreutz MR, Karpova A. Synaptic GluN2B/CaMKII-α Signaling Induces Synapto-Nuclear Transport of ERK and Jacob. Front Mol Neurosci. 2016;9:66. doi: 10.3389/fnmol.2016.00066. [DOI] [PMC free article] [PubMed] [Google Scholar]
- 37.Posada-Duque RA, Ramirez O, Härtel S, Inestrosa NC, Bodaleo F, González-Billault C, Kirkwood A. Cardona-Gómez GP. CDK5 downregulation enhances synaptic plasticity. Cell Mol Life Sci. 2017;74:153–172. doi: 10.1007/s00018-016-2333-8. [DOI] [PMC free article] [PubMed] [Google Scholar]
- 38.Zhou L, Chen T, Li G, Wu C, Wang C, Li L, Sha S, Chen L, Liu G, Chen L. Activation of PPARγ Ameliorates Spatial Cognitive Deficits through Restoring Expression of AMPA Receptors in Seipin Knock-Out Mice. J Neurosci. 2016;36:1242–1253. doi: 10.1523/JNEUROSCI.3280-15.2016. [DOI] [PMC free article] [PubMed] [Google Scholar]
- 39.Wang ZJ, Han WN, Yang GZ, Yuan L, Liu XJ, Li QS, Qi JS. The neuroprotection of Rattin against amyloid β peptide in spatial memory and synaptic plasticity of rats. Hippocampus. 2014;24:44–53. doi: 10.1002/hipo.22202. [DOI] [PubMed] [Google Scholar]
- 40.Wan Y, Xu J, Meng F, Bao Y, Ge Y, Lobo N, Vizcaychipi MP, Zhang D, Gentleman SM, Maze M, Ma D. Cognitive decline following major surgery is associated with gliosis, β-amyloid accumulation, and τ phosphorylation in old mice. Crit Care Med. 2010;38:2190–2198. doi: 10.1097/CCM.0b013e3181f17bcb. [DOI] [PubMed] [Google Scholar]
- 41.Hwang CJ, Park MH, Hwang JY, Kim JH, Yun NY, Oh SY, Song JK, Seo HO, Kim YB, Hwang DY, Oh KW, Han SB, Hong JT. CCR5 deficiency accelerates lipopolysaccharide-induced astrogliosis, amyloid-beta deposit and impaired memory function. Oncotarget. 2016;7:11984–11999. doi: 10.18632/oncotarget.7453. https://doi.org/10.18632/oncotarget.7453. [DOI] [PMC free article] [PubMed] [Google Scholar]
- 42.Terrando N, Yang T, Wang X, Fang J, Cao M, Andersson U, Erlandsson HH, Ouyang W, Tong J. Systemic HMGB1 Neutralization Prevents Postoperative Neurocognitive Dysfunction in Aged Rats. Front Immunol. 2016;7:441. doi: 10.3389/fimmu.2016.00441. [DOI] [PMC free article] [PubMed] [Google Scholar]


