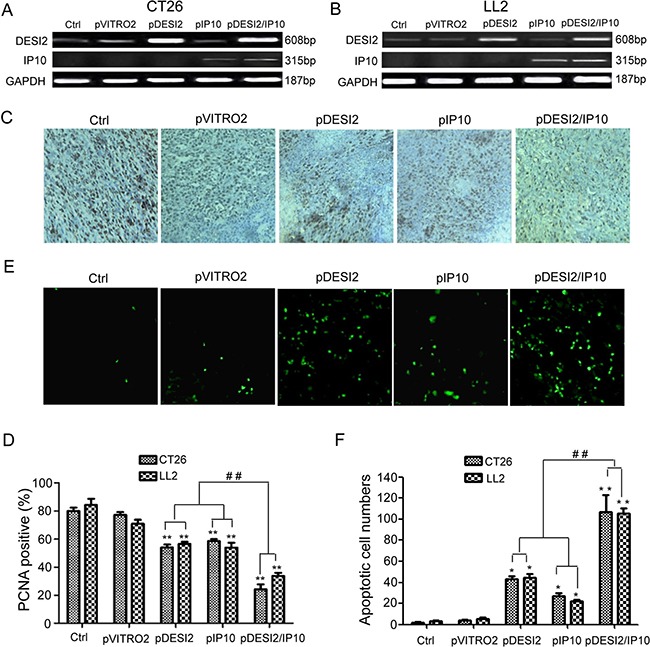
Figure 4. Inhibition of proliferation of tumor cells via apoptosis in vivo by DESI2 and/or IP10.

(A) RT-PCR analysis of expression of exogenous DESI2 and/or IP10 in LL2 tumor tissues. When mice were killed at the end of gene therapy-related experiments, tumor tissues from one mouse, which was randomly taken out from each group, were collected for detecting DESI2/IP10 expression by RT-PCR. (B) RT-PCR analysis of expression of exogenous DESI2 and/or IP10 in CT26 tumor tissues. (C) PCNA staining of tumor tissues. Representative sections were taken from CT26 tumor tissues of mice receiving 5% GS, pVITRO2, pDESI2, pIP10, pDESI2/IP10 (original magnification, ×400). (D) PCNA-labeling index within CT26 and LL2 tumor tissues were estimated as the percentage of positive nuclear staining in the total number of neoplastic cells counted. Statistically significant difference in the number of PCNA-positive cells for tumors treated with DESI2 or IP10 versus 5% GS and pVITRO2 controls (**P < 0.01); significant difference for tumors treated with pDESI2/IP10 versus the two controls (**P < 0.001); and significant difference for the combination therapy versus DESI2 or IP10 monotherapy (##P < 0.01). Bars, SD; columns, mean (n = 3). (E) TUNEL staining of tumor tissues. Representative sections were taken from CT26 tumor tissues of mice receiving 5% GS, pVITRO2, pDESI2, pIP10, pDESI2/IP10 (original magnification, ×400). (F) Apoptotic index within CT26 and LL2 tumor tissues were counted. Statistically significant difference in the apoptotic index for tumors treated with DESI2 or IP10 versus 5% GS and pVITRO2 controls (*P < 0.05); significant difference for tumors treated with pDESI2/IP10 versus the two controls (**P < 0.01); and significant difference for the combination therapy versus DESI2 or IP10 monotherapy (##P < 0.01). The apoptotic index was calculated as a ratio of the apoptotic cell number to the total cell number in each field. Bars, SD; columns, mean (n = 3).
