Abstract
In the present study, we assessed the genetic diversities of the Chinese Kazak ethnic group on the basis of 30 well-chosen autosomal insertion and deletion loci and explored the genetic relationships between Kazak and 23 reference groups. We detected the level of the expected heterozygosity ranging from 0.3605 at HLD39 locus to 0.5000 at HLD136 locus and the observed heterozygosity ranging from 0.3548 at HLD39 locus to 0.5283 at HLD136 locus. The combined power of discrimination and the combined power of exclusion for all 30 loci in the studied Kazak group were 0.999999999999128 and 0.9945, respectively. The dataset generated in this study indicated the panel of 30 InDels was highly efficient in forensic individual identifcation but may not have enough power in paternity cases. The results of the interpopulation differentiations, PCA plots, phylogenetic trees and STRUCTURE analyses showed a close genetic affiliation between the Kazak and Uigur group.
Keywords: Kazak group, InDel, population genetics, interpopulation differentiation, phylogenetic tree
INTRODUCTION
In the last few years, a novel polymorphic marker, insertion and deletion polymorphisms (InDels), gained increased concern and attention in the field of medical and forensic genetics. InDels as biallelic markers combine desirable characteristics of both single nucleotide polymorphisms (SNPs) and short tandem repeats (STRs), becoming promising genetic markers for forensic purposes. InDels could be readily analyzed by capillary electrophoresis which is relatively common in the forensic DNA laboratories [1]. Moreover, InDels have small amplicons and relatively low mutation rates, which makes them more applicable for degraded or ancient DNA analyses [2, 3]. Besides the purpose of forensic caseworks, ancestry informative InDels can be good candidates for biogeographic ancestry analyses since the allele frequencies of InDels are significantly different between different groups or populations [4].
The Kazak national minority whose population exceeds a million mainly lives in the Ili Kazak Autonomous Prefecture, Barkol Kazak Autonomous County and Mori Kazak Autonomous County in the Xinjiang Uygur Autonomous Region, China. Some are located in Qinghai and Gansu Provinces (http://en.people.cn/102759/102835/7562907.html). To date, one commercial kit, Qiagen Investigator DIPplex reagent (Qiagen, Hilden, Germany), has been applied in multiplex amplification of 30 autosomal InDels. Previous population studies have been done and published using the kit [5–8]. In order to further clarify the genetic background and origin of the Kazak ethnic minority, we collected bloodstain samples from Kazak group in Xinjiang Uygur Autonomous Region and obtained population data using the kit mentioned above. Then we calculated the statistical parameters of the 30 autosomal InDel loci and evaluated the population genetic differentiations between Kazak and 23 previously published populations.
RESULTS AND DISCUSSIONS
Forensic statistical parameter analysis
Allele frequencies and forensic efficiency parameters of 30 InDels in Kazak group were shown in Figure 1 and Supplementary Table 1. Having applied the Bonferroni correction, Hardy-Weinberg equilibrium (HWE) test showed no significant deviation from the expected value (p>0.0017), with the lowest p value at HLD97 locus (0.0455). We observed the expected heterozygosity (He) ranging from 0.3605 (HLD39) to 0.5000 (HLD136) and the observed heterozygosity (Ho) ranging from 0.3548 (HLD39) to 0.5283 (HLD136). The match probability (MP), the typical paternity index (TPI) and the polymorphic information content (PIC) were in the range of 0.3619 to 0.4736, 0.7749 to 1.0599 and 0.2955 to 0.3750, with a mean value of 0.3971, 0.9344 and 0.3555, respectively. The power of discrimination (DP) ranged from 0.5264 (HLD39) to 0.6381 (HLD101). The highest value of the power of exclusion (PE) was 0.2135 observed at HLD136 locus, while the lowest value was 0.0887 at HLD39 locus. The combined power of discrimination (CDP) and the combined power of exclusion (CPE) for all 30 loci in Kazak group were 0.999999999999128 and 0.9945, respectively. The high CDP demonstrated the sufficient potential of the 30 InDels in forensic individual identification. However, compared with the previous study concerning 21 STR loci in Kazak group [9], the CPE value was relatively low, which suggested that the panel of 30 InDels could just be treated as a supplement for STR loci in kinship analyses.
Figure 1.
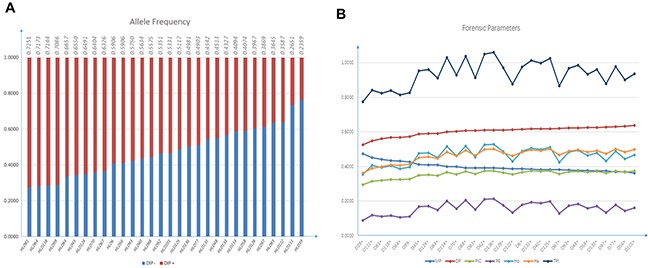
Plots graphs of allele frequency (A) and forensic parameters (B) of Kazak group on 30 InDel loci. The frequencies of insertion alleles were presented on the top of (A).
Linkage disequilibrium analysis
Linkage disequilibrium test between 30 InDels was carried out using the SNPAnalyzer program. As shown in Supplementary Figure 1, no crimson color coated by thick black curve existing in the graph and there was no significant LD observed between pairwise InDels with the values of r2 less than 0.1(data not shown). Thus, these genetic markers could be regarded as relatively independent in the subsequent statistical analyses.
Interpopulation differentiations
Interpopulation differentiations were compared using the analyses of molecular variance (AMOVA) method. As shown in Supplementary Table 2, we calculated pairwise p values between the studied Kazak group and 23 previously published populations including Kazak1 [7], Uigur [7], Yi [10], Xibe [11], Tujia [12], South Korean [13], She [14], two Tibetan groups [15], three Han populations [7, 14, 16] in different regions, six Mexican groups [17], four European groups and Uruguayan group [18–21] (The geographical locations of the studied Kazak and other reference populations were shown in Supplementary Figure 2) based on allele frequencies of 30 InDel loci. The least differences were observed between the studied Kazak group and Kazak1, Uigur groups with significant differences at 1, 6 loci, respectively. While the most significant differences were found between Kazak group and six Mexican groups at 21-26 loci. Among the 30 loci, the HLD111 and HLD81 loci showed the highest population genetic differentiations with significant differences between Kazak group and 21 other compared populations, and the HLD77, HLD93, HLD101 and HLD136 loci had the lowest ethnic diversities with just 7 pair-wise populations. The present results showed that there were significant differences in allele frequency distributions of some InDel loci among different ethnic groups. Hence, study of more InDel allelic distributions in more populations may be required for the forensic application researches.
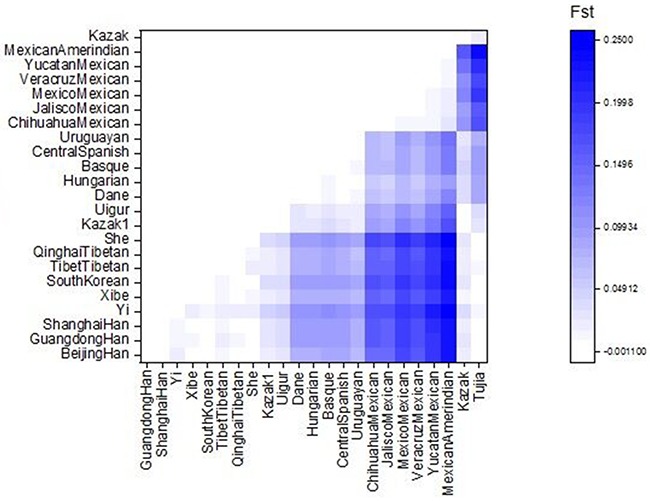
As shown in Figure 2, a heat map of pairwise Fst of Kazak and other referenced population was carried out by R statistical software [22]. A shade of blue color in the heat map represents the genetic distances of pairwise populations. The darker color stands for the bigger Fst value and the farther genetic relationship. On the contrary, the lighter color stands for the samller Fst value and the closer genetic relationship. It is obvious that close genetic relationships could be observed again between the studied Kazak group and Kazak1, Uigur groups, which would be displayed directly as labels of the lighter color for their pairwise Fst values.
Figure 2. Plots of pairwise Fst of Kazak and other 23 reference populations.
PCA and STRUCTURE analysis
The principal component analyses (PCA) were conducted between Kazak group and other 23 populations utilizing the softwares of EIGENSOFT 6.0.1 [23] and MATLAB 2007a, respectively. As shown in Figure 3a, 24 populations were divided into four main regions in good accordance with their geographic distributions, that is East Asians (Han, Yi, Tujia, Tibetan, South Korean, Xibe and She); Europeans (Basque, Central Spanish, Dane, Uruguayan and Hungarian); Mexicans and Central Asians (Kazak, Kazak1 and Uigur). The Kazak, Kazak1 and Uigur groups as expected scattered in the middle of East Asians and Europeans, which revealed the close genetic relationship between Kazak and Uigur groups. In another PCA plot (shown in Figure 3b), the first two principal components accounted for 88.60% of the total variance. Four distinct areas were observed, and the Kazak group similarly clustered to the Kazak1 and Uigur groups.
Figure 3. PCA analyses based on 30 InDel loci.
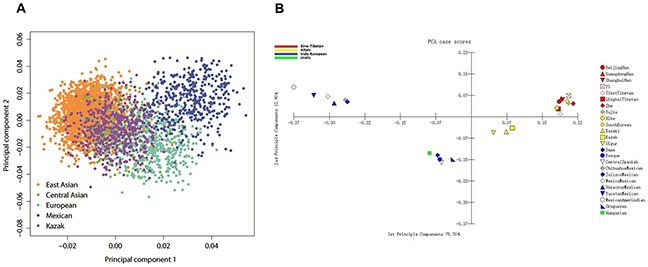
(A) Kazak, East Asian, Central Asian, Mexican and European populations were analyzed at individual level. (Here, European populations included Basque, Central Spanish, Dane, Hungarian as well as Uruguayan populations.) (B) The studied Kazak group and other 23 published populations.
We then carried out the STRUCTURE analysis of the 24 populations with ADMIXTURE v1.23 software [24] which is a useful tool to infer individual genetic ancestry coefficients by conditioning the value of K (the number of hypothetical ancestral populations) and thus analyze population structure. Although the 30 InDel loci are not ideal ancestry informative markers and have limited differentiation power, they were still efficient to distinguish ancestries of the studied Kazak and other populations to some extent. As shown in Figure 4a, the ancestry components of Kazak group were similar to that of Central Asians (Uigur and Kazak1 groups) with different K value. Of course, it is still need more effective ancestry informative markers to identify and estimate ancestry components of admixtures better in the later studies. Moreover, we performed the population structure analysis again with the STRUCTURE program v2.2, which is given in Figure 4b. At K=2, the Asians and Europeans were almost entirely filled with yellow and blue component, respectively. Meanwhile, the Kazak, Kazak1 and Uigur groups represented a mixture of blue and yellow components. Uigur and Kazak groups could be better separated from Europeans and East Asians at K=3, which was in accordance with the result of output posterior probabilities that K=3 was the most appropriate and suitable configuration (shown in Supplementary Figure 3).
Figure 4.
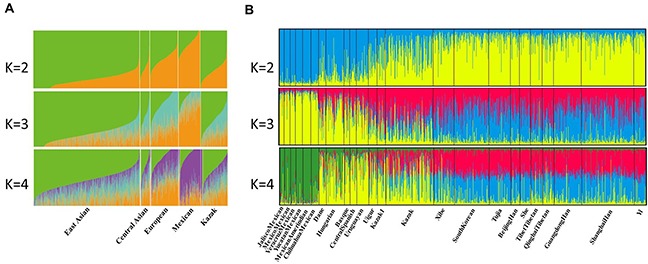
(A) Admixture analysis of 24 populations at K=2, 3, 4 using ADMIXTURE program. (B) STRUCTURE analysis conducted with STRUCTURE program v2.2.
Genetic distances and phylogenetic analysis
Genetic distance (DA distance) reveals the genetic divergence between different populations. Populations with similar allelic distributions have small genetic distances. In order to estimate the genetic distances between the Kazak and 23 reference populations, we calculated DA values on the basis of 30 InDels. As presented in Table 1, the smallest distance was showed between the Kazak and Kazak1 group (DA=0.0007), followed by Uigur group with DA=0.0016. And the largest genetic distance was found with Mexican Amerindian group (DA=0.0526), which were consistent with the Fst and PCA results mentioned above.
Table 1. The values of DA of pairwise populations among Chinese Kazak group and referenced populations.
| Populations | BeijingHan | Guangdong Han | ShanghaiHan | Yi | Xibe | SouthKorean | TibetTibetan | QinghaiTibetan | She | Kazak1 | Uigur | Dane | Hungarian | Basque | CentralSpanish | Uruguayan | ChihuahuaMexican | JaliscoMexican | MexicoMexican | VeracruzMexican | YucatanMexican | MexicanAmerindian | Kazak |
|---|---|---|---|---|---|---|---|---|---|---|---|---|---|---|---|---|---|---|---|---|---|---|---|
| Guangdong-Han | 0.0019 | ||||||||||||||||||||||
| Shanghai-Han | 0.0011 | 0.0006 | |||||||||||||||||||||
| Yi | 0.0054 | 0.0038 | 0.0040 | ||||||||||||||||||||
| Xibe | 0.0022 | 0.0023 | 0.0015 | 0.0052 | |||||||||||||||||||
| South-Korean | 0.0024 | 0.0017 | 0.0008 | 0.0042 | 0.0016 | ||||||||||||||||||
| Tibet-Tibetan | 0.0029 | 0.0050 | 0.0036 | 0.0066 | 0.0034 | 0.0037 | |||||||||||||||||
| Qinghai-Tibetan | 0.0022 | 0.0034 | 0.0021 | 0.0056 | 0.0019 | 0.0023 | 0.0012 | ||||||||||||||||
| She | 0.0023 | 0.0015 | 0.0019 | 0.0051 | 0.0032 | 0.0028 | 0.0059 | 0.0041 | |||||||||||||||
| Kazak1 | 0.0083 | 0.0100 | 0.0096 | 0.0133 | 0.0068 | 0.0115 | 0.0072 | 0.0075 | 0.0112 | ||||||||||||||
| Uigur | 0.0100 | 0.0118 | 0.0114 | 0.0163 | 0.0092 | 0.0135 | 0.0091 | 0.0089 | 0.0133 | 0.0013 | |||||||||||||
| Dane | 0.0251 | 0.0265 | 0.0264 | 0.0315 | 0.0227 | 0.0288 | 0.0242 | 0.0235 | 0.0275 | 0.0093 | 0.0083 | ||||||||||||
| Hungarian | 0.0255 | 0.0275 | 0.0271 | 0.0325 | 0.0231 | 0.0295 | 0.0237 | 0.0232 | 0.0289 | 0.0084 | 0.0068 | 0.0026 | |||||||||||
| Basque | 0.0270 | 0.0268 | 0.0270 | 0.0328 | 0.0236 | 0.0287 | 0.0261 | 0.0256 | 0.0288 | 0.0111 | 0.0096 | 0.0048 | 0.0045 | ||||||||||
| Central-Spanish | 0.0262 | 0.0269 | 0.0268 | 0.0323 | 0.0226 | 0.0288 | 0.0236 | 0.0235 | 0.0285 | 0.0085 | 0.0069 | 0.0030 | 0.0022 | 0.0033 | |||||||||
| Uruguayan | 0.0230 | 0.0244 | 0.0240 | 0.0286 | 0.0203 | 0.0258 | 0.0207 | 0.0201 | 0.0255 | 0.0067 | 0.0057 | 0.0039 | 0.0021 | 0.0043 | 0.0023 | ||||||||
| Chihuahua-Mexican | 0.0445 | 0.0471 | 0.0465 | 0.0522 | 0.0441 | 0.0500 | 0.0460 | 0.0442 | 0.0525 | 0.0278 | 0.0241 | 0.0183 | 0.0156 | 0.0212 | 0.0200 | 0.0207 | |||||||
| Jalisco-Mexican | 0.0437 | 0.0450 | 0.0448 | 0.0512 | 0.0420 | 0.0484 | 0.0452 | 0.0430 | 0.0502 | 0.0260 | 0.0225 | 0.0170 | 0.0137 | 0.0197 | 0.0181 | 0.0189 | 0.0017 | ||||||
| Mexico-Mexican | 0.0534 | 0.0548 | 0.0544 | 0.0602 | 0.0517 | 0.0576 | 0.0545 | 0.0528 | 0.0606 | 0.0345 | 0.0313 | 0.0222 | 0.0210 | 0.0256 | 0.0258 | 0.0274 | 0.0048 | 0.0041 | |||||
| Veracruz-Mexican | 0.0498 | 0.0500 | 0.0502 | 0.0566 | 0.0473 | 0.0535 | 0.0501 | 0.0483 | 0.0555 | 0.0301 | 0.0263 | 0.0192 | 0.0160 | 0.0209 | 0.0197 | 0.0223 | 0.0040 | 0.0024 | 0.0030 | ||||
| Yucatan-Mexican | 0.0588 | 0.0599 | 0.0598 | 0.0675 | 0.0569 | 0.0633 | 0.0613 | 0.0587 | 0.0655 | 0.0391 | 0.0351 | 0.0267 | 0.0230 | 0.0277 | 0.0279 | 0.0300 | 0.0048 | 0.0046 | 0.0041 | 0.0031 | |||
| Mexicann-Amerindian | 0.0718 | 0.0724 | 0.0732 | 0.0798 | 0.0698 | 0.0770 | 0.0752 | 0.0718 | 0.0796 | 0.0519 | 0.0477 | 0.0365 | 0.0317 | 0.0389 | 0.0393 | 0.0427 | 0.0093 | 0.0090 | 0.0087 | 0.0064 | 0.0053 | ||
| Kazak | 0.0064 | 0.0079 | 0.0073 | 0.0115 | 0.0048 | 0.0087 | 0.0060 | 0.0057 | 0.0093 | 0.0007 | 0.0016 | 0.0100 | 0.0092 | 0.0115 | 0.0092 | 0.0073 | 0.0285 | 0.0267 | 0.0355 | 0.0309 | 0.0404 | 0.0526 | |
| Tujia | 0.0013 | 0.0007 | 0.0004 | 0.0040 | 0.0015 | 0.0009 | 0.0035 | 0.0023 | 0.0019 | 0.0104 | 0.0125 | 0.0272 | 0.0281 | 0.0281 | 0.0277 | 0.0250 | 0.0495 | 0.0480 | 0.0576 | 0.0534 | 0.0632 | 0.0764 | 0.0079 |
We further conducted phylogenetic reconstruction on the basis of two different methods. An unrooted tree was constructed by the PHYLIP software (version3.6) based on the allele frequencies of all InDel loci, revealing the genetic relationships between studied kazak group and other compared populations. As shown in the Figure 5a, the branch on the top side contained ten East Asian groups, whereas the lower one consisted of Uruguayan group, four European populations and six Mexican populations. The Kazak, Kazak1 and Uigur groups were in the middle of the above two branches. Based on the DA distances, a phylogenetic tree reconstructed by MAGA software using neighbor joining (N-J) method was in the Figure 5b, and two main clusters could be seen from the dendrogram. The first cluster was composed of the East Asian groups, Central Asian groups(Kazak, Kazak1 and Uigur groups), Uruguayan group, as well as European groups, while the second one consisted of six Mexican groups. The Kazak group firstly tended to cluster together with Kazak1 and Uigur groups, and then with other groups, which indicated close relationships between the studied Kazak and Kazak1, Uigur groups. Yuan et al. represented a N-J tree with regard to 21 autosomal STR loci and also found Kazak was closely related to Uigur [10]. The dendrogram based on 17 Y-chromosomal STRs indicated the close relationship between Kazak and Uigur as well [25]. The same results were also obtained from the previous HLA and mtDNA studies [26, 27]. The clustering results of phylogenetic trees were in good accordance with the above results of the inter-population differentiations, PCA plots, genetic distances and STRUCTURE analyses. In Chinese history, Uigurs belonged to a branch of Turkic people, while the Kazaks were formed as a result of the long-term development of the Turkic, Wusun, Khitan and Mongolian people. Furthermore, Kazaks and Uigurs were the main populations in the Silk Road of ancient China and they shared the common religious belief and culture, which indicated the two groups located in Central Asia have had a close geographic connection since ancient times. Therefore, the gene flow might exist and bring about the close affiliation between Kazak and Uigur groups.
Figure 5. Phylogenetic trees constructed to analyze phylogenetic relationships between Kazak group and 23 reference populations.
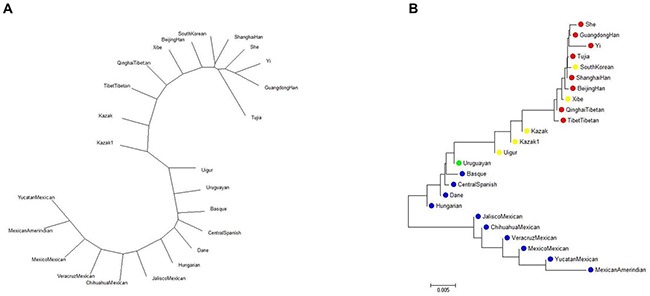
(A) On the basis of allele frequencies of 30 InDels conducted by PHYLIP software. (B) With the method of MAGA software (version5.0) based on DA values calculated by DISPAN program.
MATERIALS AND METHODS
Samples collection and DNA isolation
Bloodstain samples were collected from 513 un- related healthy individuals (200 males and 313 females) from Kazak group residing in Xinjiang Uygur Autonomous Region, China. Written informed consents were acquired from all participants involved in this study. The research was carried out according to the human and ethical research principles of Xi’an Jiaotong University Health Science Center, China and approved by the ethics committee of Xi’an Jiaotong University Health Science Center. In the process of collecting samples, it must be ensured that any two individuals have no any blood relationship within at least three generations. Human genomic DNA was isolated from bloodstain samples utilizing the method of Chelex-100 [28].
PCR amplification and InDels genotyping
A multiple PCR amplification with fluorescent of autosomal 30 InDels was conducted with Investigator DIPplex reagent (Qiagen, Hilden, Germany) in a single multiplex reaction on GeneAmp PCR System 9700 thermal cycler (Applied Biosystems, Foster City, CA, USA) following manufacturer's instructions. InDel genotyping was performed with capillary electrophoresis on ABI 3500 Genetic Analyzer (Applied Biosystems, Foster City, CA, USA) and analyzed by GeneMapper v3.2 software (Applied Biosystems, Foster City, CA, USA).
Statistical analysis
Allele frequency distributions and forensic statis-tical parameters including HWE, MP, Ho, PE, DP, PIC and TPI of 30 InDel loci were computed with the modified Powerstat (version1.2) spreadsheet (Promega, Madison, WI, USA). And the He values were calculated as described previously [29]. The locus-by-locus p values were estimated by Arlequin software (version3.0) using the AMOVA method. The heat map of pairwise Fst was carried out in R statistical software v3.0.2. The SNPAnalyzer (version2.0 Istech, South Korea) was used to test LD for all pair-wise InDels. Two PCA plots were carried out in EIGENSOFT v6.0.1 software and MATLAB 2007a (MathWorks Inc., USA), respectively. Population genetic structure analyses were performed with the ADMIXTURE v1.23 and STRUCTURE v2.2 programs. Two phylogenic trees were conducted by PHYLIP (version3.6) software via allele frequencies of 30 InDels, as well as MAGA software (version5.0) based on DA values, respectively.
CONCLUSION
In this study, we obtained the allele frequencies and forensic parameters of the autosomal 30 InDels for the research of population genetics and forensic sciences. And we found the panel was highly efficient in forensic individual identification but could only be used as supplementary markers for STR loci in paternity cases. The results of the interpopulation differentiations, PCA plots, phylogenic trees and STRUCTURE analyses indicated a close genetic relationship between Kazak and Uigur groups. In order to better understand the origin and genetic background of Kazak group, further study should be conducted in later research.
SUPPLEMENTARY MATERIALS FIGURES AND TABLES
Acknowledgments
This project was supported by the National Natural Science Foundation of China (NSFC, No. 81525015, 81471824, 81373248). The authors would like to thank Jiangwei Yan for helping us to draw the Figure 2.
Footnotes
CONFLICTS OF INTEREST
The authors have declared no conflicts of interest.
REFERENCES
- 1.Pereira R, Phillips C, Alves C, Amorim A, Carracedo A, Gusmao L. A new multiplex for human identification using insertion/deletion polymorphisms. Electrophoresis. 2009;30:3682–3690. doi: 10.1002/elps.200900274. [DOI] [PubMed] [Google Scholar]
- 2.Fondevila M, Phillips C, Santos C, Pereira R, Gusmao L, Carracedo A, Butler JM, Lareu MV, Vallone PM. Forensic performance of two insertion-deletion marker assays. Int J Legal Med. 2012;126:725–737. doi: 10.1007/s00414-012-0721-7. [DOI] [PubMed] [Google Scholar]
- 3.Pereira R, Phillips C, Alves C, Amorim A, Carracedo Á, Gusmão L. Insertion/deletion polymorphisms: a multiplex assay and forensic applications. Forensic Sci Int. 2009;2:513–515. [Google Scholar]
- 4.Li JZ, Absher DM, Tang H, Southwick AM, Casto AM, Ramachandran S, Cann HM, Barsh GS, Feldman M, Cavalli-Sforza LL, Myers RM. Worldwide human relationships inferred from genome-wide patterns of variation. Science. 2008;319:1100–1104. doi: 10.1126/science.1153717. [DOI] [PubMed] [Google Scholar]
- 5.LaRue BL, Ge J, King JL, Budowle B. A validation study of the Qiagen Investigator DIPplex(R) kit; an INDEL-based assay for human identification. Int J Legal Med. 2012;126:533–540. doi: 10.1007/s00414-012-0667-9. [DOI] [PubMed] [Google Scholar]
- 6.Neuvonen AM, Palo JU, Hedman M, Sajantila A. Discrimination power of Investigator DIPplex loci in Finnish and Somali populations. Forensic Sci Int Genet. 2012;6:e99–e102. doi: 10.1016/j.fsigen.2011.09.005. [DOI] [PubMed] [Google Scholar]
- 7.Wei YL, Qin CJ, Dong H, Jia J, Li CX. A validation study of a multiplex INDEL assay for forensic use in four Chinese populations. Forensic Sci Int Genet. 2014;9:e22–25. doi: 10.1016/j.fsigen.2013.09.002. [DOI] [PubMed] [Google Scholar]
- 8.Zidkova A, Horinek A, Kebrdlova V, Korabecna M. Application of the new insertion-deletion polymorphism kit for forensic identification and parentage testing on the Czech population. Int J Legal Med. 2013;127:7–10. doi: 10.1007/s00414-011-0649-3. [DOI] [PMC free article] [PubMed] [Google Scholar]
- 9.Yuan JY, Wang XY, Shen CM, Liu WJ, Yan JW, Wang HD, Pu HW, Wang YL, Yang G, Zhang YD, Meng HT, Jing H, Zhu BF. Genetic profile characterization and population study of 21 autosomal STR in Chinese Kazak ethnic minority group. Electrophoresis. 2014;35:503–510. doi: 10.1002/elps.201300398. [DOI] [PubMed] [Google Scholar]
- 10.Zhang YD, Shen CM, Jin R, Li YN, Wang B, Ma LX, Meng HT, Yan JW, Dan Wang H, Yang ZL, Zhu BF. Forensic evaluation and population genetic study of 30 insertion/deletion polymorphisms in a Chinese Yi group. Electrophoresis. 2015;36:1196–1201. doi: 10.1002/elps.201500003. [DOI] [PubMed] [Google Scholar]
- 11.Meng HT, Zhang YD, Shen CM, Yuan GL, Yang CH, Jin R, Yan JW, Wang HD, Liu WJ, Jing H, Zhu BF. Genetic polymorphism analyses of 30 InDels in Chinese Xibe ethnic group and its population genetic differentiations with other groups. Sci Rep. 2015;5:8260. doi: 10.1038/srep08260. [DOI] [PMC free article] [PubMed] [Google Scholar]
- 12.Shen C, Zhu B, Yao T, Li Z, Zhang Y, Yan J, Wang B, Bie X, Tai F. A 30-InDel assay for genetic variation and population structure analysis of Chinese Tujia Group. Sci Rep. 2016;6:36842. doi: 10.1038/srep36842. [DOI] [PMC free article] [PubMed] [Google Scholar]
- 13.Seong KM, Park JH, Hyun YS, Kang PW, Choi DH, Han MS, Park KW, Chung KW. Population genetics of insertion-deletion polymorphisms in South Koreans using Investigator DIPplex kit. Forensic Sci Int Genet. 2014;8:80–83. doi: 10.1016/j.fsigen.2013.06.013. [DOI] [PubMed] [Google Scholar]
- 14.Wang Z, Zhang S, Zhao S, Hu Z, Sun K, Li C. Population genetics of 30 insertion-deletion polymorphisms in two Chinese populations using Qiagen Investigator(R) DIPplex kit. Forensic Sci Int Genet. 2014;11:e12–14. doi: 10.1016/j.fsigen.2014.03.017. [DOI] [PubMed] [Google Scholar]
- 15.Guo Y, Shen C, Meng H, Dong Q, Kong T, Yang C, Wang H, Jin R, Zhu B. Population differentiations and phylogenetic analysis of Tibet and Qinghai Tibetan Groups based on 30 InDel loci. DNA Cell Biol. 2016;35:787–794. doi: 10.1089/dna.2016.3395. [DOI] [PubMed] [Google Scholar]
- 16.Hong L, Wang XG, Liu SJ. Genetic polymorphisms of 30 Indel loci in Guangdong Han population. J Sun Yat-sen Univ. (Med Sci) 2013;34:299–304. [Google Scholar]
- 17.Martínez-Cortés G, García-Aceves M, Favela-Mendoza AF, Muñoz-Valle JF, Velarde-Felix JS, Rangel-Villalobos H. Forensic parameters of the Investigator DIPplex kit (Qiagen) in six Mexican populations. Int J Legal Med. 2016;130:683–685. doi: 10.1007/s00414-015-1242-y. [DOI] [PubMed] [Google Scholar]
- 18.Friis SL, Borsting C, Rockenbauer E, Poulsen L, Fredslund SF, Tomas C, Morling N. Typing of 30 insertion/deletions in Danes using the first commercial indel kit--Mentype(R) DIPplex. Forensic Sci Int Genet. 2012;6:e72–74. doi: 10.1016/j.fsigen.2011.08.002. [DOI] [PubMed] [Google Scholar]
- 19.Kis Z, Zalan A, Volgyi A, Kozma Z, Domjan L, Pamjav H. Genome deletion and insertion polymorphisms (DIPs) in the Hungarian population. Forensic Sci Int Genet. 2012;6:e125–126. doi: 10.1016/j.fsigen.2011.09.004. [DOI] [PubMed] [Google Scholar]
- 20.Martin P, Garcia O, Heinrichs B, Yurrebaso I, Aguirre A, Alonso A. Population genetic data of 30 autosomal indels in Central Spain and the Basque Country populations. Forensic Sci Int Genet. 2013;7:e27–30. doi: 10.1016/j.fsigen.2012.10.003. [DOI] [PubMed] [Google Scholar]
- 21.Saiz M, Andre F, Pisano N, Sandberg N, Bertoni B, Pagano S. Allelic frequencies and statistical data from 30 INDEL loci in Uruguayan population. Forensic Sci Int Genet. 2014;9:e27–29. doi: 10.1016/j.fsigen.2013.07.013. [DOI] [PubMed] [Google Scholar]
- 22.Dean CB, Nielsen JD. Generalized linear mixed models: a review and some extensions. Lifetime Data Anal. 2007;13:497–512. doi: 10.1007/s10985-007-9065-x. [DOI] [PubMed] [Google Scholar]
- 23.Price AL, Patterson NJ, Plenge RM, Weinblatt ME, Shadick NA, Reich D. Principal components analysis corrects for stratification in genome-wide association studies. Nat Genet. 2006;38:904–909. doi: 10.1038/ng1847. [DOI] [PubMed] [Google Scholar]
- 24.Alexander DH, Novembre J, Lange K. Fast model-based estimation of ancestry in unrelated individuals. Genome Res. 2009;19:1655–1664. doi: 10.1101/gr.094052.109. [DOI] [PMC free article] [PubMed] [Google Scholar]
- 25.Mei T, Zhang LP, Liu YS, Chen JG, Meng HT, Yan JW, Zhu BF. 24 Y-chromosomal STR haplotypic structure for Chinese Kazak ethnic group and its genetic relationships with other groups. Int J Legal Med. 2016;130:1199–1201. doi: 10.1007/s00414-016-1331-6. [DOI] [PubMed] [Google Scholar]
- 26.Comas D, Calafell F, Mateu E, Perez-Lezaun A, Bosch E, Martinez-Arias R, Clarimon J, Facchini F, Fiori G, Luiselli D, Pettener D, Bertranpetit J. Trading genes along the silk road: mtDNA sequences and the origin of central Asian populations. Am J Human Genet. 1998;63:1824–1838. doi: 10.1086/302133. [DOI] [PMC free article] [PubMed] [Google Scholar]
- 27.Zhang XN, Liu YG, Pazilaiti Li D, Li X, Huang RX, Li GQ, Zhu DL, Geng ZC. Polymorphism of HLA-DQA1,-DQB1 genes in Uygur and Kazak ethnic groups and comprehensive analysis of 25 related populations. Yi Chuan Xue Bao. 1998;25:193–198. [PubMed] [Google Scholar]
- 28.Walsh PS, Metzger DA, Higushi R. Chelex 100 as a medium for simple extraction of DNA for PCR-based typing from forensic material. BioTechniques. 1991 2013 Apr;1054:506–13. 134–139. doi: 10.2144/000114018. BioTechniques. [DOI] [PubMed] [Google Scholar]
- 29.Nei M. Estimation of average heterozygosity and genetic distance from a small number of individuals. Genetics. 1978;89:583–590. doi: 10.1093/genetics/89.3.583. [DOI] [PMC free article] [PubMed] [Google Scholar]
Associated Data
This section collects any data citations, data availability statements, or supplementary materials included in this article.


