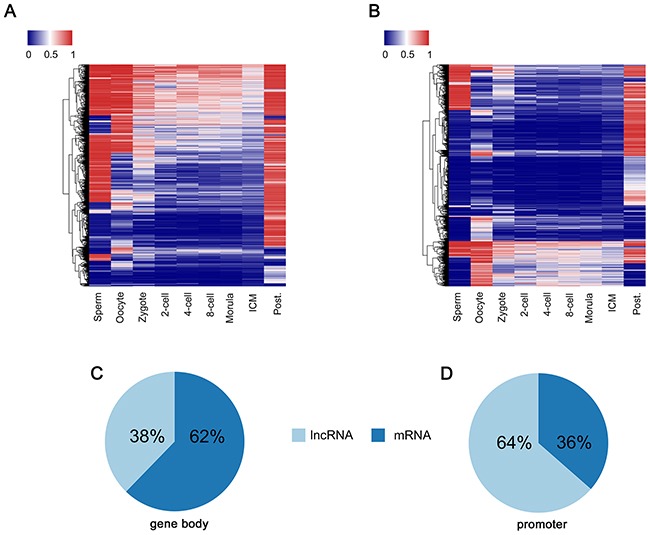
Figure 5. D-DMRs analysis through QDMR based on entropy.

(A) Heat map of the methylation level of D-DMRs in lncRNA regions across each developmental stages. (B) Heat map of the methylation level of D-DMRs in protein-coding gene regions across each developmental stages. (C) The ratio of lncRNA and protein-coding genes in D-DMRs among gene body regions. (D) The ratio of lncRNA and protein-coding genes in D-DMRs among promoter regions.
